Appendix 1.1: Levels and trajectories of SHD at the local level
Within the debate on the level and trajectories of SHD in LDSs (especially regarding clusters and industrial districts), the distinction between the low road and high road to development (Pyke and Sengenberger, 1992) has typically represented a point of departure for further work.
On the basis of the capacity of local key stakeholders to upgrade productive and institutional mechanisms, Pyke and Sengenberger (1992) distinguish between:
• The low road, characterized by limited interaction, specialization and cooperation between SMEs, a scarcely dynamic local government and modest levels of investments and degrees of institutional changes, along with the exploitation of a low-wage and relatively unskilled workforce.
• The high road, composed of wide and inter-sectoral forms of participation among different local actors, able to compete and cooperate at the same time, stimulate investment in innovative technologies and in R&D and involving the employment of skilled workers, in order to pursue systemic efficiency, greater innovative capacity and competitiveness.
However, according to Nadvi and Schmitz (1994), among others, this dichotomy does not fully capture the dynamic processes of clustering. Mehrotra and Biggeri (2002 and 2007) include the neglected dimensions of social outcomes and environmental protection (such as social protection and quality of labour conditions offered in clusters), and identify a third pathway, the dirt road to development. In this scenario, many workers receive no social protection and may be exposed to deep health risks. Moreover, informal activities are pervasive, and in practice it is very difficult to involve informal sector enterprises in public support strategies (Chen and Carr, 2002; Mehrotra and Biggeri, 2002 and 2007; Bellandi et al., 2010). The dirt road to development represents a case where cluster upgrading follows a path opposed to SHD and decent work (see Figure A.1.1), which constrains the growth of the territorial system, as local productivity, workers' purchasing power and thus local demand for local products are limited (Altenburg and Meyer-Stamer, 1999).
The dirt road route indicates that social outcomes, which include BSS access, social integration and participation and environmental protection, need to be complemented and not deflected by collective economic efficiency in order to obtain high levels of SHD.
Underlying the routes pursued by a specific LDS is the interaction between the four main structural elements shaping SHD at the local level (see
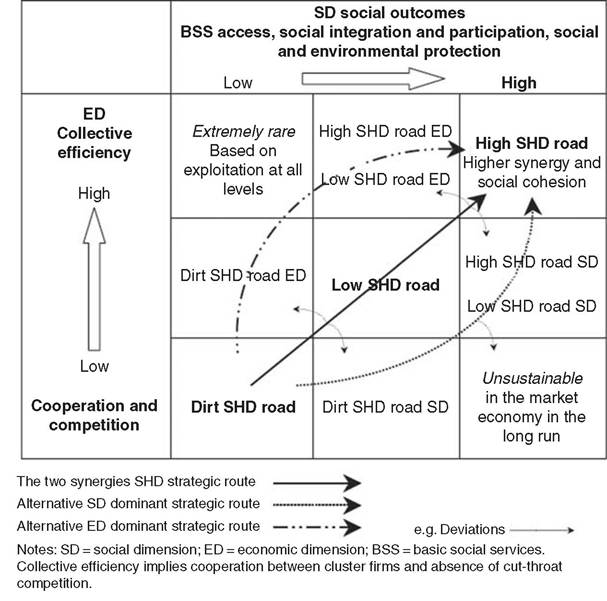
Figure A.1.1 SHD trajectories: High road, low road and dirt road Source: Adapted from Mehrotra and Biggeri (2007, p. 368).
section 1.4). The combination of these elements in conjunction with local resources determines the SHD trajectories pursued by a LDS (Figure A.1.2). In other words, measuring these trajectories means assessing the capacity of the local system to foster synergies and virtuous feedback loops between social and economic outcomes for the sake of creating territorial enabling factors for capabilities expansion.
In order to measure SHD progress as enhanced throughout virtuous synergies between the economic dimension (ED) and the social-political-civil dimension (SD), Biggeri and Mauro (2010) develop a statistical index able to valorize these synergies within LDSs. The aim is to obtain, for each unit i, a single value for the social components and a single value for the economic components. This is a way to represent each unit in a two-dimensional graph to observe the interaction between two dimensions.
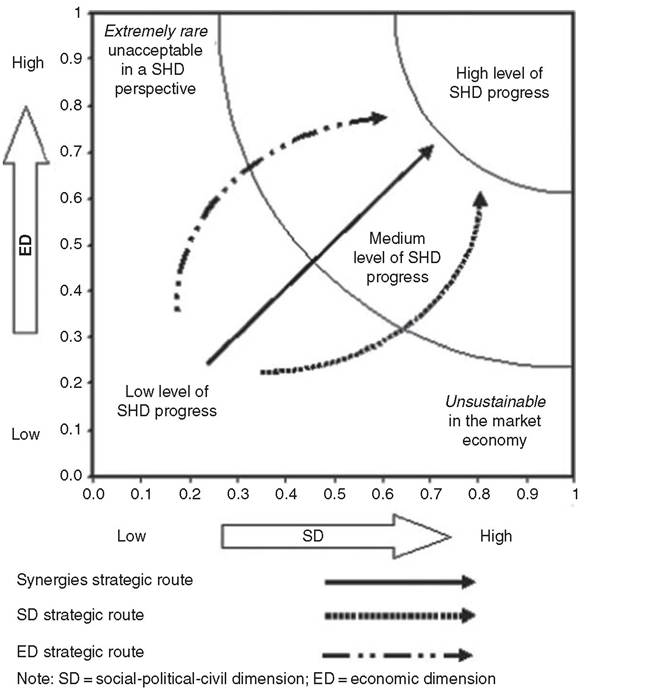
Figure A.1.2 Strategic routes for SHD Source: Biggeri and Mauro (2010, p. 9).
For each main dimension (ED and SD), a unidimensional index is compiled (where k is the number of variables j):
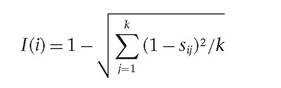
This is equivalent to 1 minus the quadratic mean of the differences between the value of the unit for each variable j and its maximum possible value (1, since the k variables for j are normalized).
In addition, I(i) is set between 0 and 1 and satisfies an important property:
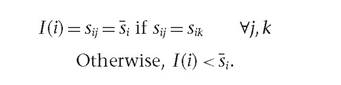
In other words, the value assumed by the index for a unit i equals the arithmetic mean Si if and only if all the elements of the row are the same (i.e.
if the variance of si1... sik is zero). As the variance of the elements of the row increases, the index assumes a lower value with respect to the arithmetic mean (i.e. favours the synergic strategy).A case study of the Tuscany provinces
Biggeri et al. (2014)27 analyse the SHD patterns of the ten Tuscany Provinces over the period 1998-2010, utilizing data with four-year lags (1998; 2002; 2006; 2010) to allow for observing potentially relevant deviations along development trajectories. For each dimension (ED and SD), data have been collected for the sub-dimensions listed in Table A.1.1.
The selection of provinces as the unit of analysis is justified on the grounds of the wider availability of data than for LDSs idenfied on functional boundaries (Bacci, 2002). Nonetheless, missing data in panel series (e.g. institutional variables regarding administrative time to start up new enterprises like the World Bank Doing Business indicators, diffusion of corruption) have limited the inclusion of important SHD indicators.
The results for selected provinces are illustrated in Figures A.1.3. It is not our goal to discuss these results at length here (see Biggeri et al., 2014 for a detailed discussion). However, it is worth emphasizing that similar path analyses with an evolutionary medium-term view not only allow us to explore the place-based SHD dynamics of specific territorial units but also permit us to comment on common features of their processes at upper (regional or national) levels. In addition, results within the ED and SD can be
Table A.1.1 Sub-dimensions for analysing the SHD patterns of Tuscany Provinces
| Economic dimension (ED) | Social dimension (SD) |
| Economic opportunities (4) Employment opportunities (3) Credit opportunities (4) Entrepreneurship opportunities (3) Investment opportunities (2) | Environmental opportunities (2) Education opportunities (3) Health opportunities (3) Participation and social capital opportunities (6) Equal opportunities of different social groups (8) |
Source: Biggeri et al. (2014).
No. of collected variables in brackets (for a total of 10 sub-dimensions and 41 indicators).
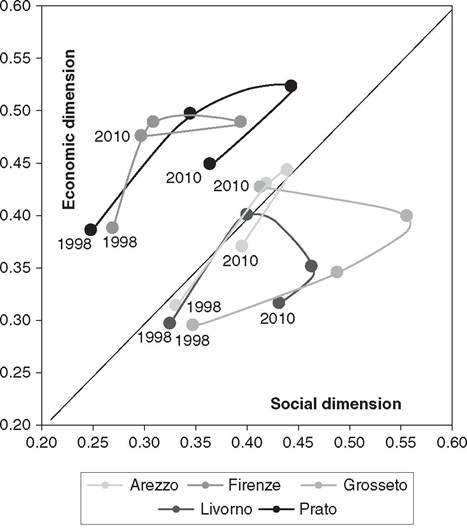
Figure A.1.3 SHD trajectories of selected Tuscany Provinces, 1998-2010 Source: Adapted from Biggeri et al. (2014).
disaggregated (Biggeri et al., 2014) in order to deepen our understanding of the development processes in each dimension. Finally, these measurements and analyses can be continuously updated and are likely to be replicable in other case studies for comparative purposes, with enough flexibility to adapt to specific territorial features (e.g. the inclusion of specific valuable opportunities in the dataset).