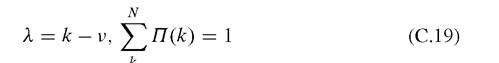
Appendix C An Elementary Derivation of the One-Dimensional Central Limit Theorem from the Random Walk
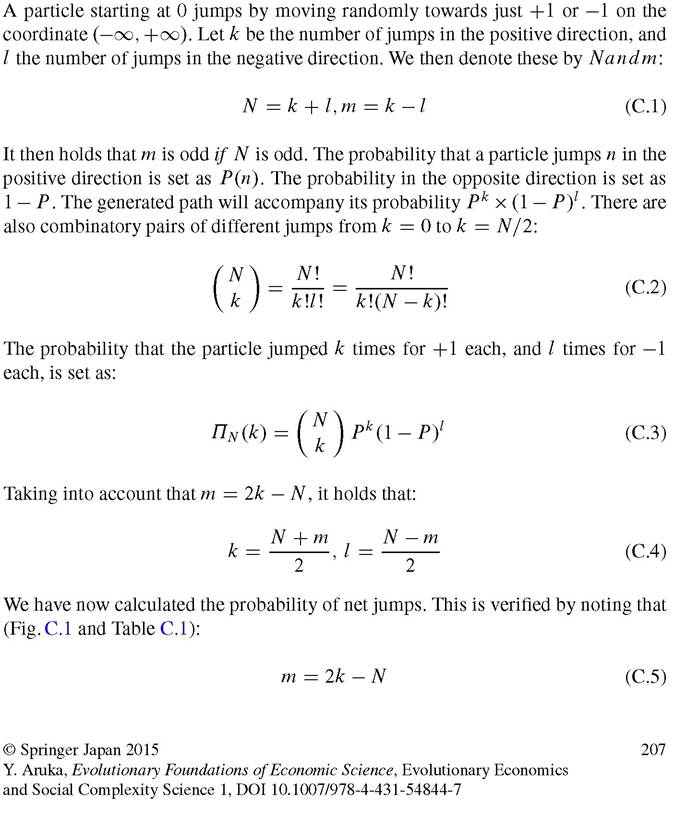
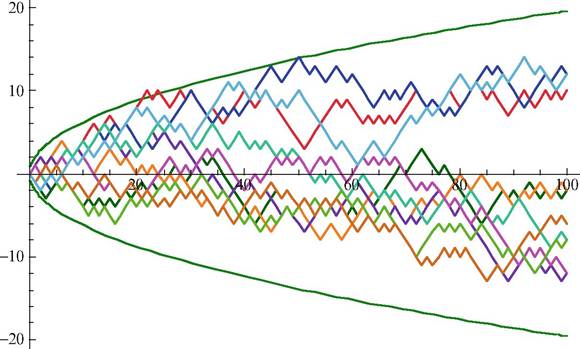
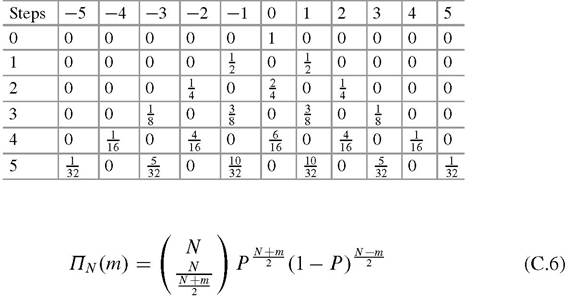
Fig.
C.1 Simple random walksTable C.1 The probability distribution of the one-dimensional random walk
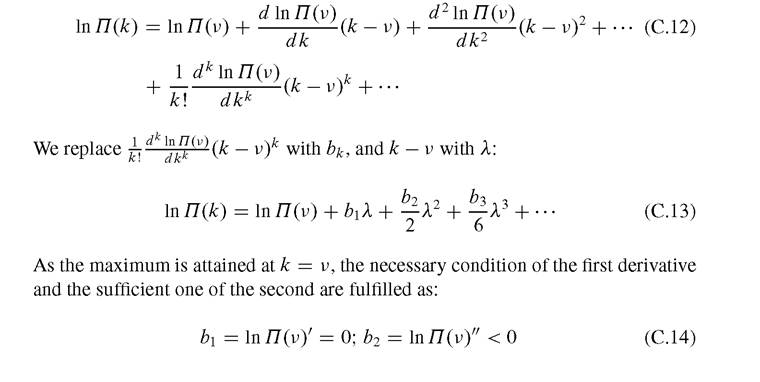
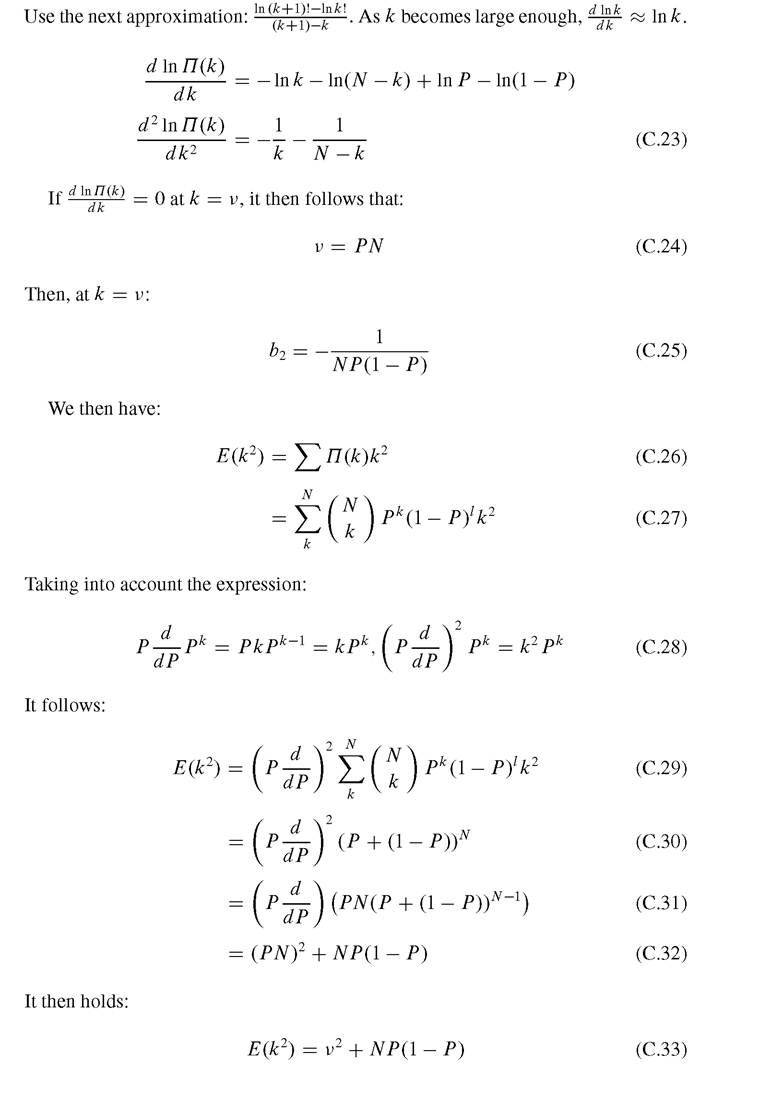
It then follows that:
C.1 The Derivation of the Density Function of the Normal Distribution[87] * *
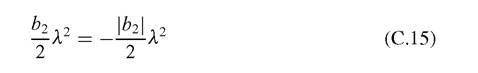
In the following, we will derive the density function of the normal distribution. We give a Taylor expansion around the maximum k = v on the function ln ∏(k), for convenience of calculation, instead of ∏(k).
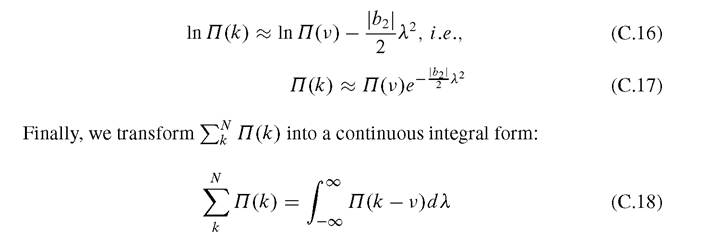
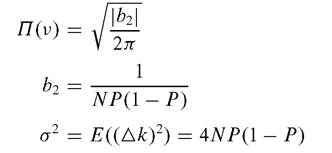
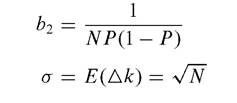
b2 becomes negative, and hence may be rewritten as:
We then assume that λ = k — v is small enough to ignore λ3, ∙ ∙ ∙,λk, and we may then reach the next approximation:
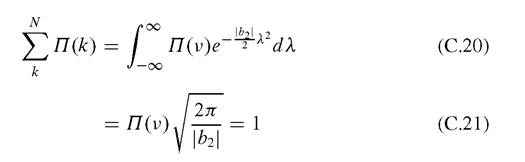
We note that:
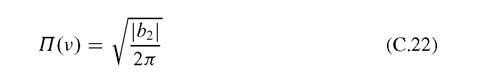
It then by the famous integral formula on a Gaussian function holds that:
And then:
We examine each item ∏(k).
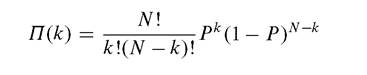
Since:

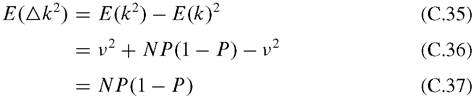
It then holds:
We denote E(∆k2) by σ2. This creates the next formula for the normal distribution:
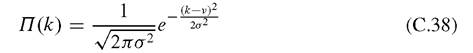
This is the density function of the normal distribution.
If p = 0.5 in the last equation, it holds that:
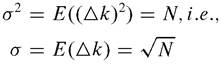
By σ2 = E((∆k)2) = N, it also holds that:
QED
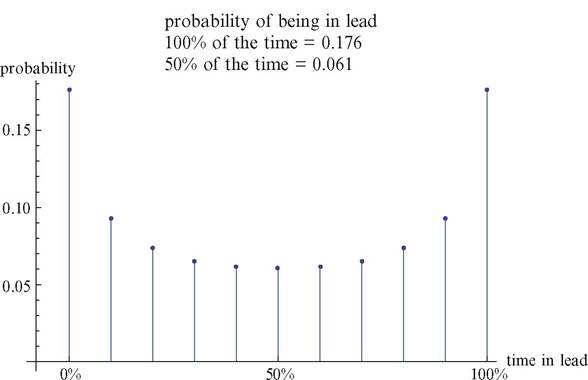
Fig. C.2 The probability of long leads
C.2 A Heuristic Finding in the Random Walk
We finally give an interesting result in the random walk. Even now, the research on random walk is under development. As we showed in Section 6.1.1.1, we can find self-similarity in the random walk. We moreover show a heuristic finding of the probability of long leads in a random walk.[88] Consider a game in which a fair coin is tossed repeatedly. When the cumulative number of heads is greater than the cumulative number of tails, heads is in the lead. It retains that position until the cumulative number of tails is greater. The probability distribution indicates the probability of one side being in the lead for different percentages of the duration of the game. For example, if the coin is tossed 20 times, the probability that heads will be in the lead during the entire course of the game is 0.176, the same as the probability that it will never be in the lead.
Surprisingly, the least likely situation is for the two sides to be in the lead equal amounts of time (Fig. C.2).References
Aoki M, Yoshikawa H (2006) Reconstructing macroeconomics: a perspective from statistical physics and combinatorial stochastic processes. Cambridge University Press, Cambridge
Aoki M, Yoshikawa H (2007) Non-self-averaging in macroeconomic models: a criticism of modern micro-foundedmacroeconomics. Economics Discussion Papers. http://www. economicsejournal.org, 2007-49 November 26
Aruka Y (2001) Avatamsaka game structure and experiment on the web. In: Aruka Y (ed) Evolutionary controversies in economics. Springer, Tokyo, pp 115-132
Aruka Y (2011) Complexities of production and interacting human behaviour. Physica Verlag, Heidelberg
Aruka Y, Akiyama E (2009) Non-self-averaging of a two-person game with only positive spillover: a new formulation of Avatamsaka’s dilemma. J Econ Interact Coord 4(2):135-161. Reprinted in Aruka (2011, Chap.12)
Canfield J, Hansen MV (2001) Chicken soup for the soul: 101 stories to open the heart and Rekindle the spirit (Chicken Soup for the Soul). Health Communications, Arlington
Ewens WJ (1972) The sampling theory of selectively neutral alleles. Theor Popul Biol 3:87-112
Kono N (2008) Noncooperative game in cooperation: reformulation of correlated equilibria. Kyoto Econ Rev 77(2):107-125
Kono N (2009) Noncooperative game in cooperation: reformulation of correlated equilibria (II). Kyoto Econ Rev 78(1):1-18
Mitropoulos A (2004) Learning under minimal information: an experiment on mutual fate control. J Econ Psychol 22:523-557
Nakajima Y (2011) Price fluctuations in financial markets. Mimeo
Tanimoto J (2007) Promotion of cooperation by payoff noise in a 2 times 2 game. Phys Rev E 76:0411301-0411308
Thibaut JW, Kelley HH (1959) The social psychology of groups. Wiley, New York