METHOD AND DATA
The aim of this chapter is to examine the role of market timing and equity financing along with the other determinants of R&D expenditures using a large international sample of firms, which allows us first to examine the hypotheses in an international content with broader set of countries, and second to compare the U S firms with firms operating in either market or bank-based countries.
For the subsamples of countries, this chapter uses the classification of market and bank-based countries in studies by Demirguc-Kunt and Levine (2001) and Demirguc-Kunt and Maksimovic (2002).Method
This chapter performs Ordinary Least Square (OLS) regression analysis with the country and year fixed effects. In order to investigate the hypotheses developed in the previous section, we use the following model with several modifications:
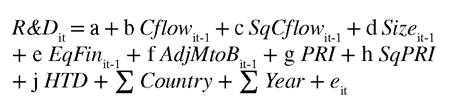
R&D is the dependent variable and R&D expenditures for firm i at time t. As consistent with Brown and Peterson (2009), we use total assets to scale R&D. This maintains a common scale factors for all other variables in my model.
The values of all other financial variables in the model refer to the end of the previous calendar year, time t-1. CFlow is cash flows scaled by total assets, which adds R&D expenses over a standard definition of cash flows as the sum of net income and depreciation. To examine whether there is a U-shaped relationship for R&D, we insert the square of the firm’s cash flow (SqCflow) into the equation. According to hypothesis 1, we expect Cflow and SqCflow to have significantly negative and positive coefficients, respectively.
Size is the natural logarithm of total assets. Young and small firms are expected to have higher R&D intensity, and therefore, we expect this variable to have negative coefficient.
EqFin measures the effect of equity financing to test hypothesis 2. We use two proxies for this variable. The first proxy is an aggregate measure of
equity financing, which is the ratio of shareholders’ equity to total assets (EqFin 1). The second proxy is an incremental measure of equity financing, which is the percentage of new equity financing and is measured by the ratio of new equity issued to the sum of new equity and new long-term debt issued (EqFin 2). The definitions of new equity and new debt are ‘Net proceeds from the Sale/Is- sue of Common and Preferred,’ and ‘Long-Term Borrowings,’ respectively. If our second hypothesis is true, we expect a significant and positive relationship between R&D and equity financing.
AdjMtoB is industry adjusted market to book ratio and is measured as the ratio of the sum of the market value of equity and book value of debt to the book value of total assets. For a better proxy of market timing, this variable is adjusted by the mean of firms’ market to book ratio in the same two digit industry for a particular country. Industry benchmark includes all firms with or without available R&D expenditures in the same two-digit industry for a particular country. According to hypothesis 3, the expected coefficient of this variable is positive, and we expect to have this positive relationship for especially firms in market-based countries (hypothesis 6).
To test hypothesis 4, we run regressions for financially constrained and unconstrained firms’ separately, and expect that the impacts of equity financing and mispricing are stronger for financial constrained firms. Fazzari et al. (1988) use dividend payout ratio for a proxy of financial constraints and find that firms with low-dividend payout ratios are more likely to face financial constraints. Since considerable amount of firms do not pay dividends for some years (zero dividend), we classify firms with no dividend payment as financially constrained and firms with dividend payment as financially unconstrained.
This proxy is likely refers to both internal and external constraints. Firms may choose not to pay dividend because of lack of available cash for a particular period. A negative profitability that may indicate the lack of internally generated funds can cause this policy. In case of firms having positive profit and future growth potential, firms may decide not to pay dividend to increase the level of internal funds.We use a dummy variable to classify firms into high and low R&D groups based on the median of the ratio of R&D expenditures to total assets and interact this variable with variables measuring equity financing and mispricing. To support our hypothesis 5, we expect to have significant and positive coefficients for those interaction variables.
PRI is patent rights index developed by Gin- arte and Park (1997). The data for this index is available for the years 1980, 1985, 1990, 1995, 2000, and 2005. One could believe that as firms and countries do more R&D that might result in more protection as firms want their new inventions protected. This argument may imply that there is a direction of causation from more patent rights protection to more R&D. For five-year periods, such as from 1986 to 1990 or from 1991 to 1995, the analysis uses the property rights index in the beginning of this period, such as the index in 1985 or 1990. This reduces possible endogeneity issues between R&D and PRI. For a possible nonlinear relationship between PRI and R&D, the analysis also uses square of PRI (SqPRI). We expect significant associations between R&D and these variables, but particularly negative coefficient for PRI and positive coefficient for SqPRI for firms in market based countries.
HTD is a dummy variable to control R&D level for high tech industries and equal to 1 if a firm is in the following SIC codes 283 (drugs), 357 (office and computing equipment), 366 (communications equipment), 367 (electronic equipment), 382 (scientific instruments), 384 (medical instruments), and 737 (software) and 0 otherwise.
Data
Since the focus of the analysis is to investigate the level of R&D, the sample contains only firms having a positive value of R&D expenditures. Financial data is collected from Worlsdscope from 1980 to 20 063. We eliminate financial firms and utilities in my chapter and, thus, avoid issues about regulatory influence on these firms. Worldscope data may contain errors, and thus all financial variables are winsorized at 0.01 and 0.99 to avoid that large outliers affect results.
We report summary statistics for the variables used in the analysis by country in Table 1, which presents the mean values of the variables for the US and the other countries on the basis of classifications as market and bank-based countries. The sample period varies for countries. The US sample contains as many observations as the total number of observations for firms in market and bank-based countries. Table 2 reports the correlations among the variables. The correlation coefficient between EqFin1 and EqFin2 is very high and significant with a p value (the numbers below the correlations are p values) lower than 1%, indicating that they measure the similar issue and therefore the analysis does not include these two variables together in a model. These two variables are also correlated negatively with size. This is consistent with the findings in the capital structure literature that small firms issue stocks (more dependent on equity financing) than large firms do. The analysis has models by having size and equity financing variables separately.
Table 1. Sample countries
| Country | N | R&D | PRI | Cflow | Size | EqFin 1 | EqFin 2 | AdjMtoB |
| US | 24383 | 0.092 | 4.780 | 0.101 | 5.098 | 0.580 | 0.618 | -0.168 |
| Australia | 982 | 0.062 | 3.949 | 0.048 | 4.892 | 0.572 | 0.471 | -0.032 |
| Brazil | 40 | 0.013 | 2.480 | 0.149 | 7.218 | 0.569 | 0.186 | 0.000 |
| Canada | 1290 | 0.095 | 4.293 | 0.065 | 4.887 | 0.620 | 0.680 | -0.082 |
| Chile | 86 | 0.003 | 3.225 | 0.116 | 5.714 | 0.601 | 0.095 | 0.017 |
| Denmark | 214 | 0.079 | 4.411 | 0.179 | 5.641 | 0.556 | 0.292 | -0.110 |
| Honk Kong | 287 | 0.021 | 3.770 | 0.074 | 4.686 | 0.607 | 0.433 | -0.150 |
| India | 976 | 0.008 | 2.056 | 0.151 | 5.127 | 0.462 | 0.190 | 0.039 |
| Malaysia | 91 | 0.005 | 3.203 | 0.108 | 4.864 | 0.574 | 0.478 | 0.035 |
| Netherlands | 332 | 0.054 | 4.508 | 0.150 | 7.181 | 0.412 | 0.330 | 0.013 |
| Philippines | 33 | 0.019 | 3.380 | 0.133 | 3.866 | 0.658 | 0.308 | 0.065 |
| Singapore | 120 | 0.021 | 4.018 | 0.121 | 5.214 | 0.592 | 0.527 | -0.064 |
| South Africa | 314 | 0.008 | 3.722 | 0.186 | 6.182 | 0.461 | 0.449 | 0.042 |
| South Korea | 2287 | 0.008 | 4.053 | 0.064 | 5.820 | 0.430 | 0.228 | -0.056 |
| Sweden | 391 | 0.074 | 4.349 | 0.157 | 6.535 | 0.472 | 0.291 | -0.102 |
| Switzerland | 538 | 0.054 | 4.186 | 0.138 | 6.374 | 0.446 | 0.365 | -0.053 |
| Turkey | 86 | 0.008 | 3.132 | 0.205 | 5.176 | 0.505 | 0.314 | 0.036 |
| UK | 4026 | 0.058 | 4.456 | 0.130 | 5.129 | 0.492 | 0.587 | -0.073 |
| Market-based | 12093 | 0.045 | 4.036 | 0.109 | 5.401 | 0.499 | 0.447 | -0.053 |
| Argentina | 13 | 0.006 | 2.779 | 0.105 | 4.776 | 0.601 | 0.000 | 1.116 |
| Austria | 82 | 0.036 | 4.268 | 0.133 | 6.452 | 0.397 | 0.068 | 0.127 |
| Belgium | 74 | 0.046 | 4.581 | 0.151 | 7.231 | bgcolor=white>0.4240.260 | -0.077 |
continued on following page
Table 1. Continued
| Country | N | R&D | PRI | Cflow | Size | EqFin 1 | EqFin 2 | AdjMtoB |
| China | 282 | 0.009 | 3.196 | 0.094 | 5.949 | 0.560 | 0.136 | -0.157 |
| Finland | 297 | 0.045 | 4.340 | 0.157 | 6.637 | 0.435 | 0.267 | 0.002 |
| France | 654 | 0.051 | 4.473 | 0.126 | 6.912 | 0.401 | 0.297 | -0.050 |
| Germany | 727 | 0.066 | 4.373 | 0.119 | 6.544 | 0.431 | 0.282 | -0.045 |
| Greece | 15 | 0.003 | 4.078 | 0.166 | 6.509 | 0.413 | 0.159 | -0.083 |
| Hungary | 11 | 0.022 | 4.125 | 0.183 | 5.513 | 0.683 | 0.333 | 0.102 |
| Ireland | 187 | 0.025 | 3.627 | 0.102 | 5.846 | 0.450 | 0.469 | -0.066 |
| Israel | 157 | 0.082 | 3.888 | 0.131 | 5.426 | 0.571 | 0.551 | 0.092 |
| Italy | 315 | 0.036 | 4.256 | 0.100 | 7.319 | 0.316 | 0.151 | -0.033 |
| Japan | 7050 | 0.023 | 4.555 | 0.087 | 6.931 | 0.452 | 0.141 | -0.028 |
| Luxembourg | 11 | 0.001 | 4.028 | 0.096 | 7.345 | 0.430 | 0.667 | -0.093 |
| New Zealand | 61 | 0.052 | 3.923 | 0.127 | 5.223 | 0.490 | 0.394 | 0.175 |
| Norway | 202 | 0.067 | 3.777 | 0.148 | 6.014 | 0.428 | 0.368 | 0.003 |
| Pakistan | 43 | 0.002 | 1.568 | 0.161 | 4.671 | 0.373 | 0.147 | 0.058 |
| Poland | 11 | 0.007 | 3.955 | 0.131 | 5.347 | 0.453 | 0.234 | -0.078 |
| Spain | 38 | 0.031 | 4.236 | 0.159 | 6.748 | 0.381 | 0.108 | -0.174 |
| Taiwan | 2118 | 0.023 | 3.273 | 0.113 | 5.778 | 0.581 | 0.165 | -0.045 |
| Bank-based | 12348 | 0.029 | 4.220 | 0.101 | 6.616 | 0.469 | 0.183 | -0.031 |
Table 2.
Correlations| R&D | PRI | Cflow | Size | EqFin 1 | EqFin 2 | AdjMtoB | ||
| R&D | 1 | |||||||
| PRI | 0.249 | 1 | ||||||
| bgcolor=white>AdjMtoB | 0.149 | -0.003 | -0.001 | -0.087 | 0.126 | 0.166 | 1 | |
| bgcolor=white>0.171 | -0.116 | |||||||
| t statistics | (45)*** | (106)*** | (-3.8)*** | ( 13)*** | (33)*** | (31)*** | (-6.1)*** | |
| US vs Bank | 0.063 | 0.560 | -0.000 | -1.518 | 0.111 | 0.435 | -0.137 | |
| t statistics | (67)*** | (141)*** | (-2.3)** | ( 50)*** | (48)*** | (71)*** | (-8.3)*** | |
| Market vs Bank | 0.016 | -0.184 | 0.008 | -1.215 | 0.030 | 0.264 | -0.022 | |
| t statistics | (18)*** | (-21)*** | (4.6)*** | ( 52)*** | (1)*** | (45)*** | (-1.4) |
The symbol *** denotes statistical significance at 1% level.
In terms of equity financing, the percentage of shareholders’ equity in total assets (EqFin 1) is 0.58 for the US firms and 0.50 and 0.47 for firms in market and bank-based countries, respectively. The differences between pairs of subsamples are significantly different, showing that firms in market-based countries also use more equity financing than firms in bank-based countries as expected. The second proxy for equity financing is the percentage of new equity issued in total new financing as the total of equity and debt issued (EqFin2). The sample presents large significant differences between firms in the US, market-based countries and firms in bank-based countries as the mean values of this variables are 0.62, 0.45, and 0.18 for all three subsamples, respectively.
This chapter uses industry-adjusted market to book ratio (AdjMtoB) to measure the ability of firms for timing the market to increase their R&D investment in the next period because of mispricing opportunities. The ratios of the US firms deviate from their industry peers more than those for firms in market and bank-based countries. While the differences in means are statistically significant between the US and market-based and between the US and bank-based, there is no statistically significant difference in mean of AdjMtoB between market and bank-based countries4.