A MORE COMPREHENSIVE CASH FLOW MEASURE
Despite its limitations as a tool for quantifying credit risk, EBITDA has become a fixture in securities analysis. Many practitioners now consider the ratio synonymous with cash flow, or more formally, operating cash flow (OCF).
The interchangeability of EBITDA and OCF in analysts’ minds is extremely significant in light of a long tradition of empirical research linking cash flow and bankruptcy risk.In an influential 1966 study,2 William H. Beaver tested various financial ratios as predictors of corporate bankruptcy. Among the ratios he tested was a definition of cash flow still widely used today:
Cash Flow (as defined by Beaver, 1966)
Net Income + Depreciation, Depletion, and Amortization
(Depletion, a noncash expense applied to natural resource assets, is ordinarily taken to be implicit in depreciation and amortization, hence the use of the acronym EBITDA, rather than EBITDDA.)
Beaver found that of all the ratios he tested, the best single predictor of bankruptcy was a declining trend in the ratio of cash flow to total debt. This relationship made intuitive sense. Practitioners reasoned that bankruptcy risk was likely to increase if net income declined or total debt increased, either of which event would reduce the cash-flow-to-total-debt ratio. The empirical evidence indicated that by adding depreciation to the numerator, analysts improved their ability to predict which companies would go bust, relative to comparing total debt with net income alone.
Note that Beaver’s definition of cash flow was more stringent than EBITDA, since he did not add back either taxes or interest to net income.
Even so, bond analysts have developed a tradition of telescoping default risk into the single ratio of cash flow (meaning EBITDA) as a percentage of total debt, all based ultimately on Beaver’s 1966 finding.3 In so doing, practitioners have institutionalized a method that Beaver never advocated and that subsequent experience has shown to be fatally flawed.Beaver did not conclude that analysts should rely solely on the cash-flow- to-debt ratio, but merely that it was the single best bankruptcy predictor. As he noted in his study, other academic researchers were already attempting to build bankruptcy models with greater predictive power by combining ratios into a multivariate analysis. As of 1966, no one had yet succeeded, but just two years later, Edward I. Altman introduced a multivariate model composed of five ratios4 (see Chapter 13). The development of Altman’s Z-Score and other multivariate models has demonstrated that no single financial ratio predicts bankruptcy as accurately as a properly selected combination of ratios.
Since 1968, there has been no excuse for reducing bankruptcy risk to the sole measure of EBITDA-to-total-debt. Nevertheless, that procedure remains a common practice. Similarly unjustifiable, on the basis of empirical evidence, is the widely used one-variable approach of ranking a sample of corporate borrowers according to their EBITDA coverage of interest.
Bizarrely, investment managers sometimes ask bond analysts to provide rankings of companies by their “actual credit risk,” as opposed to Moody’s and Standard & Poor’s ratings. Asked to elaborate on this request, the investment managers reply that “actual” risk obviously means EBITDA coverage. Apparently, they consider it self-evident that the single ratio of cash flow (as they define it) to fixed charges predicts bankruptcy better than all of the rating agencies’ quantitative and qualitative considerations combined. Little do the investment managers realize that they are setting credit analysis back by more than 30 years!
Nearly as outmoded as exclusive reliance on a single EBITDA-based ratio is analysts’ belief that they can derive a satisfactory measure of cash flow by simply selecting some version of earnings and adding back depreciation.
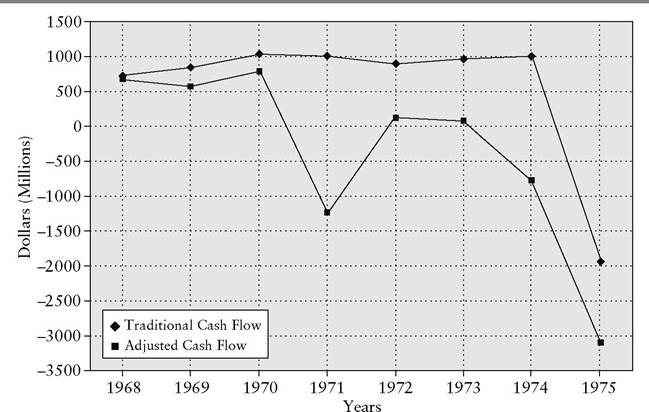
It became apparent that neither EBITDA nor net-income-plus-depreciation was a valid proxy for cash flow at least as far back as 1975, when W. T. Grant filed for bankruptcy. The department store chain’s collapse showed that reliance on an earnings-plus-depreciation measure could cause analysts to overlook weakness at a company with substantial working capital needs. Many subsequent failures in the retailing and apparel industries have corroborated that finding.At the time of its bankruptcy filing, W. T. Grant was the largest retailer in the United States. Up until two years before it went belly-up, the company reported positive net income (see Exhibit 8.5). Moreover, the department store chain enjoyed positive and stable cash flow (as defined by Beaver, i.e., net income plus depreciation). Bankruptcy therefore seemed a remote prospect, even though the company’s net income failed to grow between the late 1960s and early 1970s. In 1973, W. T. Grant’s stock traded at 20 times earnings, indicating strong investor confidence in the company’s future. The board of directors reinforced that confidence by continuing to authorize dividends up until mid-1974.
Investors would have been less sanguine if they had looked beyond the cash sources (earnings and depreciation) and uses (interest and dividends) shown on the income statement. It was imperative to investigate whether
EXHIBIT 8.5 W. T. Grant Alternative Cash Flow Measures 1967-1975
Sources: Clyde P. Stickney and Paul R. Brown, Financial Re-porting and Statement Analysis: A Strategic Perspective, Fourth Edition, Orlando, Florida: The Dryden Press, a subsidiary of Harcourt Brace & Company, pp. 106-123. James Largay, “Cash Flows, Ratio Analysis and the W.
T. Grant Company Bankruptcy,” Financial Analysts Journal, July-August 1980, pp. 51-55.two balance sheet items, inventories and accounts receivable, were tying up increasing amounts of cash. If so, it became vital to determine whether the company could generate an offsetting amount of cash by expanding its accounts payable. Recognizing the need for this added level of analysis, FASB eventually prescribed a more comprehensive definition of operating cash flow, as defined in SFAS 95, “Statement of Cash Flows”:
Operating Cash Flow (as defined by FASB, 1987)
Net Income + Depreciation - Changes in Working Capital Requirements
Where:
![]()
Note that this definition focuses on the elements of working capital that ordinarily grow roughly in proportion with the scale of operations. FASB’s formulation excludes cash and marketable securities, as well as short-term debt.