THE CASH FLOW STATEMENT AND THE LBO
Net income becomes even less relevant when one analyzes the statements of a company that has been acquired in a leveraged buyout, or LBO (Exhibit 4.2).
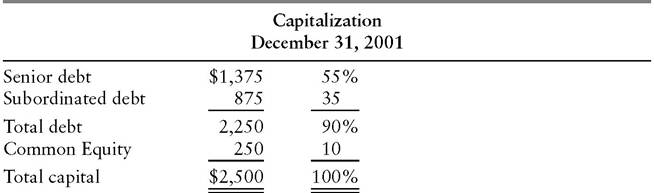
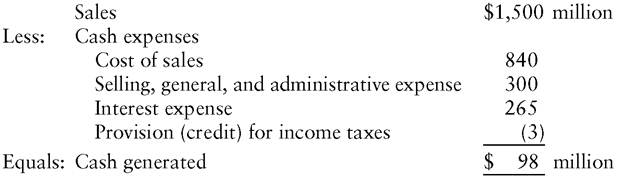
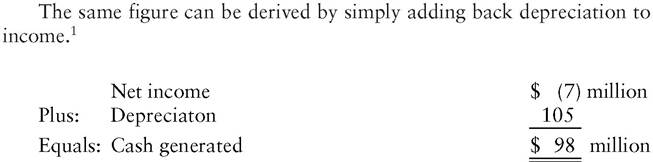
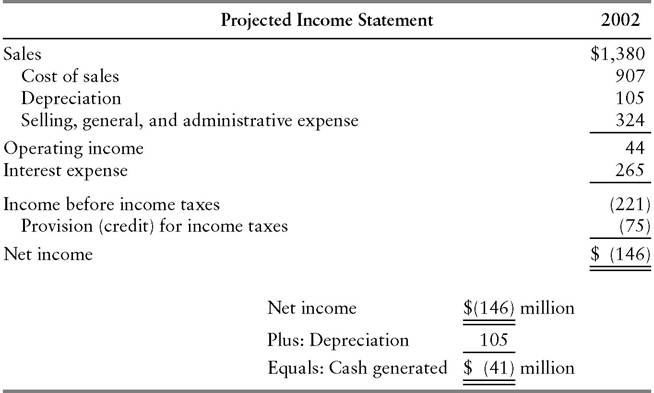
In a classic LBO, a group of investors acquires a business by putting up a small amount of equity and borrowing the balance (90% in this example) of the purchase price. As a result of this highly leveraged capital structure, interest expense is so large that the formerly quite profitable company reports a loss in its first year as an LBO (2002). Hardly an attractive investment, on the face of it, and one might also question the wisdom of lenders who provide funds to an enterprise that is assured of losing money.A closer study, however, shows that the equity investors are no fools. In 2002, the company’s sales are expected to bring in $1,500 million in cash. Cash outlays include cost of sales ($840 million), selling, general, and administrative expense ($300 million), and interest expense ($265 million), for a total of $1,405 million. Adding in depreciation of $105 million produces total expenses of $1,510 million, which when subtracted from sales results in a $10-million pretax loss. The amount attributable to depreciation, however, does not represent an outlay of cash in the current year. Rather, it is a bookkeeping entry intended to represent the gradual reduction in value, through use, of physical assets. Therefore, the funds generated by the leveraged buyout firm equal sales less the cash expenses only. (Note that the credit for income taxes is a reduction of cash outlays.)
EXHIBIT 4.2 Leveraged Buyout Forecast—Base Case ($000 omitted)
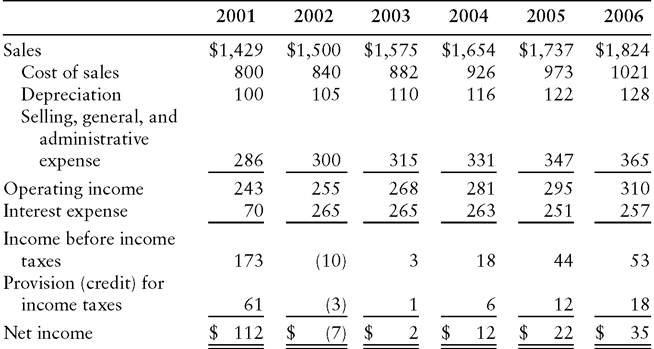
Projected Income Statement
Projected Cash Flow
id="Picutre 20" class="lazyload" data-src="/files/uch_group74/uch_pgroup295/uch_uch7164/image/image020.jpg">
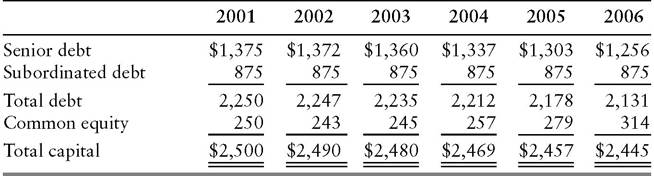
Projected Capitalization
Viewed in terms of cash inflows and outflows, rather than earnings, the leveraged buyout begins to look like a sound venture.
Projected net income remains negative, but as shown under “Projected Cash Flow,” cash generation should slightly exceed cash use in 2002. (Note that the equity investors take no dividends but instead dedicate any surplus cash generated to reduction of debt.)The story improves even more during subsequent years. As sales grow at a 5% annual rate, the Projected Income Statement shows a steady increase in operating income. In addition, a gradual paydown of debt causes interest expense to decline a bit, so net income increases over time. With depreciation rising as well, funds from operations in this example keep modestly ahead of the growing capital expenditure requirements.
If the projections prove accurate, the equity investors will, by the end of 2006, own a company with $1.8 billion in sales and $310 million of operating income, up from $1.4 billion and $243 million, respectively, in 2001. They will have captured that growth without having injected any additional cash beyond their original $250 million investment.
Suppose the investors then decide to monetize the increase in firm value represented by the growth in earnings. Assuming they can sell the company for the same multiple of EBITDA (earnings before interest, taxes, depreciation, and amortization)2 that they paid for it, they will realize net proceeds of $685 million, derived as follows ($000 omitted):
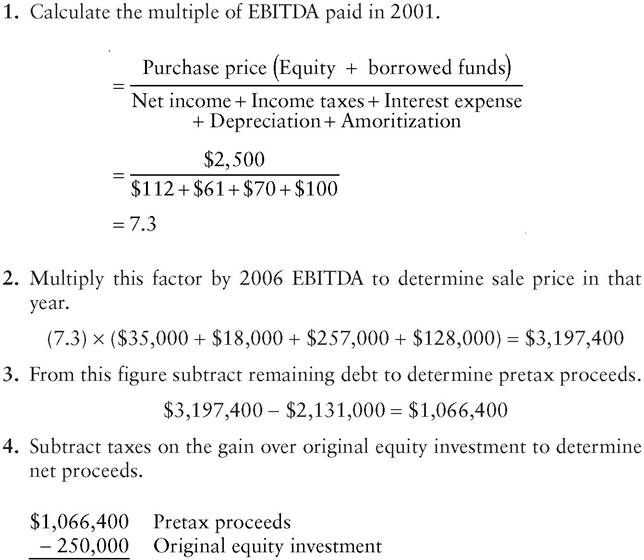
The increase in the equity holders’ investment from $250 million to $789 million over five years represents a compounded annual return of 25.8% after tax. Interestingly, the annual return on equity (based on reported net income and the book value of equity) averages only 4% during the period of the projection.
Analysts evaluating the investment merits of the LBO proposal would miss the point if they focused on earnings rather than cash flow.The same emphasis on cash flow, rather than reported earnings, is equally important in analyzing the downside in a leveraged buyout.
As one might expect, the equity investors do not reap such spectacular gains without incurring significant risk. There is a danger that everything will not go according to plan and that they will lose their entire investment. Specifically, there is a risk that sales and operating earnings will fall short of expectations, perhaps as a result of a recession or because the investors’ expectations were unrealistically high at the outset. With a less debt-heavy capital structure, a shortfall in operating earnings might not be worrisome. In a leveraged buyout, however, the high interest expense can quickly turn disappointing operating income into a sizable net loss (Exhibit 4.3). The loss may be so large that even after depreciation is added back, the company’s funds generated from operations may decline to zero or to a negative figure. (Note that the shortfall shown here resulted from deviations of just 8% each in the projections for sales, cost of sales, and selling, general and administrative expense, shown in Exhibit 4.2.)
Now the future does not look so rosy for the equity investors. If they cannot reduce operating expenses sufficiently to halt the cash drain, they will lack the cash required for the heavy interest expenses they have incurred, much less the scheduled principal payments. Most of the choices available if they cannot cut costs sufficiently are unappealing. One option is for the investors to inject more equity into the company. This will cause any
EXHIBIT 4.3 Leveraged Buyout Forecast—Pessimistic Case ($000 omitted)
profits they ultimately realize to represent a smaller percentage return on the equity invested, besides possibly straining the investors’ finances.
Alternatively, the existing equity holders can sell equity to a new group of investors. The disadvantage of this strategy is that anyone putting in new capital at a time when the venture is perceived to be in trouble is likely to exact terms that will severely dilute the original investors’ interest and, possibly, control. Comparably harsh terms may be expected from lenders who are willing (if any are) to let the company try to borrow its way out of its problems. A distressed exchange offer, in which bondholders accept reduced interest or a postponement of principal repayment, may be more attractive for the equity holders but is likely to meet stiff resistance.If all these options prove unpalatable or unfeasible, the leveraged company will default on its debt. At that point, the lenders may force the firm into bankruptcy, which could result in a total loss for the equity investors. Alternatively, the lenders may agree to reduce the interest rates on their loans and postpone mandatory principal repayments, but they will ordinarily agree to such concessions only in exchange for a larger influence on the company’s management. In short, once cash flow turns negative, the potential outcomes generally look bleak to the equity investors.
The key point here is that the cash flow statement, rather than the income statement, provides the best information about a highly leveraged firm’s financial health. Given the overriding importance of generating (and retaining) cash to retire debt, and because the equity investors have no desire for dividends, there is no advantage in showing an accounting profit, the main consequence of which is incurrence of taxes, resulting in turn in reduced cash flow. Neither are there public shareholders clamoring for increases in earnings per share. The cash flow statement is the most useful tool for analyzing highly leveraged companies because it reflects the true motivation of the firm’s owners—to generate cash, rather than to maximize reported income.