Too Many Doctors? Too Many Telephones? Too Much R&D?
To illustrate the likelihood of a spurious coefficient on the quadratic term, consider three indicators that one would expect to accompany, but probably not cause, growth. Using the same countries, periods, and growth data as Cecchetti and Kharroubi (2012), regression equation (6.1) finds that growth per capita is negatively related to the logarithm of purchasing power parity (ppp) per capita income, the standard “convergence” finding.
It is also positively related to a linear term on physicians per 1,000 population but negatively related to the square of this “doctors” variable. Thus: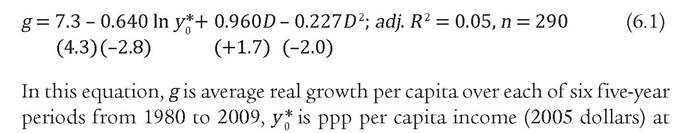
the beginning of each period, and D is the average number of physicians per 1,000 population in each period (see appendix 6B for data description and sources). The convergence term on the first variable is negative and significant as expected. Tstatistics are shown in parentheses. The linear term on physician density is positive and significant at the 10 percent level; the quadratic term is negative and significant at the 5 percent level.
The turning point at which additional doctors per capita begin to have a negative influence on growth is at 2.12 physicians per 1,000 population. This density of doctors tends to be reached at per capita income of about $12,000.[210] In the final period observed (2005-09), Italy, Norway, and Switzerland had the highest density of doctors, at 3.9 physicians per 1,000 population. If one takes equation (6.1) literally, the consequence is that per capita growth in these economies is -0.81 percentage point lower than it
would have been if instead they had adhered to the optimal density of 2.1 per 1,000 population.5
The corresponding exercise for telephones is shown in equation (6.2). This time, besides the logarithm of per capita income, the equation includes a quadratic form of fixed-line telephone subscriptions per 100 population (variable T). The coefficients are all highly significant, and as expected the quadratic term on telephones is negative.
Too many fixed-line telephones reduce growth.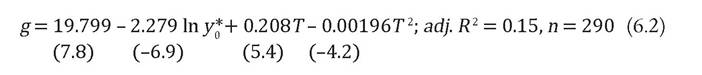
This time the turning point beyond which additional telephone lines begin to reduce the growth rate is at 53 telephone lines per 100 population.6 On average that telephone density is associated with a per capita income of $41,500.7 Switzerland is slightly below this income level but substantially above optimal telephone lines (at 66), whereas the United States is at a slightly higher per capita income and lower but still above optimal fixed telephone line density (55). By implication, the risk to growth from too many phone lines is still more remote for most countries than the risk from too many doctors.
Finally, the same test using R&D technicians (100s per million population) yields the results shown in equation (6.3).
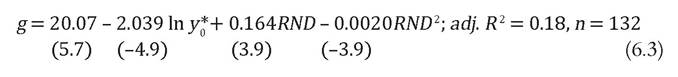
Once again the coefficients are all significant and have the expected signs. The influence of additional R&D technicians on growth turns negative at 4.1 per 1,000 population.8 This level tends to be associated with ppp per capita income of $43,000.9 Finland and Japan substantially exceed the optimal level of R&D technicians (at 7.5 and 5.5 per 1,000 population, respectively), while the United States is slightly below it (at 3.8). 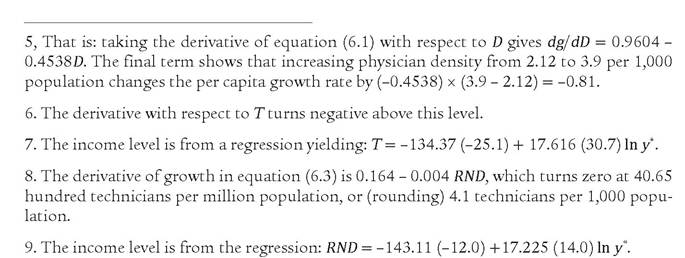
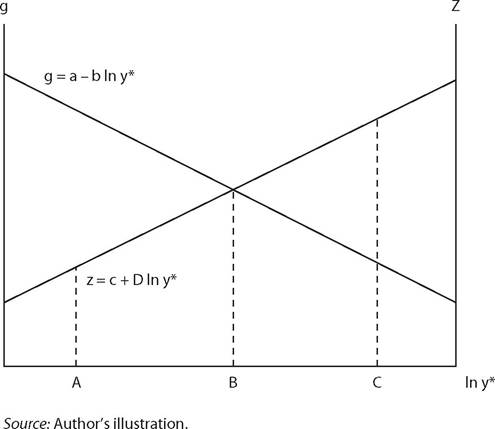
Figure 6.1 Relationship between growth (left axis) and financial depth or other variable positively related to per capita income (right axis)