Changes in employment
Employment has obviously been influenced by the changes in output already described. It has also been influenced by changes in technology, which have affected the labour required per unit of output.
Table 1.4 gives numbers employed in each sector, together with percentage shares of total employment. The table shows that in the goods sector (primary and secondary) there were fewer jobs in 1979 than in 1964, with a still more rapid decline in jobs between 1979 and 2010. In fact, by 2010 total employment in the goods sector as a whole had fallen from over 9.6 million in 1979 to just over 5.4 million in 2010.In the primary sector, employment was reduced by 60% between 1964 and 1990. The contraction in coal output inevitably sent employment in mining and quarrying into severe decline. After 1990 this accelerated as the coal industry lost some of its electricity generation market to gas and was itself made ready for privatization. By 2001 coal industry employment stood at only 14,000, having been over 300,000 in the early 1970s. Such was the growth of output per worker in agriculture, forestry and fishing that employment was reduced by 2010 to 83% of its 1964 level, despite an increase in output of 73%. The rise of the North Sea sector had directly created only 24,000 jobs in oil and natural gas by 1981. Renewed interest in gas helped raise this to 36,000 by 1990 but although output soared after 1990, employment again fell. The outcome was that between 1964 and 2010 the primary sector’s share of total employment fell from 5.1% to 1.8%.
In the secondary sector, employment fell by 2.07 million between 1964 and 1979, and again by 4.0 million between 1979 and 2010. Manufacturing, as the largest part of this sector, suffered most of these job losses, with manufacturing employment falling by over 6.4 million in the period 1964-2010. The share of manufacturing in total employment fell from 38.1% in 1964 to as little as 8.2% in 2010.
As employment fell in the goods sector between 1964 and 1979, employment in the tertiary sector expanded by 2,378,000, enabling total employment to be held at around 23 million. This expansion was concentrated in the financial sector, and in various professional and scientific services.
The rough balance between employment losses in the goods sector and gains in the service sector broke down after 1979. Between 1979 and 1981 service
Table 1.4 Employees in employment, UK.
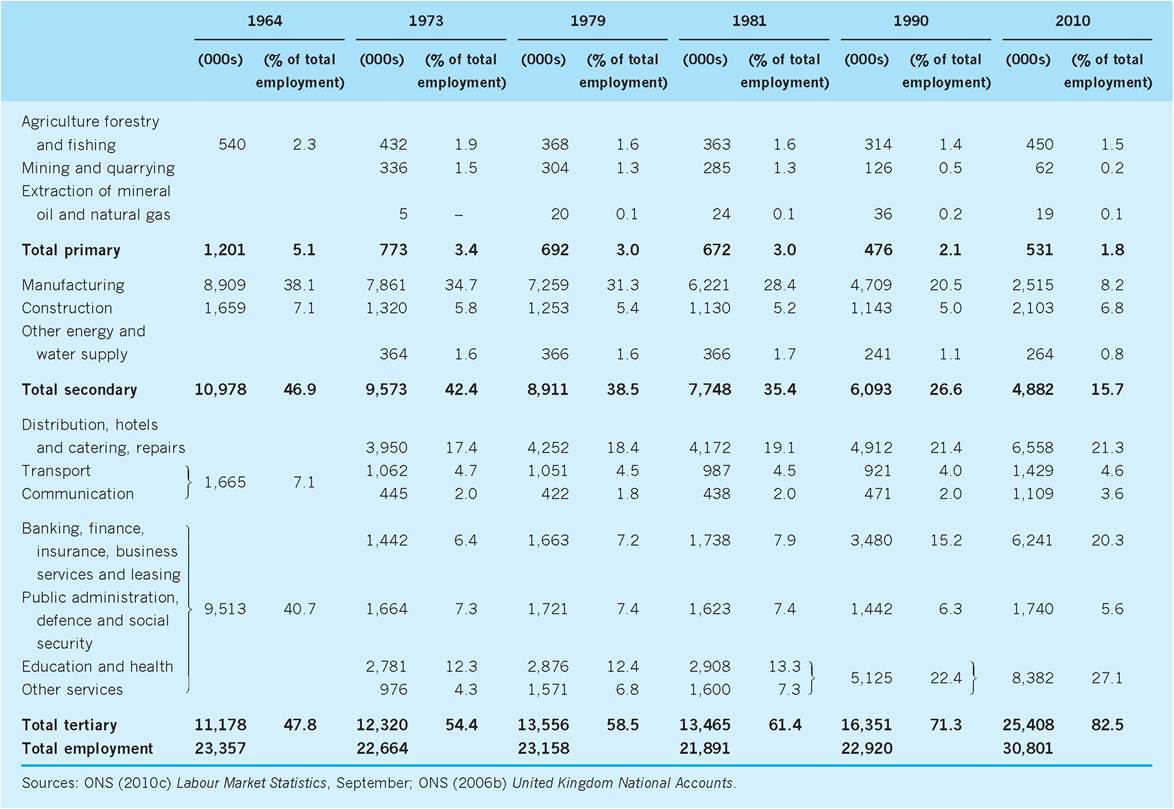
Table 1.5 Industrial market economies, distribution of the labour force: percentages.
| 1960 | 1980 | 2008 | |
| Agriculture | 17.3 | 6.5 | 2.4 |
| Industry | 36.7 | 34.5 | 23.7 |
| (manufacturing) | (27.2) | (25.0) | (16.9) |
| Services | 46.0 | 59.0 | 73.9 |
Sources: OECD (2010d) OECD in Figures, and previous issues; OECD (2010) Country Surveys (various).
sector employment actually fell slightly. Not until 1984 did the growth of service sector employment again compensate for the loss of goods sector employment. However, over the whole period 1979-2010 service sector employment grew by 11.9 million whilst employment in the goods sector fell by 4.2 million. As a result total employment rose by 7.7 million.
Similar changes in the pattern of employment have, however, taken place throughout the industrial world (see Table 1.5). By comparison with other advanced economies the UK now has relatively small agricultural and industrial sectors, leaving services with a larger than average share of total employment.