Relationships among Indicators
Before implementing any measure empirically, it is helpful to understand the variables that may be entered into the measure by looking at univariate and bivariate statistics such as measures of central tendency, dispersion, and association.
In the presence of multiple dimensions it is helpful to view their joint distribution, in order to scrutinize the associations across dimensions, and explore similarities or redundancies that may exist.[214] Such analysis may lead one to drop or reweight an indicator, to combine some set of indicators into a subindex, or to adjust the categorization of indicators into dimensions. It can also inform the selection of indicators and their robustness checks, the setting of deprivation values, and the interpretation of results.Statistical approaches are relevant for multidimensional poverty measures, but as Chapter 6 argued, value judgements also constitute a fundamental prior element. Thus, information on relationships between indicators is used to improve rather than determine measurement design. For example, if indicators are very highly associated in a particular dataset, that is not sufficient grounds to mechanically drop either indicator; both may be retained for other reasons—for example, if the sequence of their reduction over time differs or if both are important in policy terms. So the normative decision may be to retain both indicators, with or without adjustments to their weights, but the analysis of redundancy will have clarified their justification and treatment.
The techniques commonly used to assess relationships between indicators include many of those already presented in section 3.4—that is, principle component analysis (PCA), multiple correspondence analysis (MCA), factor analysis (FA), cluster analysis, and confirmatory structural equation models, as well as cross-tabulations and correlations.
This section is confined to explaining the limitations of correlation analysis between deprivations and introducing a distinctive indicator of redundancy. Both of these draw on contingency tables presented in section 2.2.3. It is further limited in that we restrict information to the dichotomized deprivation matrix, using only uncensored or censored headcount ratios for each indicator.7.3.1 CROSS-TABULATIONS
As was mentioned earlier, cross-tabulations or contingency tables are a basic way to view the joint distribution between two dichotomous variables—which could be the uncensored or censored headcounts. We return to these to consider matters of correlation and redundancy. A two-way contingency table (Table 7.1) provides information on two kinds of matches: 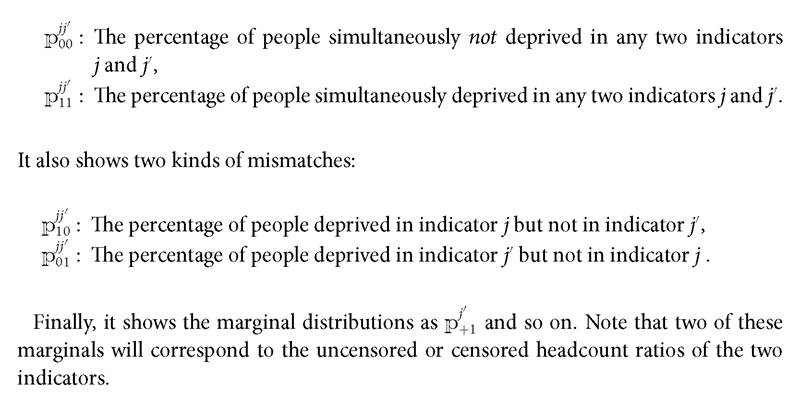
Table 7.1 A contingency table for deprivations in two indicators
Dimension j'
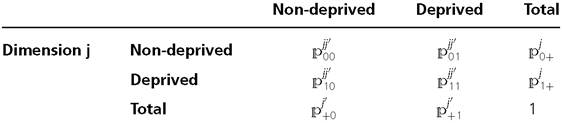
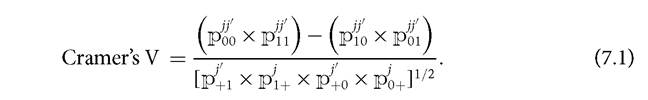
We show this familiar building block to remind readers that correlations between dichotomous variables—which generate the same coefficient as the Cramer's V—draw on all elements of the cross-tab: the matches, the mismatches, and the marginal entries. In words, the correlation is the product of the matches minus the product of the mismatches, divided by the square root of the product of the marginals.
What is important to notice is that while the correlation is affected by the extent to which deprivations between variables match (which is key for redundancy), it is also affected by values of the headcount ratios and their difference. This, as we will show, somewhat dilutes the insights that correlations offer for redundancy—so that the correlation coefficients are best interpreted alongside the contingency table for each indicator pair.
Similarly, PCA, MCA, and FA also use all elements of the cross-tab.Instead of using the correlation (Cramer's V) alone, we propose another measure of association, which has some attractive characteristics for a direct assessment of redundancy.12 This measure shows the matches between deprivations as a proportion of the minimum of the marginal deprivation rates. If two deprviation measures are not independent, and if at least one of the headcount ratiosis different from zero, then the measure of redundancy or overlap Ro is defined as
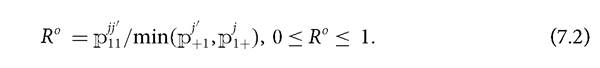
That is, the measure of redundancy displays the number of observations which have the same deprivation status in both variables, which reflects the joint distribution, as a proportion of the minimum of the two uncensored or censored headcount ratios. By using the minimum of the uncensored or censored headcounts in the denominator we ensure that the maximum value of Ro is 100%.
12 For a constructive review of measures of both association and similarity see Alkire and Ballon (2012). This particular measure was first proposed by Simpson (1943).
If Ro takes the value of 80%, this shows that 80% of the people who are deprived in the indicator having the lower marginal headcount ratio are also deprived in the other indicator. Thus a high level of Ro is a more direct signal that a further assessment of redundancy is required than a correlation measure might be.
An example will clarify and close this section.
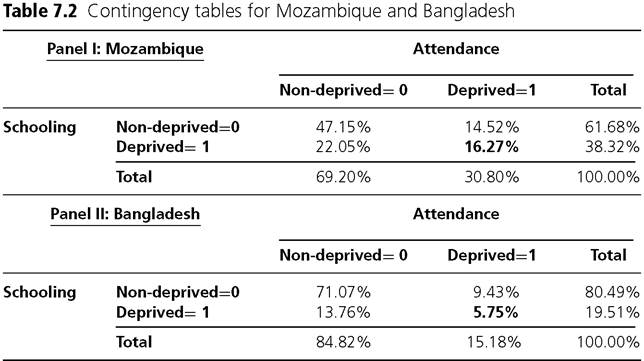
Consider the Contingency Tables in Panel I and II of Table 7.2, which draw on 2011 DHS surveys for each country. In Mozambique, 38% of the population are deprived in years of schooling and 31% in school attendance. Only 16% are deprived in both indicators.
For Bangladesh, 20% and 15% are deprived in years of schooling and school attendance respectively, and 6% are deprived in both. How do we assess the association between these indicators? Consider first the correlation or Cramer's V coefficients, computed using equation (7.1). Using the values in Table 7.2 it can be easily verified that the Cramer's V between attendance and schooling is 0.199 for Mozambique and 0.196 for Bangladesh. They are quite similar. But when we compute the Ro measure using equation (7.2), we find that 52.8% of possible matched deprivations overlap for Mozambique, but only 37.9% match for Bangladesh. Ro focuses on the precise relationship of interest.Table 7.3 gives the Cramer's Vs (correlation coefficients) and the measures of over- lap/redundancy for three pairs of indicators for Mozambique. The highest redundancy values correspond to those between cooking fuel and other indicators. These are exceedingly high and might suggest that cooking fuel is redundant in these datasets, unless it is retained for other normative reasons (sequencing, policy). Yetthe Cramer's Vs between cooking fuel and other dimensions are not particularly high and would not show this—indeed the correlation between water and schooling is much higher. As explained above, the divergence between these two values reflects the different components of the cross-tab that they draw upon. Although correlations are often used, we consider the
Table 7.3 Correlation matrix and overlap measure for Mozambique
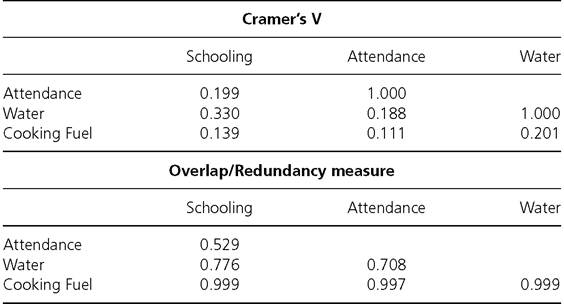
measure of overlap to provide clear and precise information that should be considered alongside other kinds of information in evaluating indicator redundancy.
Chapter 8 addresses robustness analysis and statistical inference, which are required to draw conclusions or guide policies based on estimated poverty measures.
8