Relative unit labour costs (RULC)
It would still be possible to remain price-competitive with overseas producers even with low labour productivity, if real wages were also low. Labour costs per unit of output (unit labour costs) are determined by the wages of the workers as well as the output per worker.
International competitiveness, in terms of unit labour costs, is also influenced by exchange rates. Depreciation of the currency can even compensate for poor productivity and high money wages, though it also has the effect of raising import prices.Figure 1.2 reveals the sources of the changes in UK cost competitiveness in manufacturing since 1976, relative to its major competitors. The UK’s relative productivity is shown by Schedule ‘C’, which indicates the changes in UK manufacturing productivity relative to its major competitors since 1976. We see that in 2009 UK manufacturing productivity had risen by around 40% on its 1976 level relative to those competitors. The relative cost of UK labour had, however, risen by as much as 110% over this period (Schedule ‘B’). The impact of these changes on UK competitiveness was, however, moderated by a slight fall in the effective exchange rate to around 94% of its 1976 level (Schedule ‘D’). As a result, relative unit labour costs (RULC) were around 41% above their 1976 level (Schedule ‘A’). Whilst significant, a 41% increase in RULC is certainly much less than the 110% increase in relative labour costs over this period.
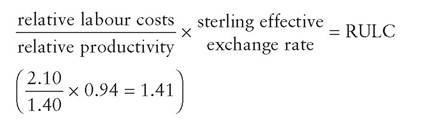
The calculation of RULC is as follows:
We should not of course conclude from this that the 1976 position was ‘just right’. Nevertheless we have already shown that manufacturing output and
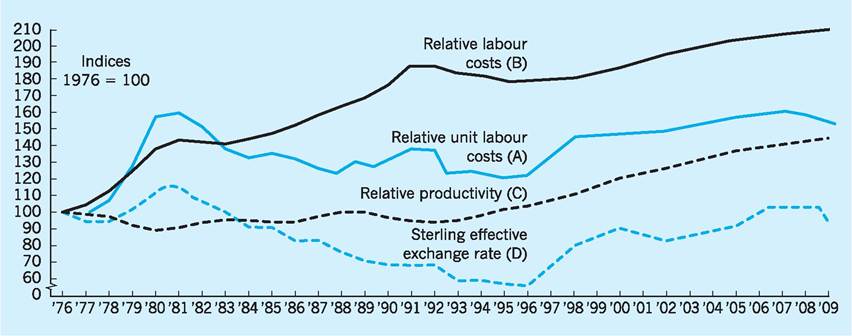
Fig. 1.2 Cost contributions: sources of changes in UK cost competitiveness in manufacturing.
Sources: ONS Economic Trends (various); European Commission European Economy (various); National Economic Development Office (1987).
employment had fallen dramatically between 1976 and 2009. A restoration of UK competitiveness, even to 1976 levels, would in all probability generate more output and more employment than are currently experienced.
The above formula emphasizes that lower relative unit labour costs could be achieved either by reducing relative labour costs, or by raising relative productivity, or by lowering the effective exchange rate, or indeed by a combination of all three. If the exchange rate alone were to be used, a depreciation of 29% would have been required in 2009 in order to restore RULC in the UK to its 1976 level.
Figure 1.2 draws attention to the fact that the sterling effective exchange rate appreciated between
1978 and 1981 (see also Chapter 25). This happened at the very time that relative labour costs were rising rapidly and relative productivity was falling. It is hardly surprising, therefore, that the UK’s competitive position deteriorated by about 50% during this period, as indicated by the sharp rise in RULC. This was a major factor in the marked decline in manufacturing output and employment in the UK between
1979 and 1981.
After 1980/81 the competitive position improved (RULC is on a downward trend) as the decline of the sterling effective exchange rate more than compensated for the resumed rise in relative labour costs. Notice that improvements in relative productivity contributed little to the falling RULC after 1983. By 1990 there was again concern about the competitive position of the UK as the pound rose to around 3.0 Deutsches marks (DM). This concern was reinforced by UK entry into the Exchange Rate Mechanism (ERM) at the (high) central parity of £1 = 2.95 DM in October 1990. However, the enforced withdrawal of the UK from the ERM on 16 September 1992 (see Chapter 27) led to the pound depreciating by more than 14% in the following months.
This went some way to meeting the 27% depreciation estimated as being required in 1991 to restore RULC to its 1976 level in Fig. 1.2. This depreciation in sterling certainly brought about a sharp fall in RULC from September 1992 onwards which contributed to the recovery of output and improved the balance of trade. However, a concern in more recent times has been the strong appreciation of the sterling effective exchange rate which rose by 28% between 1996 and 2007. This appreciation of sterling has been a powerful factor in raising the RULC over that time period, a trend further reinforced by the tendency for relative labour costs to rise faster than relative productivity in the UK during recent years. However, sterling has depreciated sharply against the US dollar and many other major currencies in the period 2007-10, helping reduce UK RULCs.An indicator of trends in relative unit labour costs can be seen in Table 1.13 which traces the nominal
Table 1.13 Relative unit labour costs (RULCs) 1995-2009 (2005 = 100).
| US | France | Germany | UK | |
| 1995 | 116.8 | 112.4 | 104.5 | 69.8 |
| 1997 | 114.3 | 107.1 | 103.6 | 83.6 |
| 2000 | 125.5 | 96.0 | 100.1 | 99.3 |
| 2005 | 100.0 | 100.0 | 100.0 | 100.0 |
| 2009 | 92.3 | 101.2 | 96.2 | 86.0 |
Note: The figures relate unit labour costs relative to 35 industrial countries.
OECD (2010a) Economic Outlook, No 87 Annex tables.
RULCs in four major economies. From the table we can observe that the UK’s relative unit labour costs grew rapidly in the 1990s, before slowing down between 2000 and 2005, and actually falling since 2005. However, the UK’s RULCs since 1990 have been lower than in the three competitors shown here, placing the UK at a competitive advantage.
It is important that the productivity gaps already identified be narrowed or removed. It is certainly doubtful as to whether the apparent alternative option of a low-wage, low-productivity industrial economy is viable, given the role of technology. Technical change is frequently embodied in the latest capital equipment, and has the effect of changing not just the volume of output per worker, but also the quality of products. For instance, robot welders and paintsprayers on car production lines offer a dependable quality which previously more labour-intensive methods did not. If, as a consequence of lower real wages, older and more labour-intensive methods are retained in the face of competition from new technology, markets will often still be lost on the basis of quality, even if prices can be held at apparently low levels. In these circumstances, the UK would be producing goods under similar conditions to many newly industrializing Third World countries.
Low productivity, not fully compensated by low wages or by a lower exchange rate, leaves UK companies in a weak market position. They are faced with the choice of raising prices and risking lost orders, or continuing to sell on lower profit margins. Markets differ in their sensitivity to rising prices, but in all markets rising prices tend to reduce sales volume, which usually means less employment. Multinational companies located in the UK may, to avoid raising prices, supply an increasing proportion of their market from overseas plants, again reducing UK output and employment (see Chapter 7).
Firms which absorb rising unit costs by taking lower profit margins may be able to maintain their levels of output and employment, at least in the short run.
But in the long run profits are vital to industrial investment, both in providing investment finance and in influencing expectations of future rates of return, and hence investment plans. Investment is also required in many industries to raise productivity, and thereby profits, and so we come full circle. Profits depend on productivity, which is affected by investment, which depends on profits! The process is self-reinforcing; low productivity gives low profits, low investment and therefore little productivity improvement. In contrast, once productivity is raised, profits and investment increase, which further raises productivity. This cumulative upward spiral is still further reinforced in that market share and factor incomes rise, so that demand is created for still higher output. New technology is also more easily accepted in situations of rising output, perhaps leading to still higher profits, stimulating further investment, and so driving the process on. The UK’s problem is to further improve on its productivity performance, given the substantial gaps which still persist relative to its main competitors across a number of industrial and service sectors.The consequences of low productivity and poor competitiveness have been felt mainly in the manufacturing sector of the economy, largely because its exposure to international competition is greater than that of the service sector. Structural change, in the form of a reduced share of output and employment for the manufacturing sector, is then almost inevitable.