SETTING THE SCENE
When the first volume of the Handbook of Income Distribution was published in 2000, the subject of income inequality was not in the mainstream of economic debate—despite the long history of engagement with this issue by earlier leading economists—see Chapter 1 by Agnar Sandmo.
Fifteen years later, inequality has become very much centre stage. Rising income inequality has attracted the attention of the U.S. President, of international bodies such as the IMF and the OECD, and of participants in the Davos meeting.This volume of the Handbook aims to cover the advances made in the past 15 years in our understanding of the extent, causes, and consequences of inequality. In this respect, the second volume should be seen as complementing, not supplanting, the first volume. We have encouraged authors to concentrate on the developments that have taken place since 2000, and the chapters should be read in conjunction with those in volume I. In this Introduction, we give a flavor of the issues discussed and some personal reflections on the state of the subject.
In our Introduction to volume I of the Handbook, we said that “income distribution may be considered the normative economic issue ‘par excellence’” (Atkinson and Bourguignon, 2000, p. 41). People are concerned about economic inequality because they feel it to be socially unjust or unfair. It violates principles of social justice. The nature of these principles is of course much debated and there is disagreement about what constitutes an unacceptable level of inequality. People focus on different dimensions. But the concern is with inequality intrinsically. At the same time, there is a second set of— instrumental—concerns with the consequences of inequality. The societal consequences were highlighted byJoseph Stiglitz when he entitled his 2012 book, Theprice of inequality, where he says “the impact of inequality on societies is now increasingly well understood—higher crime, health problems, and mental illness, lower educational achievements, social cohesion and life expectancy” (inside cover).
The social, political and cultural impacts of inequality have been the subject of the GINI (Growing Inequalities’ Impacts) research project (Salverda et al., 2014; Nolan et al., 2014). In the second volume of the Handbook, some of these consequences feature, notably those regarding health in Chapter 17 by Owen O’Donnell, Eddy Van Doorslaer, and Tom Van Ourti. But the wider societal impact of inequality is not the principal focus of the chapters that follow. This still leaves much to be discussed. Inequality is of instrumental importance within the field of economics itself. As we said in volume I, “income distribution assists our understanding of various fields of economics” (2000, p. 4). Now, as then, we believe that the study of economic inequality should be at the heart of economic analysis.Upon reflecting the issues covered in this volume, this Introduction considers successively: (a) the concepts and approaches to economic inequality measurement, or the various facets of inequality (Section 2); (b) the care needed with data on inequality (Section 3); (c) the explanations of changes in various dimensions of economic inequality, most notably the distribution of income, earnings and wealth and the links with macroeconomics (Section 4); and (d) the policies available to influence those changes or to correct those distributions (Section 5).
We plunge straight into the subject matter with Figure 1, which depicts the evolution of economic inequality in the United States over the past century. The data are taken from the Chartbook of Economic Inequality (Atkinson and Morelli, 2014), but are presented in four panels to highlight different dimensions of the distribution of income.[1] [2] The pictures provide a good basis for describing what is covered in this Handbook and for identifying some of the issues that are missing. The fact that most of the lines in the different panels are rising to the right is the main reason why inequality is on the agenda.
At the same time, the long run of historical data on inequality shows us that there have been periods in the past when inequality fell and when poverty was reduced. Indeed the past 100 years has seen a broadly U-shaped pattern. The series shown in Figure 1 also allow us to underline at the outset the crucial, and often overlooked, point that observed differences in income are not necessarily an indicator of the existence of inequality. Earnings at the top decile (shown in Panel C), for example, may have risen on account of increased costs of acquiring educational qualifications, and not represent any rise in inequality of lifetime incomes. For this reason, it is important to ask what we mean by “inequality.”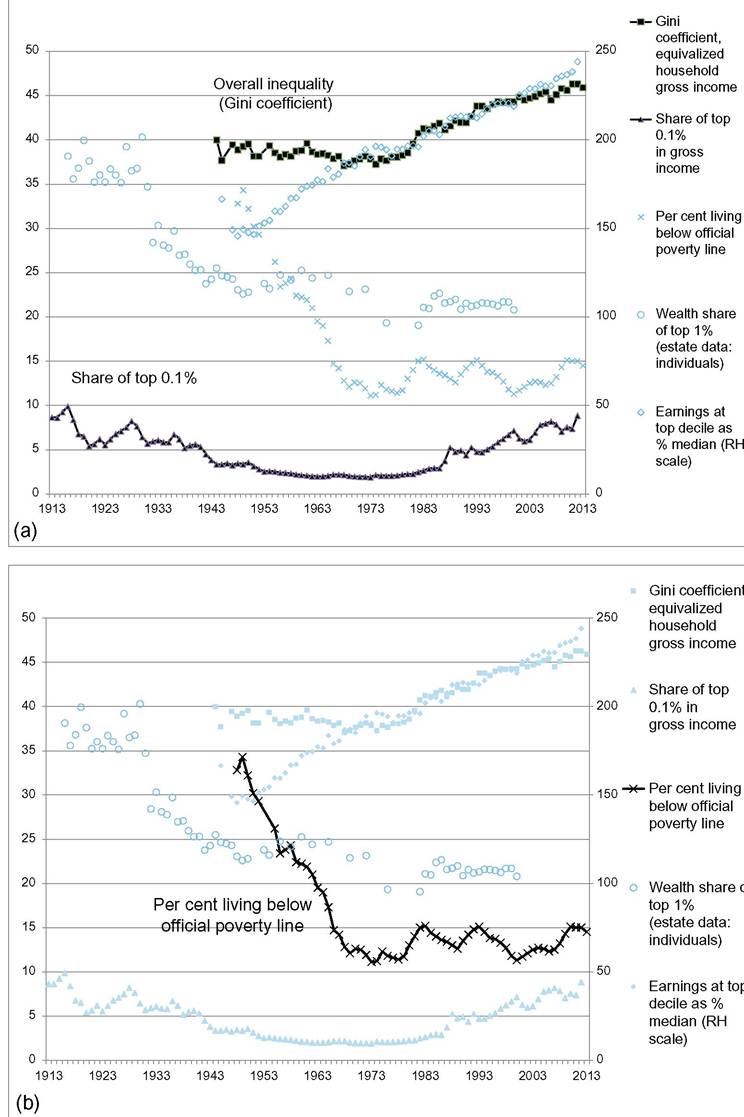
Figure 1 (See legend on next page.)
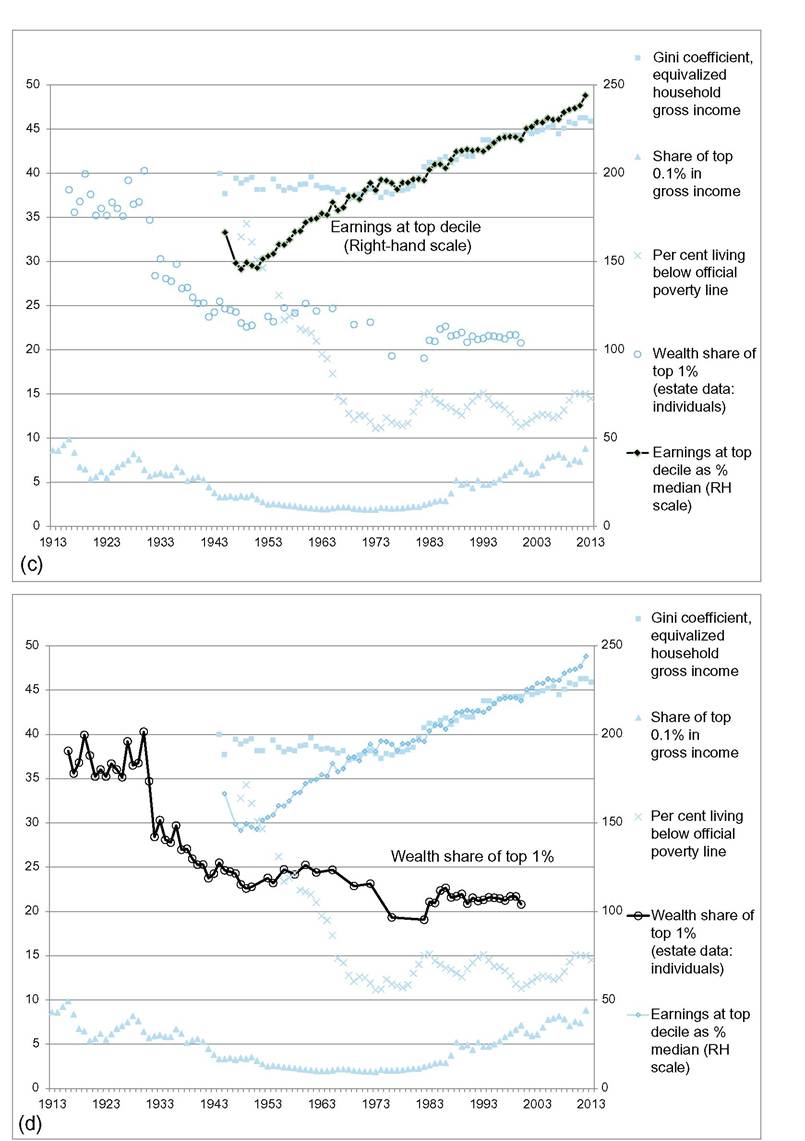
Figure 1 Inequality in the United States from 1913. (a) Overall Inequalityand top income shares. (b) Official poverty. (c) Earnings dispersion. (d) Top wealth shares. Note: The right-hand scale relates to earnings at the top decile, and all other series are measured on the left-hand scale. Atkinson and Morelli (2014).
Box Sources of Data for Figure 1
Overall inequality: Gini coefficient of gross equalized household income from the U.S. Bureau of the Census, Income, Poverty, and Health Insurance Coverage in the United States: 2013 (table A-3, Selected measures of equivalence-adjusted income dispersion), where it has been assumed that half of the recorded change between 1992 and 1993 was due to the change in methods (and therefore 1.15 percentage points have been added to the values from 1992 back to 1967), this series is linked backward at 1967 to the series from 1944 given by Budd (1970, table 6).
Top income shares: The share in total gross income (excluding capital gains) of the top 0.1% is based on the work of Piketty and Saez (2003); updated figures are taken from the Web site of Emmanuel Saez:
http://eml.berkeley.edu/ ^saez/.
Poverty: The proportion of the population below the official poverty line before 1959 from Fisher (1986) and from 1959 from the U.S. Bureau of the Census Web site, Historical Poverty Tables, Table 2 and Table B1 from the U.S. Bureau of the Census, Income, Poverty, and Health Insurance Coverage in the United States: 2013.
Individual earnings: The series for the top decile of earnings, expressed as a percentage of the median, is based on the Current Population Survey (CPS) from the OECD iLibrary, linked at 1973 to the estimates of Karoly (1992, table 2B.2), and at 1963 to the estimates in Atkinson (2008, table T.10) from the CPS tabulations.
Wealth: The share in total personal wealth of the top 1% of adult individuals is based on estate data from Kopczuk and Saez (2004, table B1).
2.