Fighting Inflation: The Role of Inflationary Expectations
Discuss the challenges and costs of reducing inflation.
Basically, inflation occurs when the aggregate quantity of goods demanded at any particular price level is rising more quickly than the aggregate quantity of goods supplied at that price level.
(Figure 12.3 illustrates such a situation.) Many factors can cause rapid increases in the aggregate quantity of goods demanded relative to the aggregate quantity supplied. Among these sources of inflation are increases in consumption or investment spending, expansionary fiscal policies, and adverse supply shocks. However, as discussed in Chapter 7, in general the only factor that can create sustained rises in aggregate demand, and thus ongoing inflation, is a high rate of money growth.If rapid money growth is inflationary, why do central banks permit rapid monetary expansion? As mentioned in Chapter 7 (and discussed in more detail in Chapter 15), in developing or war-torn countries, governments may not be able to raise enough revenue by taxing or borrowing, so they print money to finance their spending. However, in industrialized countries not engaged in or recovering from a war, governments usually are able either to tax or borrow enough to cover their expenditures. In these countries, rapid money growth usually is the result of attempts to use expansionary monetary policy to fight recessions, not balanced by tighter monetary policies in periods when output is above its full-employment level.
Because ongoing inflation generally is the result of rapid money growth, the prescription for stopping inflation appears to be simple: Reduce the rate of money growth. Unfortunately, the process of disinflation—the reduction of the inflation rate—by slowing money growth may lead to recession. In terms of the expectations- augmented Phillips curve, Eq. (12.1), if macroeconomic policy succeeds in reducing inflation below the expected rate, unemployment will rise above the natural rate.
Unemployment will remain above the natural rate until expected inflation falls to the new, lower actual inflation rate.Is there some way to reduce inflation without incurring serious unemployment costs? The expectations-augmented Phillips curve suggests one possibility: If the public's expected rate of inflation could be lowered as actual inflation was being brought down, unemployment wouldn't have to rise above the natural rate. (You should confirm that, in Eq. 12.1, if actual inflation, π, and expected inflation, πe, fall by the same amount, cyclical unemployment, u — U, doesn't increase.) That is, if expected inflation can be reduced, the original Phillips curve relating inflation and unemployment can be shifted down and to the left, reducing the rate of inflation associated with any level of unemployment.
But how can policymakers reduce the public's inflationary expectations? In the rest of this section we discuss some suggested approaches for reducing both inflation and inflationary expectations.
Rapid Versus Gradual Disinflation. Some classical economists have proposed that disinflation should be implemented quickly by a rapid and decisive reduction in the growth rate of the money supply—a strategy sometimes referred to as cold turkey. Because a cold-turkey disinflation is dramatic and highly visible to the public, proponents of this policy argue that it will quickly and substantially reduce inflationary expectations, particularly if the policy is announced well in advance. If expected inflation falls sufficiently, the expectations-augmented Phillips curve implies that the unemployment costs of the disinflation will be minimal.
However, most Keynesian economists disagree with the idea that rapid disinflation can be achieved without significant costs in terms of increased cyclical unemployment. They argue that, because of factors such as menu costs and nominal wage contracts, several years may be required for prices and wages to adjust to a disinflationary policy; during the adjustment period cyclical unemployment could be high.
Furthermore, Keynesians point out that the cold-turkey strategy may not lower inflation expectations because people may expect the government to abandon the policy if the resulting unemployment reaches politically intolerable levels.Because they fear the possible unemployment consequences of the cold-turkey strategy, many Keynesians recommend a policy of gradualism, or reducing the rate of money growth and inflation gradually over a period of years. Keynesians argue that a gradual approach, which gives prices, wages, and expectations more time to adjust to the disinflation, will raise the unemployment rate by less than the coldturkey strategy—although the period during which unemployment exceeds the natural rate may be longer. They further argue that, because the policy will be viewed as sustainable politically, gradualism may be as effective as the coldturkey approach at reducing inflationary expectations. The results of one study comparing cold turkey and gradualism are discussed below.
In Touch with Data and Research
The Sacrifice Ratio
To reduce inflation, tight monetary and fiscal policies must be used to slow the growth rate of aggregate demand. However, if these policies aren't perfectly anticipated, they will also cause output and employment to fall below their fullemployment levels—at least for a time. This loss of output and jobs is an important cost that must be weighed against the benefits of inflation-reducing policies.
Economists sometimes use the sacrifice ratio to measure the cost of lowering the inflation rate. The sacrifice ratio is the amount of output lost when the inflation rate is reduced by 1 percentage point. For example, according to a study by Laurence Ball of Johns Hopkins University,28 during the disinflation of the early 1980s the inflation rate in the United States fell by 8.83 percentage points (from a rate of 12.10% per year to 3.27% per year). For the 15 quarters of this disinflation, Ball estimated the total loss in output caused by inflation-reducing policies to be 16.18% of one year's potential GDP.
Dividing the output loss of 16.18% of potential GDP by the 8.83 percentage point reduction in inflation yields a sacrifice ratio of 1.83 for this episode. We can interpret this result as saying that each percentage point by which U.S. inflation was reduced during the early 1980s cost the country 1.83% of a year's potential GDP.Using quarterly data for nine countries, Ball calculated the sacrifice ratio for 28 disinflations that occurred during the 1960s, 1970s, and 1980s. The accompanying table reports the average sacrifice ratio he found for each country and demonstrates that the output cost of reducing inflation may vary considerably. The average sacrifice ratio ranges from less than 1.0 in France, the United Kingdom, and Japan to almost 3.0 in Germany. In other words, reducing inflation in Germany was three times as expensive, in terms of lost output, as it was in those other industrialized countries. What accounts for these differences?
| Average Sacrifice Ratios by Country | |
| Australia | 1.00 |
| Canada | 1.50 |
| France | 0.75 |
| Germany | 2.92 |
| Italy | 1.74 |
| Japan | 0.93 |
| Switzerland | 1.57 |
| United Kingdom | 0.79 |
| United States | 2.39 |
28"What Determines the Sacrifice Ratio?” in N. Gregory Mankiw, ed., Monetary Policy, Chicago: University of Chicago Press, 1994, pp. 155-188.
(continued)
By comparing the characteristics of the different countries in his sample, Ball found that one factor affecting the sacrifice ratio is the flexibility of the labor market.
Countries in which wages adjust relatively slowly to changes in labor supply and demand—owing, for example, to heavy government regulation of the labor market—tend to have higher sacrifice ratios. This finding makes sense because countries with inflexible labor markets should take longer to reach long-run equilibrium following an unexpected slowing of the growth of aggregate demand. Ball also found that rapid disinflations tend to have lower sacrifice ratios than do slow disinflations, which is a bit of evidence in favor of the cold-turkey approach rather than gradualism.Ball's results are interesting but should be interpreted with some caution. One problem is that determining exactly how much output loss can be attributed to a particular set of anti-inflationary policies isn't easy. For example, to calculate the output loss owing to disinflation we have to estimate the amount of output if there had been no disinflation, which is difficult. If the output loss calculation is wrong, the sacrifice ratio calculation will also be wrong. Factors such as supply shocks, which affect both output and inflation, can also distort the calculation of sacrifice ratios. Thus at best, the sacrifice ratio is a rough measure of the costs of reducing inflation.
Wage and Price Controls. Frustrated by the costs and difficulties of reducing inflation by reducing money growth, policymakers in some countries have taken a more direct approach and imposed wage and price controls—legal limits on the ability of firms to raise wages or prices. Supporters of wage-price controls (or of incomes policies, as wage-price controls are also called) argue that by using the force of law to stop price increases the government can "break the back" of inflationary expectations, allowing the disinflation to proceed without serious unemployment consequences.
Critics of price controls make two points. First, price controls are likely to cause shortages. In a free market the ever-changing forces of supply and demand lead to changes in relative prices, with the prices of some products rising more rapidly than the prices of others.
If price controls prevent the price of a product from rising to the level at which quantity supplied equals quantity demanded, there will be excess demand for the product—that is, a shortage. These shortages and the disruptions they cause are a major cost of price controls.Second, critics dispute that wage-price controls have a major effect on the public's inflation expectations. Although controls stop inflation for the moment, because they cause shortages and disrupt the economy they eventually have to be removed. Knowing that the controls are temporary, people may expect even greater inflation in the future.
The most recent U.S. experience with price controls occurred in the early 1970s. President Nixon imposed price controls from August 1971 to April 1974 in an attempt to prevent inflation from rising higher than 5%. But shortages arose for many goods, including chicken broilers, lumber, and various steel products. And when the price controls were lifted, prices returned to the levels they would have attained had the controls never been put in place.
One factor that may affect expectations of inflation during the period of controls is how the government handles monetary and fiscal policy. If macroeconomic policies allow aggregate demand to continue to grow rapidly, people may expect renewed inflation when the controls are lifted (see Analytical Problem 5 at the end of the chapter). This failure to reduce aggregate demand growth appears to have been the problem with the Nixon wage-price controls that began in 1971. But if controls are accompanied by tight monetary and fiscal policy, the idea that inflation will not resume when controls are lifted is more plausible.
Credibility and Reputation. Classicals and Keynesians agree that, for disinflation to be achieved without high unemployment costs, reducing the public's expected inflation rate is important. Perhaps the most important factor determining how quickly expected inflation adjusts is the credibility, or believability, of the government's announced disinflationary policy. If the government (in the person of the President or the chairman of the Federal Reserve, for example) announces a policy to reduce the inflation rate—and if workers, consumers, and firms believe that the government means what it says—expected inflation should drop fairly rapidly.
How can a government improve its credibility with the public? One desirable way would be for the government to develop a reputation for carrying through on its promises; then when it announces a disinflation program, people would likely take this announcement seriously. Unfortunately, time is needed to develop such a reputation, and changes in administration may lead to relatively frequent changes in the people who make policy decisions.
Another strategy is to organize policymaking institutions in ways that create credibility with the public. For example, a strong and independent central bank, run by someone with well-known anti-inflation views, may have credibility with the public when it announces a disinflationary policy. However, if the central bank is controlled directly by the executive branch—and is therefore exposed to intense political pressure when unemployment rises—an announced disinflationary program is likely to be less credible. We explore the relationship among institutional structure, government credibility, and inflation expectations in greater detail in Chapter 14.
The U.S. Disinflation of the 1980s and 1990s
Theories about disinflation were put to the test in the 1980s and 1990s in the United States. Beginning in 1979 under Paul Volcker and continuing in 1987 under Alan Greenspan, the Federal Reserve sought to eliminate inflation as a major source of economic instability. From 1979 to 1982, Chairman Volcker reduced inflation from double-digit levels to about 4%. From 1982 on, Volcker and then Greenspan gradually reduced the inflation rate. Their goal was to keep inflation from being a major consideration in the minds of consumers and investors. They wanted inflation to be at such a low and stable rate that it would no longer worry people and they would have confidence that it would never rise substantially again.
One way to judge the success of the Federal Reserve is to examine people's inflation expectations. To do so, we use inflation forecasts from the Survey of Professional Forecasters, collected by the Federal Reserve Bank of Philadelphia, as
FIGUREJ2.10
Expected inflation rate, 1971Q1-2021Q4 The figure shows quarterly values for the expected inflation rate over the coming four quarters beginning with the date shown on the horizontal axis, for the period from the first quarter of 1971 to the fourth quarter of 2021. Expected inflation displayed large movements in the 1970s and 1980s before declining gradually in the 1990s. Expected inflation remained below 2.5% in the 2000s through mid- 2021 and then began to rise as inflation in the second half of 2021 increased sharply.
Sources: Survey of Professional Forecasters, Federal Reserve Bank of Philadelphia, available at www.philadelphiafed.org/research- and-data/real-time-center/ survey-of-professional-forecasters.
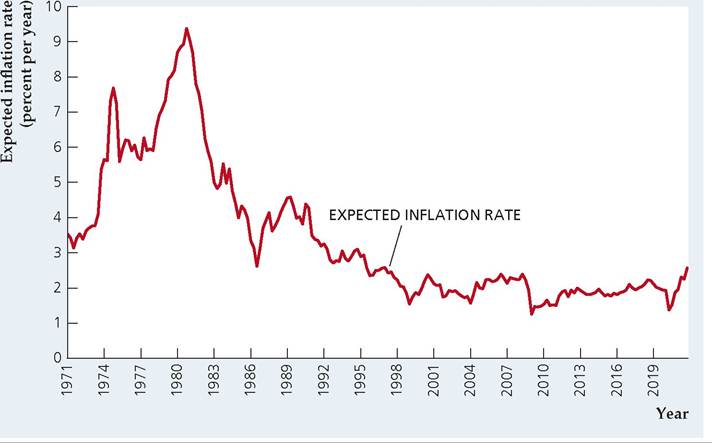
shown in Figure 12.10. The graph shows sharp swings up and down prior to about 1990. After that, the expected inflation rate follows a gradual downward trend until about 1998 and has been fairly stable since then.
The Fed's disinflation process, beginning in 1979, was at first a bit unstable, perhaps because the Fed had failed to curb inflation during the 1970s and the newly appointed Fed chairman, Paul Volcker, had not yet established his credibility. As a result, inflation expectations did not decline immediately when inflation fell. Over the decade, as people came to accept the Fed's desire to reduce inflation, the Fed gained credibility. The period since 1990, characterized by gradualism, was accompanied by a slow, steady drop in inflation expectations. By the time Greenspan left office in 2006 and Ben Bernanke took over, the Fed's credibility was well established. The fact that inflation expectations barely increased in the period from 2004 to 2008, despite large increases in oil prices, suggested that the Fed's reputation and credibility were well established. To solidify its reputation, in January 2012 the Fed took the additional step of announcing an explicit long-run inflation target of 2%, as measured by the price index for personal consumption expenditures. In 2020, the Fed announced a policy of flexible average inflation targeting, in which it would allow inflation to temporarily rise above 2% to make up for periods when inflation was below 2%. This policy change may have backfired when inflation began rising significantly in 2021.
►