KEY DIAGRAM 3
The savinginvestment diagram
In an economy with no foreign trade, the goods market is in equilibrium when desired national saving equals desired investment. Equivalently, the goods market is in equilibrium when the aggregate quantity of goods supplied equals the aggregate quantity of goods demanded.
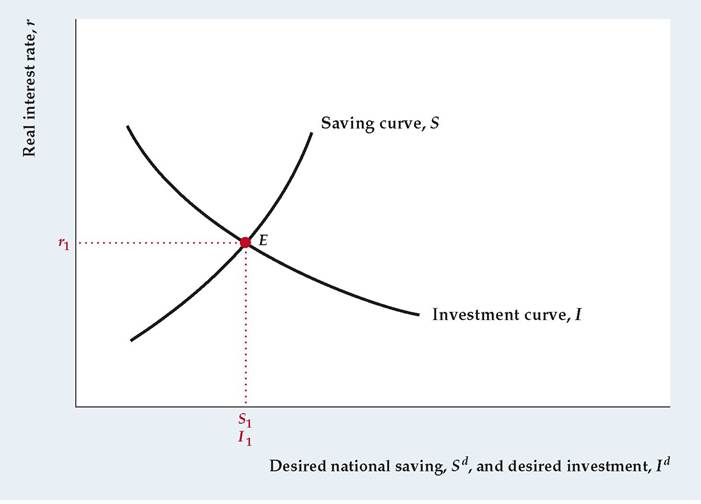
Diagram Elements
■ The real interest rate, r, is on the vertical axis; desired national saving, Sd, and desired investment, Id, are on the horizontal axis.
■ The saving curve, S, shows the level of desired national saving at each real interest rate. The saving curve slopes upward because a higher real interest rate increases the reward for saving and causes households to save more. (Empirically, this effect outweighs the tendency of a higher real interest rate to lower saving by reducing the amount of saving necessary to reach any specified target.) Desired national saving is defined as Sd = Y — Cd — G, where Y is output, Cd is desired consumption, and G is government purchases.
■ The investment curve, I, shows the amount that firms want to invest in new capital goods at each real interest rate. The investment curve slopes downward because a higher real interest rate raises the user cost of capital and thus lowers the amount of capital that firms want to use.
Analysis
■ Goods market equilibrium requires that desired national saving equal desired investment, or Sd = Id.
■ Goods market equilibrium occurs in the diagram at point E, where the saving curve and investment curve intersect. At E, desired national saving equals S1, desired investment equals 11, and S1 = 11. The real interest rate at E, r1, is the real interest rate that clears the goods market.
■ An alternative way to express the goods market equilibrium condition is as follows: The quantity of goods supplied, Y, equals the quantity of goods demanded by households, Cd, firms, Id, and the government,
Factors That Shift the Curves
■ Any factor that raises desired national saving at a given real interest rate shifts the saving curve to the right; similarly, any factor that lowers desired national saving shifts the saving curve to the left. Factors that affect desired national saving are listed in Summary table 5. Similarly, factors that change desired investment for a given real interest rate shift the investment curve; see Summary table 6, for factors that affect desired investment. Shifts of either curve change the goods market equilibrium point and thus change national saving, investment, and the real interest rate.
►