Money Growth and Inflation
Discuss the relationship between money growth and inflation.
To obtain an equation for the rate of inflation, we set the growth rate of the left side of Eq. (7.10) equal to the growth rate of its right side to obtain

where the symbol ∆ indicates the change in a variable from one year to the next.
The left side of Eq. (7.11) is the growth rate of the price level, ∆P∣P, which is the same as the inflation rate, π. The right side of Eq. (7.11) expresses the growth rate of the ratio on the right side of Eq. (7.10) as the growth rate of the numerator, M, minus the growth rate of the denominator, L (Y, r + πe). (In Appendix A, Section A.7, we provide some useful formulas for calculating growth rates.) Equation (7.11) shows that, if the asset market is in equilibrium, the rate of inflation equals the growth rate of the nominal money supply minus the growth rate of real money demand.Equation (7.11) highlights the point that the rate of inflation is closely related to the rate of growth of the nominal money supply. However, to use Eq. (7.11) to predict the behavior of inflation, we must also know how quickly real money demand is growing. The money demand function, Eq. (7.3), focused on two macroeconomic variables with significant effects on real money demand: income (or output), Y, and the nominal interest rate, r + πe. The income elasticity of money demand is the percentage change in money demand resulting from a 1% increase in real income. If ∆Y∕Y is the percentage change in real income from one year to the next and ηy is the income elasticity of money demand, ηy ∆Y∕Y is the resulting percentage increase in the real demand for money, with the nominal interest rate and other factors affecting money demand held constant.[126] Substituting π for ∆P∕P and ηy ∆Y∕Y for the growth rate of real money demand in Eq.
(7.11) yields
Equation (7.12) is a useful simple expression for the rate of inflation. According to Eq. (7.12), the rate of inflation equals the growth rate of the nominal money supply minus an adjustment for the growth rate of real money demand arising from growth in real output. For example, suppose that nominal money supply growth is 10% per year, real income is growing by 3% per year, and the income elasticity of money demand is 2/3. Then Eq. (7.12) predicts that the inflation rate will be 10% - (2/3)(3%), or 8% per year.
Application
FIGURE 7.4
The relationship between money growth and inflation Nominal money growth and inflation during the period 1995-2001 are plotted for the European countries in transition for which complete data are available. There is a strong relationship between money growth rates and inflation rates, with countries having money growth rates in excess of 80% per year also having inflation rates in excess of 80% per year. Source: Based on money growth rates and consumer price inflation from International Financial Statistics, February 2003, International Monetary Fund. Figure shows European countries in transition for which there are complete data.
Eastern European economies continued to face serious problems, including very high rates of inflation. The main reason for the high inflation rates is the rapid rates of money growth in these countries.
In general, both the growth of the nominal money supply and the growth of real money demand (resulting from real income growth, for example) affect the rate of inflation (see Eq. 7.12). In countries with high inflation, however, the growth of the nominal money supply usually is the much more important of these two factors. To illustrate, if the income elasticity of money demand in a country is 2/3, and real output were to grow at the stunning rate of 15% per year, then in Eq. (7.12) real money demand would grow at 10% per year (2/3 ? 15%) in that country.
If a second country also has an income elasticity of 2/3, but its income is falling at the painful rate of 15% per year, the rate of growth of real money demand is -10% per year. Thus even with these radically different income growth rates, the difference in the growth rates of real money demand is only 20 percentage points per year.In contrast to the relatively modest differences among countries in the growth rates of real money demand, rates of growth of nominal money supplies may vary among countries by hundreds of percentage points per year. Thus large differences in inflation rates among countries almost always are the result of large differences in rates of money growth.
The link between the money growth rate and the inflation rate is illustrated in Figure 7.4, which shows the average annual values of these rates during the period 1995-2001 for the European countries designated by the International Monetary Fund as "countries in transition." Most of these countries were in
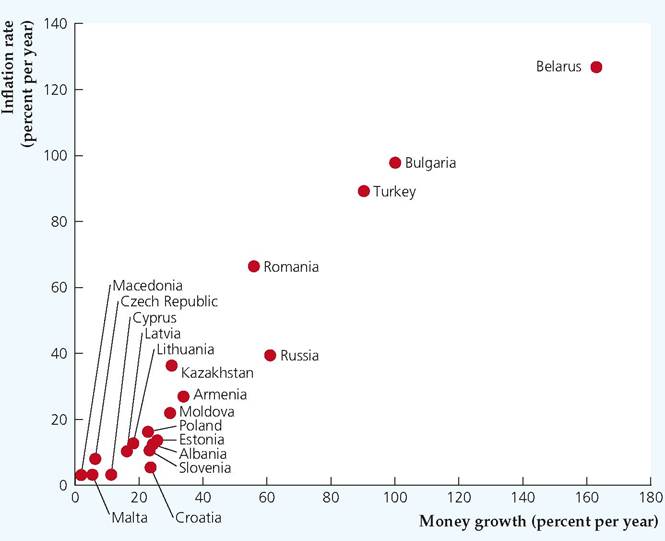
the process of moving from communism to free-market capitalism. The three countries that had inflation rates that averaged more than 80% per year during this period—Belarus, Turkey, and Bulgaria—also had money growth rates that averaged more than 80% per year. Whether we compare inflation rates among these three countries or compare the high inflation rates of these three countries with the relatively low inflation rates of the remaining 16 countries, large differences in inflation rates clearly are associated with large differences in rates of money growth.
If rapid money growth causes inflation, why do countries allow their money supplies to grow so quickly? As we discussed earlier, governments sometimes find that printing money (borrowing from the central bank) is the only way that they can finance their expenditures. This situation is most likely to occur in poor countries or countries that undergo economic upheavals associated with war, natural disaster, or (as in the case of the European countries in transition) major political and economic change.
Unfortunately, the almost inevitable result of financing government expenditures in this way is increased inflation.The Inflation Rate and the Nominal Interest Rate
The public's expected rate of inflation is not directly observable, except perhaps through surveys. (See the Application "Measuring Inflation Expectations.") However, it is apparent from Eq. (7.11) that if the growth rate of the nominal money supply and the factors that affect the growth rate of money demand, such as real income growth, are expected not to change much from their current values, then the rate of inflation will not be expected to change much from its current value. That is, πe is approximately equal to π. Therefore, the nominal interest rate, i = r + πe, is approximately equal to r + π. If, in addition, the real interest rate, r, is constant, the nominal interest will move one for one with the actual inflation rate, π.
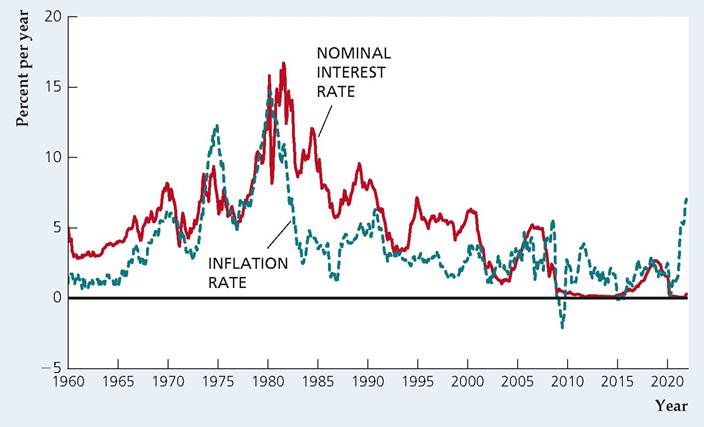
The historical relationship between nominal interest rates and inflation is illustrated by Figure 7.5, which shows monthly data on the nominal interest rate on one-year Treasury bills and the twelve-month inflation rate measured by the consumer price index in the United States from January 1960 to December 2021. The nominal interest rate and the inflation rate have tended to move together, rising during the 1960s and 1970s and then falling sharply after reaching a peak in the early 1980s. However, movements in the inflation rate aren't perfectly matched by movements in the nominal interest rate because the real interest rate hasn't been constant over this period. In particular, during the late 1970s and early 1980s, the rise in the nominal interest rate was much greater than the rise in the inflation rate, reflecting an increase in the real interest rate from a negative value in the mid-1970s to much higher, positive values in the 1980s. Also, following the financial crisis of 2008, the real interest rate was negative, as the nominal interest rate was near zero and the inflation rate was 1 to 2% per year.
(See Fig. 2.6 for a graph of the real interest rate.) In 2021, with the nominal interest rate remaining near zero, the inflation rate began rising sharply, as the economy recovered from the pandemic.FIGURE 7.5
Inflation and the nominal interest rate in the United States, 1960-2021
The figure shows the nominal interest rate on one-year Treasury bills and the twelve-month rate of inflation as measured by the consumer price index. The nominal interest rate tends to move with inflation, although there are periods, such as the period since 2008, when the two variables do not move together.
Source: Interest rate from Board of Governors of the Federal Reserve System, downloaded from FRED database of the Federal Reserve Bank of St. Louis, fred.stlouisfed.org/series/ GS1; CPI from Bureau of Labor Statistics, downloaded from FRED, series CPIAUCNS.
Application
Measuring Inflation Expectations
One of the factors that affect equilibrium in the asset market is people's expectations of future inflation rates. For this reason, various surveys are conducted by government research institutions and private specialized professional institutions (such as YouGov UK) to gather information about people's long-term inflation expectations. As they affect overall patterns of national spending and saving, gauging these future inflation expectations is important for policymakers and businesses alike. Moreover, future inflation expectations are important for pensioners and bond holders because a hike in prices is likely to lower their purchasing power and impact their real earnings on investments.
In order to act as a direct hedge against inflation, some governments have started to issue inflation-linked bonds, generally known as linkers. The United Kingdom began to issue linkers in 1981, and together with the United States and France, it accounts for almost 85% of global inflation-linked government bonds.
Since the global financial crisis, inflation-linked bonds have expanded globally and spread to some emerging countries such as Brazil, Mexico, India, Turkey, and South Africa.Government linkers and nominal/conventional bonds are similar in terms of maturities (five, ten, and twenty years) and coupon payments (annual, semiannual, and quarterly). But both differ in terms of interest rates over the life of the
FIGURE 7.6
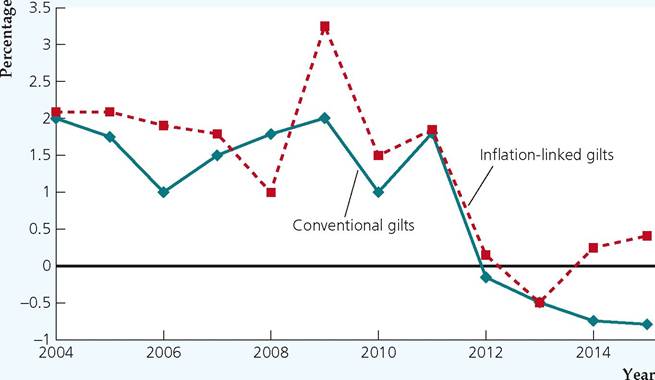
Interest rates on UK nominal and inflation- indexed 10-year government gilts 2004-2014
The chart shows averages of quarterly nominal interest rates on 10-year UK conventional and inflation-indexed government gilts for the period 2004Q1-2014Q4. Source: United Kingdom Debt Management Office, “Gilt Market Index Ratio Data for Index-linked Gilts with a 3-month Indexation Lag,” https://www.dmo.gov.uk/data/ ExportReport?reportCode=D10C.
bond. While nominal bonds pay a given nominal interest rate, inflation-indexed bonds make a periodic coupon that is equal to the product of the daily inflation index and the nominal coupon rate. In this fashion, linkers hedge the real rate of return from inflation by adjusting both the interest payments and the principal amount of the bonds. On the other hand, the real interest rate on nominal bonds depends on the rate of inflation during the life of the bond. The expected real interest rate on the nominal bond is (recall Eq. 2.14) r = i — πe, where i is the nominal interest rate and πe is the expected rate of inflation during the life of the bond.
Figure 7.6 shows the average nominal interest rate on conventional UK 10-year government bonds, also known as gilts, and the average real interest rate for all inflation-linked gilts in issue over the last 10 years, based on a 3% inflation assumption. Since 2004, the real interest rate on UK linkers had trended down to less than 1% in 2007 but showed a temporary hike in 2008 in the midst of the global financial crisis.
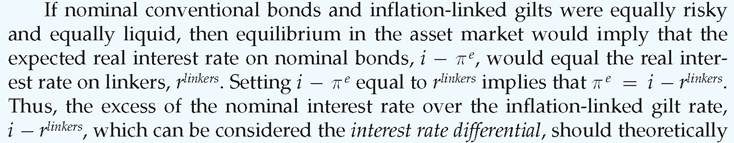
provide a rough measure of expected inflation. However, this may not always be the case for two reasons. First, since linkers are less liquid (that is, they have fewer buyers and sellers), their interest rate is higher than that of traditional bonds sold in a more liquid market. Second, because buyers of conventional gilts are aware that they are shouldering a higher inflation risk in comparison to buyers of
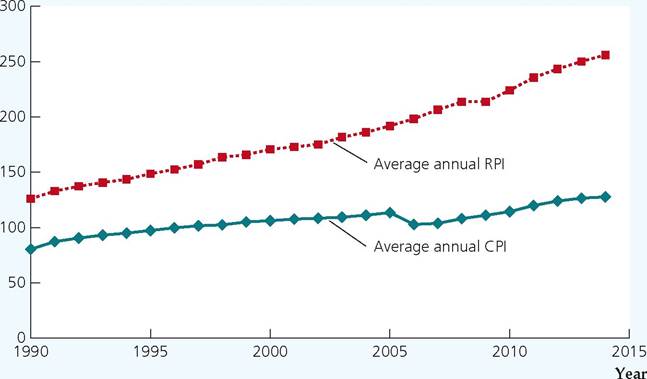
FIGURE 7.7
Alternative measures of inflation, 1990-2015
The chart shows annual values for two different measures of inflation: The annual CPI and RPI. Since the RPI uses arithmetic averages while the CPI generally uses the geometric mean, the RPI records higher inflation than the CPI.
Sources: The retail prices index and consumer price index are available at the UK Office for National Statistics website, http://www.ons.gov.uk/.
linkers, the interest rate differential is attributable to the risk factor and not to inflation per se. But these two effects would normally be small and work in opposite directions and, hence, have an overall small net effect.
But two words of caution must be highlighted. First, since bonds are always linked to a fixed inflation index, the preservation of purchasing power and the inflation protection that the investor attains is highly contingent on the components and calculation of the commodity basket that serves as the base for the price index. In the United States, the consumer price index (CPI) is used, while the United Kingdom uses the retail price index (RPI). The considerable differences in the RPI and CPI[127] (shown in Figure 7.7) have prompted heated discussions regarding the change to the CPI to index UK linkers.
Moreover, it must be noted that official inflation indices may not be highly accurate for indexing since they are not calculated on a daily but a monthly basis, with a time indexation lag of one to three months. Second, the European sovereign debt crisis has revealed that sovereign bankruptcy and high inflation often coexist, with the consequence that linkers may not offer adequate protection against inflation and default risks. As such, linkers in the United States, the United Kingdom, and Germany have been priced at negative real interest rates, making them less attractive. These two restraints indicate the importance of prudent risk and credit analysis of inflation-linked government gilts.
►