NUMERICAL PROBLEMS
1. The following data give real GDP, Y, capital, K, and labor, N, for the U.S. economy in various years.
| Year | Y | K | N |
| 1960 | 3262 | 3821 | 65 |
| 1970 | 4954 | 5767 | 78 |
| 1980 | 6764 | 8293 | 99 |
| 1990 | 9371 | 11,298 | 117 |
| 2000 | 13,138 | 15,887 | 134 |
| 2010 | 15,649 | 19,373 | 140 |
| 2020 | 18,385 | 23,539 | 158 |
Units and sources are the same as in Table 3.1.
Assume that the production function is
a. By what percentage did U.S. total factor productivity grow in each decade?
b. What happened to the marginal product of labor between 1960 and 2020? Calculate the marginal product numerically as the extra output gained by adding 1 million workers in each of the two years. (The data for employment, N, are measured in millions of workers, so an increase of 1 million workers is an increase of 1.0.)
2. Suppose the production function is and
and
that in 2000, K = 1000, N = 100, and Y = 199.5. In 2010, capital, labor, and output have doubled, so K = 2000, N = 200, and Y = 399.
a. By what percentage did productivity grow from 2000 to 2010?
b. If output had risen to 798 instead of 399 and capital and labor had doubled, by what percentage would productivity have grown from 2000 to 2010?
3. Acme Widget, Inc. has the following production function.
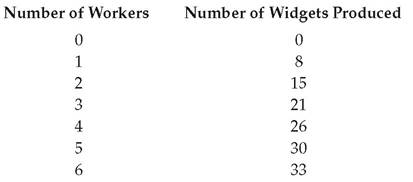
a.
Find the MPN for each level of employment.b. Acme can get $5 for each widget it produces. How many workers will it hire if the nominal wage is $38? If it is $27? If it is $22?
c. Graph the relationship between Acme's labor demand and the nominal wage. How does this graph differ from a labor demand curve? Graph Acme's labor demand curve.
d. With the nominal wage fixed at $38, the price of widgets doubles from $5 each to $10 each. What happens to Acme's labor demand and production?
e. With the nominal wage fixed at $38 and the price of widgets fixed at $5, the introduction of a new automatic widget maker doubles the number of widgets that the same number of workers can produce. What happens to labor demand and production?
/.What is the relationship between your answers to part (d) and part (e)? Explain.
4. The marginal product of labor (measured in units of output) for a certain firm is
where A measures productivity and N is the number of labor hours used in production. The price of output is $2.00 per unit.
a. If A = 1.0, what will be the demand for labor if the nominal wage is $10? If it is $20? Graph the demand curve for labor. What is the equilibrium real wage if the supply of labor is fixed at 95?
b. Repeat part (a) for A = 2.0.
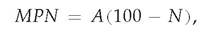
5. Consider an economy in which the marginal product of labor MPN is MPN = 309 — 2N, where N is the amount of labor used. The amount of labor supplied, NS, is given by NS = 22 + 12w + 2T, where w is the real wage and T is a lump-sum tax levied on individuals.
a. Use the concepts of income effect and substitution effect to explain why an increase in lump-sum taxes will increase the amount of labor supplied.
b. Suppose that T = 35. What are the equilibrium values of employment and the real wage?
c. With T remaining equal to 35, the government passes minimum-wage legislation that requires firms to pay a real wage greater than or equal to 7.
What are the resulting values of employment and the real wage?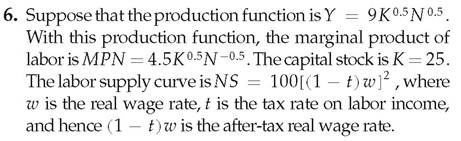
a. Assume that the tax rate on labor income, t, equals zero. Find the equation of the labor demand curve. Calculate the equilibrium levels of the real wage and employment, the level of full-employment output, and the total after-tax wage income of workers.
b. Repeat part (a) under the assumption that the tax rate on labor income, t, equals 0.6.
c. Suppose that a minimum wage of w = 2 is imposed. If the tax rate on labor income, t, equals zero, what are the resulting values of employment and the real wage? Does the introduction of the minimum wage increase the total income of workers, taken as a group?
7. Consider an economy with 500 people in the labor force. At the beginning of every month, 5 people lose their jobs and remain unemployed for exactly one month; one month later, they find new jobs and become employed. In addition, on January 1 of each year, 20 people lose their jobs and remain unemployed for six months before finding new jobs. Finally, on July 1 of each year, 20 people lose their jobs and remain unemployed for six months before finding new jobs.
a. What is the unemployment rate in this economy in a typical month?
b. What fraction of unemployment spells last for one month? What fraction last for six months?
c. What is the average duration of a completed spell of unemployment?
d. On any particular date, what fraction of the unemployed are suffering a long spell (six months) of unemployment?
8. Suppose the economy's production function is Y =
 and that K = 200, N = 2000, and A = 1. Calculate the marginal products of labor and capital.
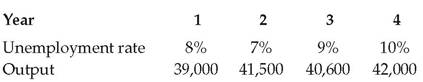
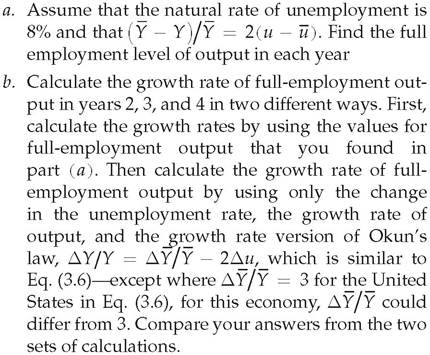
9. You are given the following data on the unemployment rate and output in France.
10.
Consider an economy that initially has a labor force of 2000 workers. Of these workers, 1900 are employed and each works 40 hours per week. Ten units of output are produced by each hour of labor.a. What is the total number of hours worked per week in the economy? What is the total output per week in the economy? What is the unemployment rate?
b. The economy enters a recession. Employment falls by 4%, and the number of hours per week worked by each employed worker falls by 2.5%. In addition, 0.2% of the labor force becomes discouraged at the prospect of finding a job and leaves the labor force. Finally, suppose that whenever total hours fall by 1%, total output falls by 1.4%.
After the recession begins, what is the size of the labor force? How many workers are unemployed and what is the unemployment rate? What is the total output per week in the economy?
By what percentage has total output fallen relative to the initial situation? What is the value of the Okun's law coefficient relating the loss of output to the increase in the unemployment rate?
►