NUMERICAL PROBLEMS
1. In a certain economy, the production function is
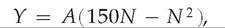
where Y is the output, A is productivity, and N is the total hours worked.
The marginal product of labor associated with this production function isMPN = A( 150 - 2N).
Initially, A = 1.0, but a beneficial productivity shock raises A to 1.2.
a. The supply of labor is
NS = 40 + 0.2w,
where w is the real wage. Find the equilibrium levels of output, hours worked, and the real wage before and after the productivity shock. Recall (Chapter 3) that the MPN curve is the same as the labor demand curve, with the real wage replacing the MPN.
b. Repeat part (a) if the labor supply is
NS = 20 + 0.6w.
c. How does the positive productivity shock shift the ND curve? What does the slope of the NS curve mean? Given the same productivity shock, how do the different slopes of the labor supply curve in parts (a) and (b) affect the wages? Show your results graphically. Based on your graph, explain how the slopes of the NS curve affect the procyclical behavior of wages.
2. A simplified model of the economy of Finland is described as follows:
Desired consumption Cd = 100 + 0.5(Y — T) — 50r.
Desired investment Id = 150 — 50r.
Real money demand L = 0.5Y — 100i. Full-employment output
Expected inflation
In this economy, the government always has a balanced budget, so T = G, where T is total taxes collected.
a. Suppose that M = 1400 and G = 280. Use the classical IS-LM model to find the equilibrium values of output, the real interest rate, the price level, consumption, and investment.
(Hint: In the classical model, output always equals its full employment level.)b. The money supply rises to 1540. Repeat part (a). Is money neutral?
c. With the money supply back at 1400, government purchases and taxes rise to 350. Repeat part (a). Assume for simplicity that Y is fixed (unaffected by G). Is fiscal policy neutral in this case? Explain.
3. Consider the following economy.
Desired consumption Cd = 200 + 0.4( Y — T) — 400r.
Desired investment Id = 300 — 400r.
Real money demand L = 0.6Y — 400i. Full-employment output
Expected inflation
a. Suppose that T = G = 175 and that M = 11,165. Find an equation describing the IS curve. Find an equation describing the LM curve. Finally, find an equation for the aggregate demand curve. What are the equilibrium values of output, consumption, investment, the real interest rate, and the price level? Assume that there are no misperceptions about the price level.
b. Suppose that T = G = 240 and that M = 11,165. What is the equation for the aggregate demand curve now? What are the equilibrium values of output, consumption, investment, the real interest rate, and the price level? Assume that full employment output, Y, is fixed.
c. Repeat part (b) for T = G = 175 and M = 13,195.
4. An economy has the following AD and AS curves.
AD curve Y = 400 + 25(M/P).
AS curve Y = Yf + 15(P — Pe).
Here, Yf = 500 and M = 160.
a. Suppose that Pe = 40. What are the equilibrium values of the price level, P, and output, Y? (Hint: The solutions for P in this part and in part (b) are multiples of 5.)
b. Money supply (M) increases unexpectedly to 500. Since the increase is unanticipated, Pe remains at 40. What are the equilibrium values of the price level, P, and output, Y?
c.
The Fed announces that the money supply will be increased to M = 500, which the public believes. Now what are the equilibrium values of the price level, P, the expected price level, Pe, and output, Y?5. Output in an economy is given by the production function Y = AK 0.3N 0∙7, where Y is output, A measures productivity, the capital stock, K, is fixed at 30, and employment N is fixed at 100. Output equals 100 in the year 2021 and equals 105 in 2022.
a. Find the Solow residual in the years 2021 and 2022, and its growth rate between those two years.
b. What is the relationship between the growth in the Solow residual between 2021 and 2022 and the growth in productivity (as measured by the parameter A) in the same years? Assume that the rates of utilization of capital and labor remain unchanged.
c. Repeat part (b) under the assumption that utilization of labor increases by 3% between 2021 and 2022. You will have to modify the production function along the lines of Eq. (10.2).
d. Repeat part (b) under the assumption that the utilization rates of both labor and capital increase by 3% between 2021 and 2022.
6. Try the following experiment: Flip a coin fifty times, keeping track of the results. Think of each “heads" as a small positive shock that increases output by one unit; similarly, think of each “tails" as a small negative shock that reduces output by one unit. Let the initial
►