What Macroeconomics Is About
Summarize the primary issues addressed in macroeconomics.
Learning Objectives
1.1 Summarize the primary issues addressed in macroeconomics.
1.2 Describe the activities and objectives of macroeconomists.
1.3 Differentiate between the classical and Keynesian approaches to macroeconomics.
Macroeconomics is the study of the structure and performance of national economies and of the policies that governments use to try to affect economic performance. The issues that macroeconomists address include the following:
■ What determines a nation's long-run economic growth? In 1870, income per capita was smaller in Norway than in Argentina. But today, income per capita is four times as high in Norway as in Argentina. Why do some nations' economies grow quickly, providing their citizens with rapidly improving living standards, whereas other nations' economies are relatively stagnant?
■ What causes a nation's economic activity to fluctuate? Following a deep recession from the end of 2007 to mid-2009, the U.S. economy enjoyed the longest period of uninterrupted economic growth in U.S. economic history, until the COVID pandemic hit the entire world economy in early 2020. In the second quarter of 2020, output declined by more than 31%, the largest decline in U.S. history. But output grew more than 33% in the third quarter, which is the largest increase in the nation's history. Why do economies sometimes experience sharp short-run fluctuations, lurching between periods of prosperity and periods of hard times?
■ What causes unemployment? During the 1930s, one-quarter of the work force in the United States was unemployed. A decade later, during World War II, less than 2% of the work force was unemployed. Why does unemployment sometimes reach very high levels? Why, even during times of relative prosperity, is a significant fraction of the work force unemployed?
■ What causes prices to rise? The rate of inflation in the United States crept steadily upward during the 1970s, and exceeded 10% per year in the early 1980s, before dropping to less than 4% per year in the mid-1980s and dropping even further to less than 2% per year in the late 1990s.
Germany's inflation experience has been much more extreme: Although Germany has earned a reputation for low inflation in recent decades, following its defeat in World War I, Germany experienced an 18-month period (July 1922-December 1923) during which prices rose by a factor of several billion! What causes inflation, and what can be done about it?■ How does being part of a global economic system affect nations' economies? In the late 1990s, the U.S. economy was the engine of worldwide economic growth. From 2007 to 2009, when the U.S. economy fell into a deep decline,
most of the rest of the world followed. How do economic links among nations, such as international trade and borrowing, affect the performance of individual economies and the world economy as a whole?
■ Can government policies be used to improve a nation's economic performance? In the 1980s and 1990s, the U.S. economy's output, unemployment rate, and inflation rate fluctuated much less than in the 1960s and 1970s. Some economists credit good government policy for the improvement in economic performance. In the financial crisis of 2008, the Federal Reserve and the federal government used extraordinary measures to keep banks and other financial institutions from failing. But some economists criticized these measures for going too far in trying to stabilize the economy, at the expense of creating incentives for increased risk taking by financial firms. Other economists criticized the Federal Reserve for not going far enough because the unemployment rate remained persistently high for years after the end of the recession in 2009. How should economic policy be conducted to keep the economy as prosperous and stable as possible?
Macroeconomics seeks to offer answers to such questions, which are of great practical importance and are constantly debated by politicians, the press, and the public. In the rest of this section, we consider these key macroeconomic issues in more detail.
Long-Run Economic Growth
If you have ever traveled in a developing country, you could not help but observe the difference in living standards relative to those of countries such as the United States.
The problems of inadequate food, shelter, and health care experienced by citizens of rich nations who are the poorest often represent the average situation for the people of a developing country. From a macroeconomic perspective, the difference between rich nations and developing nations may be summarized by saying that rich nations have at some point in their history experienced extended periods of rapid economic growth but that the poorer nations either have never experienced sustained growth or have had periods of growth offset by periods of economic decline.Figure 1.1 summarizes the growth in output of the U.S. economy since 1869.[1] The record is an impressive one: Over the past 152 years, the annual output of U.S. goods and services has increased by more than 150 times. The performance of the U.S. economy is not unique, however; other industrial nations have had similar, and in some cases higher, rates of growth over the same period of time. This massive increase in the output of industrial economies is one of the central facts of modern history and has had enormous political, military, social, and even cultural implications.
In part, the long-term growth of the U.S. economy is the result of a rising population, which has meant a steady increase in the number of available workers. But another significant factor is the increase in the amount of output that can be
FIGUREJ.1
Output of the U.S. economy, 1869-2021
In this graph the output of the U.S. economy is measured by real gross domestic product (real GDP) for the period 1929-2021 and by real gross national product (real GNP) for the period prior to 1929, with goods and services valued at their 2012 prices in both cases (see Chapter 2). Note the strong upward trend in output over time, as well as sharp fluctuations during the Great Depression (1929-1940), World War II (1941-1945), and the recessions of 1973-1975, 1981-1982, 1990-1991, 2001, 2007-2009, and 2020.
Sources: Real GNP 1869-1928 from Christina D.
Romer, “The Prewar Business Cycle Reconsidered: New Estimates of Gross National Product, 1869-1908,” Journal OfPolitical Economy, 97, 1 (February 1989), pp. 22-23; real GDP 1929 onward from FRED database, Federal Reserve Bank of St. Louis, fred.stlouisfed.org/series/ GDPCA. Data from Romer were rescaled to 2012 prices.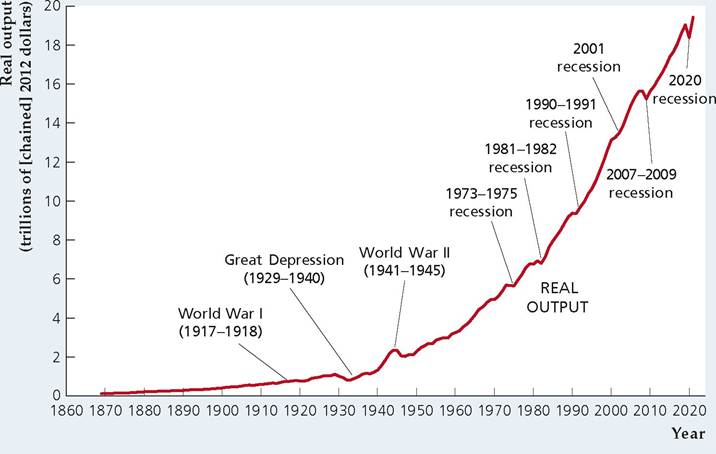
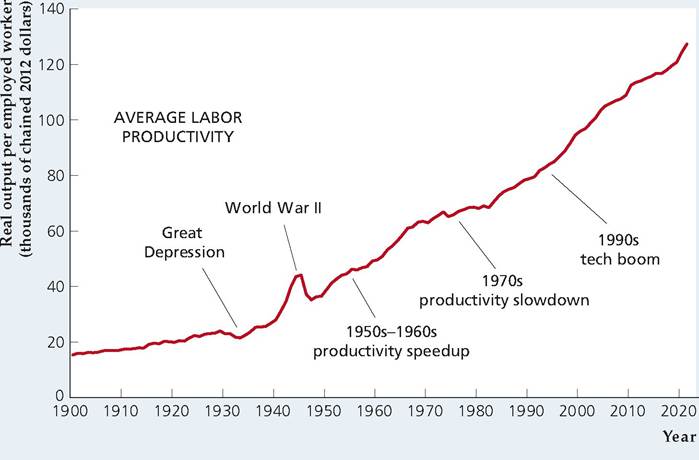
produced with a given amount of labor. The amount of output produced per unit of labor input—for example, per worker or per hour of work—is called average labor productivity. Figure 1.2 shows how average labor productivity, defined in this case as output per employed worker, has changed since 1900. In 2021, the average worker in the United States produced more than eight times as much output as the average worker at the beginning of the twentieth century, despite working fewer hours over the course of the year. Because today's typical worker is so much more productive, Americans enjoy a significantly higher standard of living than would have been possible a century ago.
Although the long-term record of productivity growth in the U.S. economy is excellent, productivity growth varies significantly over time. Output per worker grew about 2.6% per year from 1949 to 1973, but only 1.1% per year from 1973 to 1995. More recently, from 1995 to 2007, output per worker increased 1.9% per year, but grew only 1.3% per year from 2007 to 2021.
Because the rates of growth of output and, particularly, of output per worker ultimately determine whether a nation will be rich or poor, understanding what determines growth is one of the most important goals of macroeconomics. Unfortunately, explaining why economies grow is not easy. Why, for example, did resource-poor Japan and South Korea experience growth rates that transformed them in a generation or two from war-torn nations into industrial powers, whereas several resource-rich nations of Latin America, such as Venezuela, have had erratic or even negative growth in recent decades? Although macroeconomists have nothing close to a complete answer to the question of what determines rates of economic growth, they do have some ideas to offer.
For example, as we discuss in some detail in this book, most macroeconomists believe that rates of saving and investment are important for growth. Another key determinant of growth we discuss is the rate at which technological change and other factors help increase the productivity of machines and workers.FIGUREJ.2
Average labor productivity in the United States, 1900-2021
Average labor productivity (output per employed worker) has risen over time, with a peak during World War II reflecting increased wartime production. Productivity growth was particularly strong in the 1950s and 1960s, slowed in the 1970s, and picked up again in the mid-1990s. For the calculation of productivity, output is measured as in Fig. 1.1. Sources: Employment in thousands of workers 14 and older for 1900-1947 from Historical Statistics of the United States, Colonial Times to 1970, p. 126; workers 16 and older for 1948 onward from FRED database, Federal Reserve Bank of St. Louis, fred.stlouisfed.org/series/ CE16OV. Average labor productivity is output divided by employment, where output is from Fig. 1.1.
Business Cycles
If you look at the history of U.S. output in Fig. 1.1, you will notice that the growth of output isn't always smooth but has hills and valleys. Most striking is the period between 1929 and 1945, which spans the Great Depression and World War II. During the 1929-1933 economic collapse that marked the first major phase of the Great Depression, the output of the U.S. economy fell by nearly 30%. Over the period 1939-1944, as the United States entered World War II and expanded production of armaments, output nearly doubled. No fluctuations in U.S. output since 1945 have been as severe as those of the 1929-1945 period. However, during the postwar era there have been periods of unusually rapid economic growth, such as during the 1960s and 1990s, and times during which output actually declined from one year to the next, as in 1973-1975, 1981-1982, 1990-1991, 2007-2009, and 2020.
Macroeconomists use the term business cycle to describe short-run, but sometimes sharp, contractions and expansions in economic activity.[2] The downward phase of a business cycle, during which national output may be falling or perhaps growing only very slowly, is called a recession. Even when they are relatively mild, recessions mean hard economic times for many people. Recessions are also a major political concern because almost every politician wants to be reelected and the chances of reelection are better if the nation's economy is expanding rather than contracting. Macroeconomists put a lot of effort into trying to figure out what causes business cycles and deciding what can or should be done about them. In this book, we describe a variety of features of business cycles, compare alternative explanations for cyclical fluctuations, and evaluate the policy options that are available for affecting the course of the cycle.
FIGUREJ.3
The U.S. unemployment rate, 1890-2021
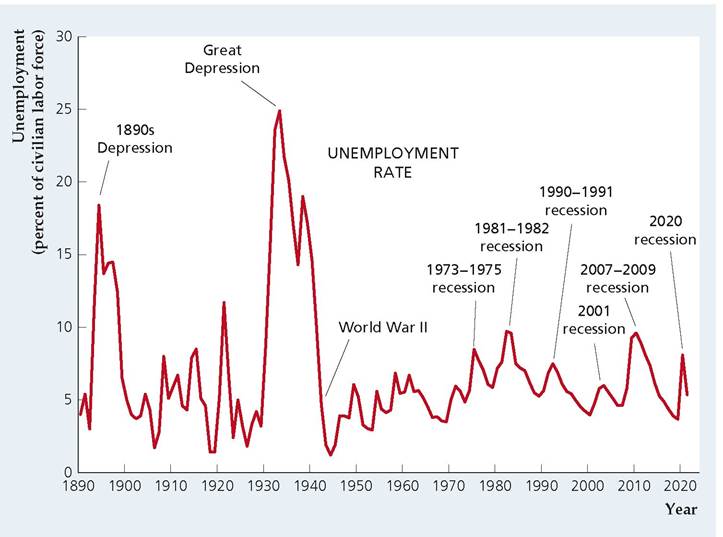
The figure shows the percentage of the civilian labor force (excluding people in the military) that was unemployed in each year since 1890. Unemployment peaked during the depression of the 1890s and the Great Depression of the 1930s, and reached low points in 1920 and during World War II. Since World War II, the highest unemployment rates occurred during the 1981-1982, 2007-2009, and 2020 recessions.
Sources: Civilian unemployment rate (people aged 14 and older until 1947, aged 16 and older after 1947) for 1890-1947 from Historical Statistics of the United States, Colonial Times to 1970, p. 135; for 1948 onward from FRED database, Federal Reserve Bank of St. Louis, fred.stlouisfed.org/series/UNRATE.
Unemployment
One important aspect of recessions is that they usually are accompanied by an increase in unemployment, or the number of people who are available for work and are actively seeking work but cannot find jobs. Along with growth and business cycles, the problem of unemployment is a third major issue in macroeconomics.
The best-known measure of unemployment is the unemployment rate, which is the number of unemployed divided by the total labor force (the number of people either working or seeking work). Figure 1.3 shows the unemployment rate in the United States over the past century and a quarter. The highest and most prolonged period of unemployment occurred during the Great Depression of the 1930s. In 1933, the unemployment rate was 24.9%, indicating that about one of every four potential workers was unable to find a job. In contrast, the tremendous increase in economic activity that occurred during World War II significantly reduced unemployment. In 1944, at the peak of the wartime boom, the unemployment rate was 1.2%.
Recessions have led to significant increases in unemployment in the postwar period. For example, during the 1981-1982 recession the U.S. unemployment rate reached 10.8%, during the 2007-2009 recession it rose to 10.0%, and during the 2020 pandemic recession it reached 14.7%.[3] Even during periods of economic expansion, however, the unemployment rate remains well above zero, as you can see from Fig. 1.3. In February 2020, after more than 10 years of economic growth with no recession, the unemployment rate was still about 3.5% Why the unemployment rate can remain fairly high even when the economy as a whole is doing well is another important question in macroeconomics.
FIGUREJ.4
Consumer prices in the United States, 1800-2021
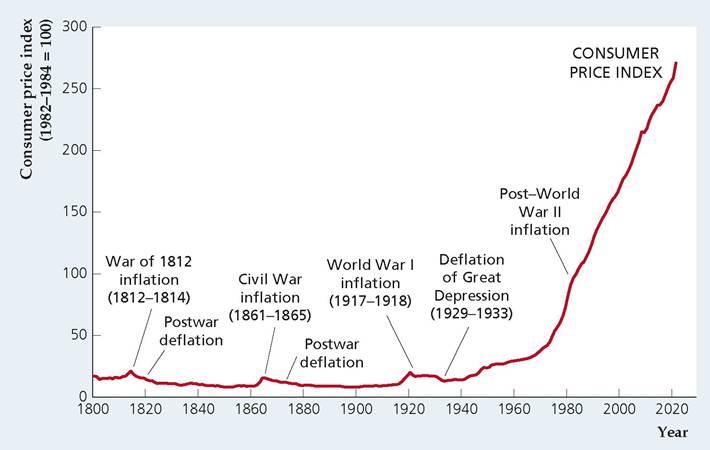
Prior to World War II, the average level of prices faced by consumers remained relatively flat, with periods of inflation (rising prices) offset by periods of deflation (falling prices). Since World War II, however, prices have risen more than tenfold. In the figure, the average level of prices is measured by the consumer price index, or CPI (see Chapter 2). The CPI measures the cost of a fixed set, or basket, of consumer goods and services relative to the cost of the same goods and services in a base period—in this case, 1982-1984. Thus a CPI of 271 in 2021 means that a basket of consumer goods and services that cost $100 in 1982-1984 would cost $271 in 2021.
Sources: Consumer price index, 1800-1946 (1967 = 100) from Historical Statistics of the United States, Colonial Times to 1970, pp. 210-211; 1947 onward (1982-1984 = 100) from FRED database, Federal Reserve Bank of St. Louis, fred.stlouisfed.org/series/CPIAUCSL. Data prior to 1947 were rescaled to a base with 1982-1984 = 100.
Inflation
When the prices of most goods and services are rising over time, the economy is said to be experiencing inflation. Figure 1.4 shows a measure of the average level of prices faced by consumers in the United States over the past two centuries.[4] Note that prior to World War II inflation usually occurred only during wartime, such as during the War of 1812, the Civil War, and World War I. These wartime periods of inflation were followed by periods of deflation, during which the prices of most goods and services fell. The result of these offsetting periods of inflation and deflation was that, over the long run, the level of prices was fairly constant. For example, prices at the end of World War I (1918) stood at about the same level as in 1800, more than a century earlier.
The last significant deflation in the United States occurred during 1929-1933, the initial phase of the Great Depression. Since then, inflation, without offsetting deflation, has become the normal state of affairs, although inflation was fairly low in the 1990s and 2000s. Figure 1.4 shows that consumer prices have risen significantly since World War II, with the measure of prices shown increasing tenfold.
The percentage increase in the average level of prices over some period, often a year, is called the inflation rate. If the inflation rate in consumer prices is 10% per year, for example, then on average the prices of items that consumers buy are rising by 10% per year. Rates of inflation may vary dramatically both over time and by country, from 1 or 2% per year in low-inflation countries (such as Switzerland) to 1000% per year or more in countries (such as a number of the former Soviet republics in the early 1990s; like Turkmenistan, Kazakhstan, Georgia, and Krygyzstan) that are experiencing hyperinflations, or extreme inflations. When the inflation rate reaches an extremely high level, with prices changing daily or hourly, the economy tends to function poorly. High inflation also means that the purchasing power of money erodes quickly. This situation forces people to scramble to spend their money almost as soon as they receive it.
The International Economy
Today every major economy is an open economy, or one that has extensive trading and financial relationships with other national economies. (In contrast, a closed economy doesn't interact economically with the rest of the world.) Macroeconomists study patterns of international trade and borrowing to understand better the links among national economies. For example, an important topic in macroeconomics is how international trade and borrowing relationships can help transmit business cycles from country to country.
Another issue for which international considerations are central is trade imbalances. Figure 1.5 shows the historical behavior of the imports and exports of goods and services by the United States. U.S. imports are goods and services produced abroad and purchased by people in the United States; U.S. exports are goods and services produced in the United States and sold to people in other countries. To give you a sense of the relative importance of international trade, Fig. 1.5 expresses exports and imports as percentages of total U.S. output. Currently, both exports and imports are larger fractions of U.S. output than they were during the 1950s and 1960s, reflecting both the recovery of trade from the disruptions of the Great Depression and World War II and the trend toward greater economic interdependence among nations. Note, though, that a century ago exports and imports already were important relative to the size of the overall economy.
FIGUREJ.5
U.S. exports and imports, 1869-2021 The figure shows U.S. exports (black) and U.S. imports (red), each expressed as a percentage of total output. Exports and imports need not be equal in each year: U.S. exports exceeded imports (shaded gray) during much of the twentieth century. During the 1980s, 1990s, and 2000s, however, U.S. exports were smaller than U.S. imports (shaded pink).
Sources: Imports and exports of goods and services: 1869-1959 from Historical Statistics of the United States, Colonial Times to 1970, pp. 864-865; 1960 onward from International Transactions Accounts, U.S. Bureau of Economic Analysis, I b'e'K.goVi'T.Llhieiin.dexilj.aiclm Table 1.1; nominal output: 1869-1928 from Christina D. Romer, “The Prewar Business Cycle Reconsidered: New Estimates of Gross National Product, 1869-1908,” Journal of Political Economy, 97, 1 (February 1989), pp. 22-23; 1929 onward from FRED database, fred.stlouisfed.org/ series/GDPA.
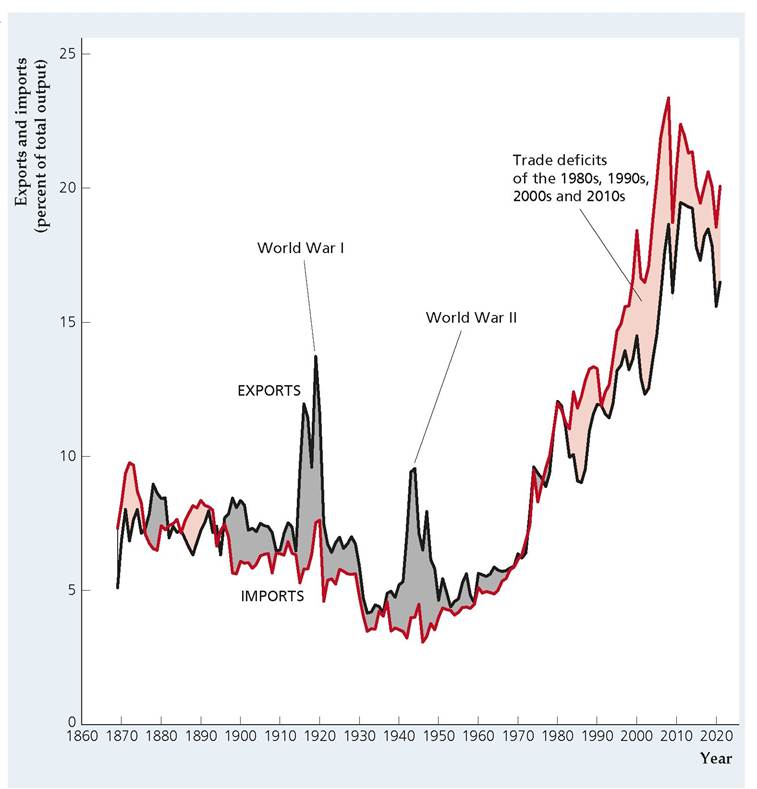
Figure 1.5 demonstrates that exports and imports need not be equal in each year. For example, following World War I and World War II, U.S. exports outstripped U.S. imports because the country was sending large quantities of supplies to countries whose economies had been damaged by war. When exports exceed imports, a trade surplus exists. In the 1980s, however, U.S. exports declined sharply relative to imports, a situation that has persisted through the 1990s, 2000s, and 2010s, as you can see from Fig. 1.5. This recent excess of imports over exports, or trade deficit, has received considerable attention from policymakers and the news media. What causes these trade imbalances? Are they bad for the U.S. economy or for the economies of this country's trading partners? These are among the questions that macroeconomists try to answer.
Macroeconomic Policy
A nation's economic performance depends on many factors, including its natural and human resources, its capital stock (buildings, machines, software, and intellectual property), its technology, and the economic choices made by its citizens, both individually and collectively. Another extremely important factor affecting economic performance is the set of macroeconomic policies pursued by the government.
Macroeconomic policies affect the performance of the economy as a whole. The two major types of macroeconomic policies are fiscal policy and monetary policy. Fiscal policy, which is determined at the national, state, and local levels, concerns government spending and taxation. Monetary policy determines the rate of growth of the nation's money supply and is under the control of a government institution known as the central bank. In the United States, the central bank is the Federal Reserve System, or the Fed.
One of the main macroeconomic policy issues of recent years in the United States has been in the realm of fiscal policy. Large Federal budget surpluses emerged in the late 1990s, but these gave way to large Federal budget deficits, averaging 2% of gross domestic product (GDP) from 2001 to 2008, and more than 8% of GDP from 2009 to 2011. The recent behavior of the Federal budget is put into a long-term perspective in Figure 1.6, which presents data on Federal government spending and tax revenues for the past 152 years.[5] Again, so that their
FIGUREJ.6
U.S. Federal government spending and tax collections, 1869-2021
U.S. Federal government spending (red) and U.S. Federal government tax collections (black) are shown as a percentage of total output. Deficits (excesses of spending over tax collections) are shaded pink, and surpluses (excesses of taxes over spending) are shaded gray. The government sector's share of the economy has grown since World War II. Large deficits occurred during the two world wars, the Great Depression, and during most of the period since the mid-1970s, except for 1998-2001, when the government ran large surpluses and during the pandemic recession of 2020.
Sources: Federal spending and receipts for 1869-1929 from Historical Statistics of the United States, Colonial Times to 1970, p. 1104; nominal output, 1869-1929: same as in Fig. 1.5; Federal spending and receipts as percentage of output, 1930-2017 from Historical Tables, Budget of the U.S. Government, Table 1.2, www.whitehouse.gov/omb/ historical-tables.
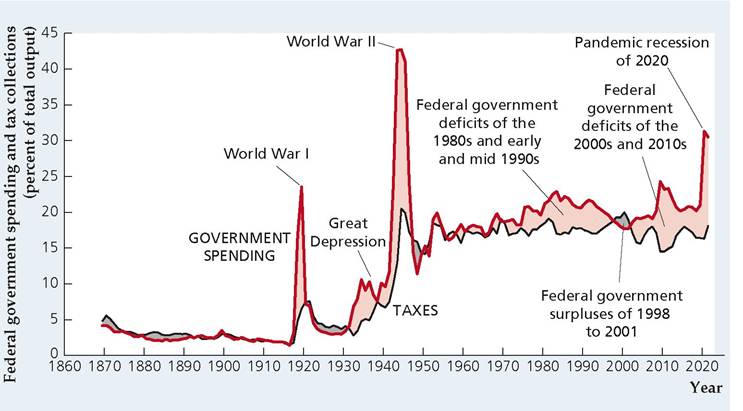
importance relative to the economy as a whole is indicated, spending, tax collections, and government budget deficits and surpluses are expressed as percentages of total output.
Two obvious features of Fig. 1.6 are the peaks in government spending and deficits that resulted from military buildups in World War I and World War II. At its high point during World War II, Federal government spending exceeded 43% of total output. Significant deficits also occurred during the Great Depression of the 1930s because the government increased its spending on various programs designed to help the economy, such as government-financed jobs programs. Also shown clearly is the increase in the size of the government sector since World War II, an increase reflected in the major upward shift in government spending and in tax collections relative to national output that occurred in about 1940 as well as the mild upward trend in both variables that has occurred since then. Figure 1.6 also illustrates the huge increase in the deficit in 2020, as the government sought to mitigate the impact of the pandemic recession.
The large and persistent Federal budget deficits of the 1980s and early and mid-1990s were historically unusual in that they occurred during a period of peace and relative prosperity. The emergence of large Federal deficits in the 1980s coincided with the emergence of large trade deficits (see Fig. 1.5). Indeed, the Federal budget deficit and the trade deficit have been called the "twin deficits." Are these deficits related? If so, what can be done about them? These questions also fall within the purview of macroeconomics.
The possible link between the government's budget deficit and the trade imbalance illustrates an important aspect of macroeconomics: Macroeconomic issues and problems are frequently interconnected. For this reason, studying one macroeconomic question, such as the effects of the government budget deficit, in isolation generally is not sufficient. Instead, macroeconomists usually study the economy as a complete system, recognizing that changes in one sector or market may affect the behavior of the entire economy.
Aggregation
Macroeconomics is one of two broad areas within the field of economics; the other is microeconomics. Macroeconomics and microeconomics have many basic economic ideas and methods in common; the difference between them is the level at which the economy is studied. Microeconomists focus on individual consumers, workers, and firms, each of which is too small to have an impact on the national economy. Macroeconomists ignore the fine distinctions among the many different kinds of goods, firms, and markets that exist in the economy and instead focus on national totals. For example, in their analyses macroeconomists do not care whether consumers are buying Microsoft Xboxes or Sony PlayStations, beef or chicken, Pepsi or Coke. Instead, they add consumer expenditures on all goods and services to get an overall total called aggregate consumption. The process of summing individual economic variables to obtain economy-wide totals is called aggregation. The use of aggregation and the emphasis on aggregate quantities such as aggregate consumption, aggregate investment, and aggregate output are the primary factors that distinguish macroeconomics from microeconomics.
1.2
More on the topic What Macroeconomics Is About:
- Conclusion
- Fligstein Neil. The Banks Did It: An Anatomy of the Financial Crisis. Harvard University Press,2021. — 334 p., 2021
- BACKGROUND AND DEFINITIONS