Did State-Owned Bank Behavior Really Change After 1998?
The old credit plan prescribed an essentially redistributive function for bank lending. This is in keeping with Park and Sehrt’s (2001) finding that the banks did indeed lend more to poorer provinces, ceteris paribus, during the pre-1998 period.
A more market-based approach, however, would almost certainly imply lending more to the stronger provinces. Park and Sehrt (2001) also find evidence that, again for the pre-1998 period, the SOCBs tended to allocate more funds to provinces where SOEs accounted for a larger share of provincial GDP. One way of addressing the question of whether overall loan allocation by the SOCBs did, in fact, change after the abolition of the national credit plan is to look at historical data on SOCB loan distributions. Table 7.3 divides China’s thirty-one provinces, municipalities, and administrative regions into top, middle, and bottom tiers according to each year’s per capita GDP of each region. The data suggest that loan allocation to the richest provinces remained relatively stable since 1994 for ABC and BOC, with ABC averaging close to 50% for this group and BOC near 65%. Meanwhile, ABC, not surprisingly given its rural base, continued to allocate the largest share of loans to the poorest provinces - typically providing more than 22% to this group.However, more obvious changes are evident in the cases of CCB and ICBC. Each of these banks evinces an increase in lending to the richest provinces, and a decrease in lending to the poorest provinces, over the sample period. This behavior may reflect more market-based lending after the loosening of the old quota allocation controls. CCB features the most pronounced change in behavior, with its loan allocation to the wealthiest regions rising from 45.9% in 1994 to 57.9% in 2005 while the allocation to the poorest regions fell from 24.9% to 19.1% over that same period.
Overall changes in lending patterns have remained quite mild, though, and the premise that SOCB lending may still not be in-line with the opportunities available in the richer regions is supported by Podpiera’s (2006) finding that the big four banks lost market share to other financial institutions in those provinces featuring more profitable SOEs.Another aspect of the 1998 reforms was a targeted maximum loan-to- deposit ratio of 0.75. The evolution of SOCB loan-to-deposit ratios shown in Figure 7.3 suggests that, while the ratio did decline for each of the SOCBs after 1998, this represents a continuation of a declining trend evident from the beginning of the data sample in 1994. Loan-to-deposit ratios do certainly converge to more similar levels by 2001, however, typically remaining within a 0.8 to 0.6 range from 2001 to 2005 - after ranging between 0.8 and 1.2 in 1994. ABC was the last to achieve the 0.75 target for its loan-to-deposit
Table 7.3. Loan Allocation of the Big Four State-Owned Banks
| ABC | 2005 | 2004 | 2003 | 2002 | 2001 | 2000 | 1999 | 1998 | 1997 | 1996 | 1995 | 1994 |
| High Tier | 52.3% | 52.4% | 52.2% | 52.8% | 50.9% | 50.2% | 48.2% | 47.2% | 53.4% | 49.1% | 47.5% | 47.3% |
| Mid Tier | 24.1% | 24.7% | 24.0% | 21.0% | 25.1% | 27.0% | 29.1% | 29.7% | 26.3% | 31.1% | 26.6% | 28.7% |
| Low Tier | 23.6% | 22.9% | 23.8% | 26.2% | 24.0% | 22.8% | 22.7% | 23.1% | 20.3% | 19.8% | 25.9% | 24.0% |
| BOC | 2005 | 2004 | 2003 | 2002 | 2001 | 2000 | 1999 | 1998 | 1997 | 1996 | 1995 | 1994 |
| High Tier | — | 66.5% | 64.3% | 64.2% | 64.8% | 67.4% | 62.8% | 63.0% | 63.0% | 63.0% | 63.8% | 62.2% |
| Mid Tier | - | 19.5% | 21.2% | 20.8% | 18.8% | 20.6% | 23.3% | 23.3% | 23.2% | 23.3% | 20.2% | 22.2% |
| Low Tier | - | 14.0% | 14.5% | 15.0% | 16.4% | 12.1% | 13.9% | 13.7% | bgcolor=white>13.8%13.7% | 16.0% | 15.6% | |
| CCB | 2005 | 2004 | 2003 | 2002 | 2001 | 2000 | 1999 | 1998 | 1997 | 1996 | 1995 | 1994 |
| High Tier | 57.9% | 61.4% | 57.8% | 58.4% | 59.6% | 58.8% | 56.5% | 54.0% | 53.1% | 50.9% | 49.3% | 45.9% |
| Mid Tier | 23.0% | 21.0% | 21.4% | 21.8% | 20.4% | 22.5% | 23.9% | 26.3% | 26.8% | 29.7% | 25.9% | 29.2% |
| Low Tier | 19.1% | 17.5% | 20.8% | 19.8% | 20.0% | 18.7% | 19.6% | 19.8% | 20.0% | 19.4% | 24.8% | 24.9% |
| ICBC | 2005 | 2004 | 2003 | 2002 | 2001 | 2000 | 1999 | 1998 | 1997 | 1996 | 1995 | 1994 |
| High Tier | — | 57.8% | 58.1% | 56.3% | 57.9% | 57.6% | 54.9% | 54.0% | 53.8% | 51.9% | 51.9% | 47.7% |
| Mid Tier | - | 23.3% | 22.6% | 23.2% | 22.5% | 24.6% | 26.0% | 26.8% | 27.0% | 28.3% | 25.1% | 29.4% |
| Low Tier | - | 18.9% | 19.3% | 20.5% | 19.6% | 17.8% | 19.1% | 19.1% | 19.2% | 19.8% | 23.0% | 22.9% |
Notes: China’s thirty-one provinces, municipalities, and administrative regions are divided into three tiers according to their relative rankings based on each year’s provincial nominal per capita GDP.
Foreign currency loans and deposits are included from 2000 with the $US amounts converted into RMB using the 8.28 fixed exchange rate that applied through 2004.
The annual average exchange rate value was used for 2005.Source: Almanac of China's Finance and Banking, Beijing, 1995-2006.
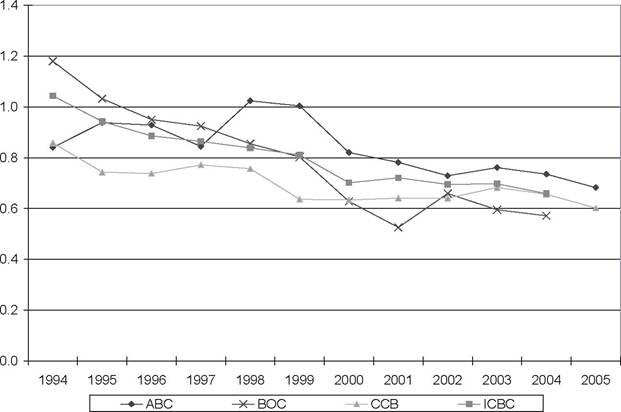
Figure 7.3. Loan-to-Deposit Ratios of the Big Four State-Owned Commercial Banks.
ratio, reaching this goal only in 2005, and also demonstrates the smallest change over the post-1994 period. Meanwhile, the most dramatic drop was enjoyed by BOC, with a halving of its loan-to-deposit ratio between 1994 and 2004. These data suggest that, even though changes in loan allocation across regions seem to have been more incremental in nature for most of the SOCBs, a meaningful change in total lending rates occurred since the mid-1990s and the ending of the credit plan. This result is consistent with Jia’s (2008) empirical findings that identify an improving trend in SOCB loan/asset and deposit/loan ratios over the 1994-2004 interval.
Burdekin and Tao (2007) offer some additional empirical evidence on the extent to which the overall decline in loan-to-deposit ratios over the 19942005 period may havebeen influenced by such factors as the concentration of SOEs and the level of provincial prosperity as well as the banks’ overall intake of deposits. This study allows for variations in bank behavior by province as well as over time. There is some support for CCB and ICBC being inclined to lend more to richer provinces over the sample period while lending by ABC and CCB may have become less redistributive over time. In ABC’s case, however, evidence of continued SOE lending implies that any evolution in bank business practices remained, at best, incomplete during the 1994-2005 sample period. Of the four banks, only CCB evinced declining sensitivity to the SOE variable over time.[120] The empirical results also suggested that higher levels of funds on deposit were associated with higher loan-to-deposit ratios and that the importance of deposits increased over time for two of the four SOCBs.
The apparent absence of more broad-based changes in SOCB behavior is itself qualified by the fact that the sample period largely predated the transition of three of the four SOCBs to joint-stock companies.Meanwhile, another unfortunate area ofconstancy after the 1998 reforms has been an ongoing, near-total exclusion of private sector borrowers from SOCB loans. Although private sector firms’ share of China’s gross domestic product had been above 30% since 2002, less than 2% of total short-term bank credits were allocated to private Chinese firms as recently as 2003 (Huang, 2006). At the same time, state-owned banks were still allocating 75% of their short-term loans to SOEs (Chiu and Lewis, 2006, p. 208). This unbalanced loan allocation had SOEs and collective enterprises still receiving nearly half of total corporate loans despite contributing little more than a quarter of GDP (Barth and Caprio, 2007). The benefits of such SOE funding are doubtful in light of the SOEs’ lower-than-average productivity (Dobson and Kashyap, 2006), in turn making it unsurprising that provinces with greater SOE shares in industrial production have, on average, consistently experienced lower growth rates in the past (Phillips and Kunrong, 2005). Meanwhile, private companies, especially those of small to medium size, often seem to have been shut out of the formal lending market altogether (Zhu, 2002) - forcing them to rely disproportionately on other financial channels such as trade credits (Ge and Qiu, 2007).
Besides trade credits, private entrepreneurs in China have utilized a wide variety of informal financing practices including “rotating credit associations, grassroots credit cooperatives, and even full-service yet unsanctioned private banks” (Tsai, 2002, p. 3). Althoughthecosts of such informal finance methods undoubtedly vary widely, curb market rates at triple the prevailing standard bank lending rate have been observed (Huang, 2006). In practice, self-financing and retained profits appear to have remained the chief source of finance for Chinese private enterprises, however (see Chiu and Lewis, 2006, pp.
213-214). Besides SOCB discrimination against private borrowers, another factor in the near-zero reliance on traditional bank loans could be a simple inability to meet the banks’ collateral and credit standards. Given the abysmally poor repayment record of many SOE borrowers, however, this latter explanation would, at best, smack of a double standard. On the other hand, it is possible that private entrepreneurs are reluctant to expose their businesses to official scrutiny owing to concerns about revealing information on the nature of the enterprise or its true level of earnings (Chiu and Lewis, 2006, pp. 216-218) - as well as possible exposure to informal levies, or even outright demands for bribes, by local government officials (Bai, Lu, and Tao, 2006, p. 617).Protection of private property was not even formally included in China’s constitution until 2004. Bai, Lu, and Tao (2006) conclude that, based on the results of a survey conducted in 2000, lack of formal protection of private property played a key role in limiting access to bank loans. Access to bank loans appeared to be significantly boosted by political participation and philanthropic activities, however, suggesting that political connections may well remain as important as ever in China. Another drawback for private borrowers has been the fact that banks had only very limited scope for charging higher interest rates to less established borrowers, giving them little incentive to give smaller enterprises, whether private or public, a chance to borrow funds. In this respect, the greater freedoms offered to banks under the 2004 interest rate liberalization measures seem to have had some initial positive effects, giving rise to “a new and growing ‘fat tail’ of smaller corporate customers” (Anderson, 2006a, p. 245). Lending to small companies by China’s top ten listed banks reportedly expanded by 15% in 2006, and even larger increases of 26% and 72% were seen for CCB and ICBC, respectively.[121] Still, rightly or wrongly, the perception that the SOCBs are simply not interested in private borrowers may be hard to shake off. Consider, for example, the views rather forcefully expressed by a Chinese business owner surveyed by Tsai (2002, p. 2):
A state bank wouldn’t give me a loan if Chairman Mao himself rose from the dead and told them to give me one!