Overview of the Banking Landscape
After the People’s Bank’s responsibility for lending to state-owned enterprises was transferred to the newly formed Industrial and Commercial Bank of China (ICBC) in 1984, it gradually moved to exercise monetary control through such Western mechanisms as setting reserve requirements and managing credit funds (Chapter 4).
Newly separated specialized state- owned commercial banks began directing lending activities in their particular sphere of influence - with ICBC, the China Construction Bank (CCB), and the Agricultural Bank of China (ABC) handling domestic transactions, and the Bank of China (BOC) specializing in international transactions. Commercialization of the big four state-owned commercial banks (SOCBs) was fostered by the creation of three new policy banks in 1994: the State Development Bank of China, the Import-Export Bank of China, and the Agricultural Development Bank of China. Policy loans were transferred to these new institutions while the big four banks now became accountable for their own profits and losses.[106]A growing number of joint-stock commercial banks have also been established subject to People’s Bank approval, with majority government ownership. Beginning with the Shenzhen Development Bank in 1991, minority share holdings of the joint-stock banks have been listed on Chinese stock exchanges (Fu and Heffernan, 2007, p. 37). They were allowed to expand nationwide in 1993. The largest such institution, the Bank of Communications, enjoyed a very successful initial public offering (IPO) on the Hong Kong Stock Exchange on June 23, 2005. The Bank of Communications was subsequently reclassified as a “large state-owned bank” in April 2007 - although, despite rapid growth, it remained at only approximately one-quarter the size of the others in terms of total assets (see Tucker and Anderlini, 2007). The following analysis is focused primarily on the largest, original four SOCBs for which longer, more consistent data series are available.
The big four SOCBs still accounted for more than half of total assets in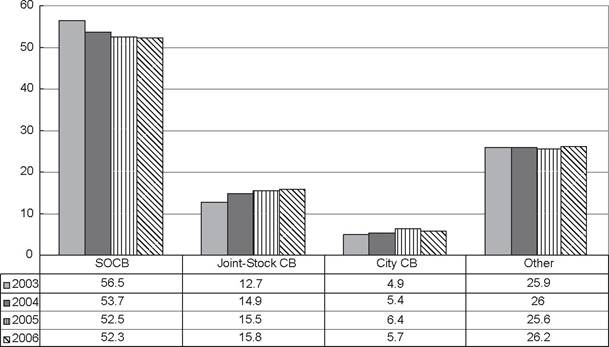
Figure 7.1. Average Share of Total Industry Assets by Type of Commercial Bank, 20032006. Source: China Banking Regulatory Commission (CBRC website).
China’s banking system during 2006, albeit with a 52.3% share compared to 56.5% in 2003 (Figure 7.1). The joint-stock banks and city commercial banks each registered gains in recentyears, reaching 15.8% and 5.7% oftotal assets, respectively, in 2006. The SOCBs’ share of total new loans issued did drop below 50% by 2005, however, with an overall share of 47%, compared to 23% for the joint-stock banks (including Bank of Communications). Rural credit cooperatives, city commercial banks, and three policy banks account for most remaining loan issuance (Figure 7.2).
Among the four main SOCBs, ICBC stands out as the biggest of the big, with over 30% of total SOCB assets, deposits, and loans at year-end 2005 (Table 7.1). The other three SOCBs were of approximately equivalent size in terms of assets and deposits but ABC had a proportionately larger share of loans (26.2%) and also considerably more branches than even ICBC. As discussed in more detail later, in 2007 ABC was the only SOCB yet to undergo restructuring and the only one not to be publicly listed. It stood in need of a substantial injection of funds before being a viable candidate for an IPO. Until quite recently, however, the other three SOCBs shared ABC’s ongoing weak balance sheet and large percentage of nonperforming loans (NPLs). This situation stemmed from their common history of supporting China’s largely loss-making state enterprise sector. Only in the second half of the 1990s did the government at last take steps to address the losses in the state enterprise sector, issuing $32.5 billion in bonds in 1998 to help
Table 7.1. Relative Size of the Big Four State-Owned Banks, as of December 31, 2005
| Bank | Assets | Deposits | Loans | Approximate Number of Branches | ||||
| Billions of Yuan | Percent of Total | Billions of Yuan | Percent of Total | |||||
| Billions of Yuan | Percent of Total | |||||||
| Agricultural Bank of | 4,771.0 | 23.3 | 4,036.9 | 23.2 | 2,829.3 | 26.2 | 28,234 | |
| China (ABC) Bank of China | 4,742.8 | 23.2 | 3,703.8 | 21.3 | 2,235.0 | 20.7 | 11,618 | |
| (BOC) China Construction | 4,585.7 | 22.4 | 4,006.0 | 23.0 | 2,458.4 | 22.7 | 14,250 | |
| Bank (CCB) Industrial and | 6,373.8 | 31.1 | 5,660.5 | 32.5 | 3,289.6 | 30.4 | 18,870 | |
| Commercial Bank of China (ICBC) TOTALS | 20,473.3 | 100.0 | 17,407.2 | 100.0 | 10,812.3 | 100.0 | 72,972 | |
Note: Loans are stated before allowance for impairment losses.
Source: Dobson and Kashyap (2006, p. 108); author's calculations.
recapitalize the four big SOCBs. The government also indicated that market discipline would begin playing at least a tentative role in the banking system. For the first time, a regional commercial bank, Hainan Development Bank, was closed by the People's Bank in June 1998 following a payments crisis.
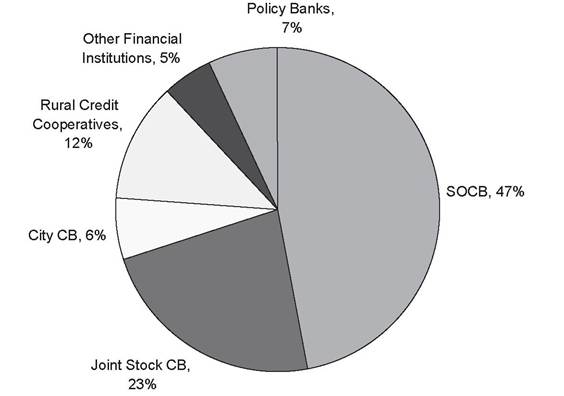
Figure 7.2. State-Owned Commercial Banks’ Share of New Loans Issued in 2005. Source: People's Bank of China.
Table 7.2. Nonperforming Loan Levels of the Big Four State-Owned Banks
| NPL% | 2005 | 2004 | 2003 | 2002 | 2001 | 2000 |
| BOC | 4.6 | 5.1 | 15.9 | 22.4 | 27.5 | 26.5 |
| CCB | 3.8 | 3.7 | 9.1 | 15.4 | 19.4 | 19.9 |
| ICBC | 4.7 | 19.1 | 21.3 | 25.5 | 29.8 | 34.4 |
| ABC | 26.3 | 26.8 | 30.7 | 36.7 | 41.4 | |
| SOCB aggregate | 10.5 | 15.6 | 17.8 | 23.1 | 25.4 |
Note: The NPL figures reflect the five-level reporting standard adopted in 1998.
Source: 2001-2005 data are as listed in Barth and Caprio (2007, p. 43) and the China Banking Regulatory Commission website (http://www.cbrc.gov.cn); 2000 figures are Bankscope data given by Garcia-Herrero, Gavila, and Santabarbara (2006, p. 350).
However, full repayment of foreign creditors and domestic depositors was guaranteed by the national government (Guo, 2004, p. 282).
The earlier financial weakness of the state enterprises has been well documented by Lardy (1998). Forced lending to these enterprises caused non- recoverable loans to continually build up on bank balance sheets, with vast levels remaining even after the 1998 bailout. To address this problem, a system of asset management companies (AMCs) was set up to absorb the SOCBs' NPLs and then package these loans for sale on the market. In this respect, their function was rather like that of the Resolution Trust Corporation, set up in 1989 to sell off the assets of defunct US savings and loan institutions, and continuing its operations until 1995. China's first AMC, China Cinda, was founded in Beijing on April 20, 1999, and three more AMCs were established later in the year. The system of AMCs had the twin goals of strengthening the banks' balance sheets while also reducing the state enterprises' debt burden. New oversight came fromthe China Banking Regulatory Commission (CBRC) in 2003. The AMCs disposed of an aggregate RMB 866.3 billion in nonperforming loans through the first quarter of 2006 - with an overall cash recovery rate of 20.8% (http://www.cbrc.gov.cn).
When consistent series on SOCB NPL ratios first became available in 2000, the lowest ratio was 19.9% for CCB - whereas BOC and ICBC reported 26.5% and 34.4%, respectively (see Table 7.2). The first available number for ABC, as of 2001, showed a 41.4% NPL ratio. All four banks fell well below the international capital adequacy standard of 8%. Each bank reported profit increases and lower NPL ratios from 2002 onward, however - with the reported aggregate NPL ratio down to just 8.20% of total loans as of March 31, 2007 - but the bulk of these improvements were achieved only after additional large government bailouts in 2003 and 2005.
Moreover, external NPL estimates typically remain much higher than the official CBRC figures. For example, Setser (2006, p. 384) suggests that, for China’s banking system as a whole, NPLs may have reached $US 470 billion in 2006 - representing 16.6% of all loans and 17.7% of China’s GDP. There have also been fears that recent high lending rates, spurred in part by the liquidity-enhancing reserve inflows discussed in Chapter 4, may have given rise to further new NPL growth. If just 15% of the loans issued during the post-2002 lending boom ended up going bad, which would be considerably lower than the historical percentage under past lending booms,[107] this would suggest additional NPLs amounting to around 8% of China’s GDP (Setser, 2006).A key milestone and challenge for China’s banking system was the provision for foreign banks being able to compete directly with domestic banks under the terms of China’s WTO membership. Although China joined the WTO in December 2001, the WTO granted China a five-year “buffer period” ending in December 2006, prior to which foreign entry remained limited. The scope for foreign banks serving as an alternative source of capital for China’s growing private sector was consequently delayed. Yet foreign financial institutions were allowed to purchase minority stakes in local banks even prior to China’s December 2001 membership, beginning with smaller institutions but extending in 2005-2006 to the SOCBs themselves. Interest rate liberalization is being implemented (even though banks initially seemed to make relatively little use of the recent freedom to charge higher rates to weaker borrowers according to Podpiera, 2006) as the authorities seek to transition away from the old situation where deposit and loan rates were simply set by the People’s Bank. Although it remains to be seen whether China’s large state banks can successfully prevail as internationally competitive, independent financial institutions, CCB’s 2005 IPO, and those of BOC and ICBC in 2006, were at first very well received.