The size of the bond markets
Bonds are the most significant financial instruments in the world today, with more than $90,000,000,000,000 ($90 trillion) in issue in 2013 - see Figure 1.1.[2] To put this number into perspective, the UK's annual output (gross domestic product, GDP) for one year is about £1.5 trillion.
Bonds come in all shapes and sizes, from UK government bonds to Chinese company bonds. Of this vast volume of $90 million million bonds[3] outstanding
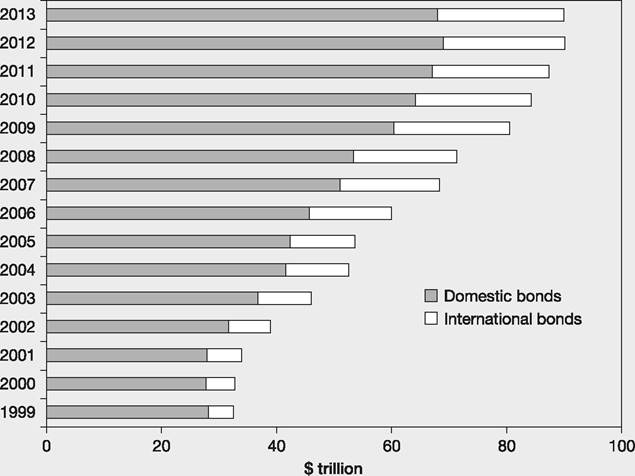
Figure 1.1 Amounts outstanding in the world bond market
Source: Data from the Bank for International Settlements
(not yet redeemed - the capital has not been repaid), about $70 trillion are issued in the domestic bond markets of countries, that is issued within the country in its currency by resident issuers, under the jurisdiction of the authorities there. In addition to these domestic bonds there are another $20 trillion of bonds issued outside the domestic markets on the international bond markets. These are issued outside the market where the borrower resides. These can either be outside the jurisdiction of the country in whose currency the bond is denominated - thus a bond denominated in pounds sterling but issued in Switzerland is outside of the control of London regulators and government (a Eurobond) - or issued by foreigners in a country's currency in and under the rules of that country (a foreign bond).
Most bonds are bought by investment institutions such as pension funds, insurance companies, etc. When bonds are bought and sold on the secondary markets between investors the returns in the market place can be quite volatile. See Figure 1.2 for US government bonds and US shares (stocks), which
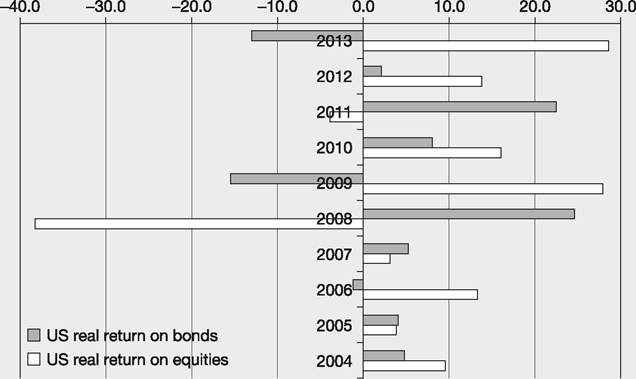
Figure 1.2 A comparison between real (inflation removed) annual returns on US government bonds and US equities (calculated by imagining that each year bonds or shares are bought on 1 January and sold on 31 December and taking into account both income (interest or dividends) and capital gains or losses over the year resulting from selling to another investor at the end of the year)
shows some large ups and downs over a ten-year period.
As we saw in the example of the 5% coupon bond, if the rates of return investors demand from bonds in the future rise, then the price of the bond can fall, sometimes dramatically as in the case of 2013. Thus there are years when bond prices fall by a larger percentage than the percentage coupon rate, resulting in an overall negative return for the year for an investor who buys at the beginning of the year and sells at the end.It might be difficult to discern from this figure, with it being only for a ten-year period and one subject to a severe shock in 2008, that it is generally the case that bond returns are less volatile than share returns. This is better illustrated in Figure 1.3, which shows the returns on UK government bonds (gilts) over each of the years from 1900 to 2013. These are not interest rates that the government paid, rather they are the combination of the cash coupon received
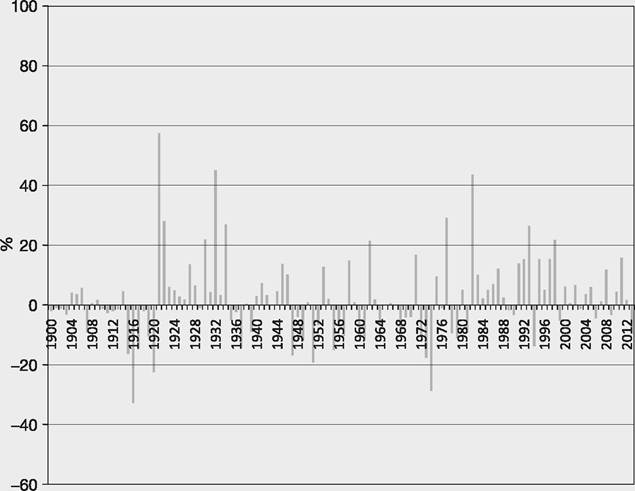
Figure 1.3 UK annual real gilt returns 1900-2013, percentage (real means after excluding inflation)
as a percentage of the secondary market price at the start of the year, plus the capital gain or loss in the secondary market over 365 days for bonds with 15 or 20 years to run before the government redeems them.
Note that there are many years where the return was negative. However, a comparison with the equity markets' returns shows that government bond returns were far less volatile than equity returns - see Figure 1.4. Shares quite often show annual returns up and down more than 15%; bonds show this relatively infrequently.
Governments issue bonds to finance the gap between what they raise in taxes and what they spend. Bonds from strong nations, such as the UK, the USA or Germany, are considered (almost) risk free with regard to the likelihood of the issuer not paying coupons and/or the principal, or breaching some other condition in the agreement, i.e. default risk, and so give relatively low rates of return because of their small risk factor. If a country is in economic trouble, with high levels of borrowing, investors may become nervous that they will
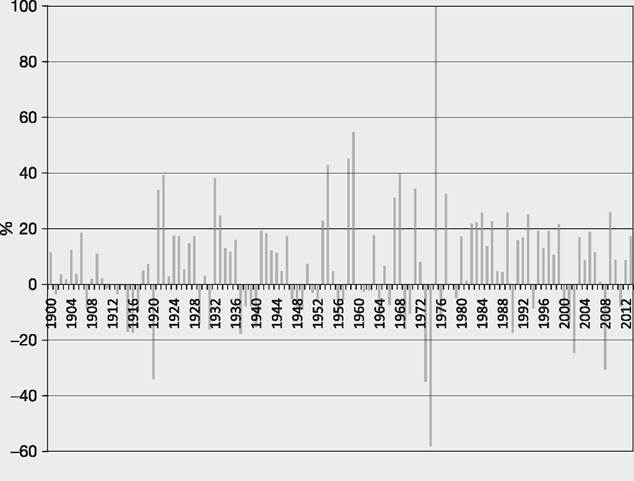
Figure 1.4 UK annual real equity returns 1900-2013, percentage
Source: Data from Barclays Equity Gilt Study 2014
not receive their coupon payments and the return of the principal, and therefore be less willing to hold these bonds unless they offer higher interest rates. This happened to Greece, Spain, Portugal and Ireland in 2011, causing their bonds to be deemed a riskier investment and investors to require higher rates of interest to invest in them.