NATURE OF MEASUREMENT
The essence of psychological assessment lies in the construction of the instruments used to explore various concepts of adjustment, personality functioning, behavior, and cognition.
This construction always has at its core the notion of standardization through its reference to a norm group, whose performance is characterized by a transformation of the raw score earned by an individual. Even the most skilled observer could not provide the richness of the information gleaned from a psychometrically sound test. Such a test allows for the comparison of that subject to the typical performance of his or her peers in a fair and objective way. The value of standardized assessment depends on some core concepts, elucidated in the following sections.Norm-Referenced Measurement
Norm-referenced tests are standardized on a clearly defined group, referred to as the norm group, and scaled so that each individual score reflects a rank within the norm group. The examinee’s performance is compared to the group, generally a sample that represents the child population of the United States. The comparison is carried out by converting the raw score into some relative measure. These are derived scores and indicate the standing of a patient relative to the norm group. These scores also allow for comparison of the child’s performance on different tests. Stanines, standard scores, age- and grade-equivalent scores, and percentile ranks are the most common tests.
A central concept in the expression of individual performance as compared to a norm group is the normal curve. The normal curve (Fig 3.1) is a bell-shaped curve. It represents the distribution of many psychological traits, with the greatest proportion at the “middle” of the curve, where it is the largest, and the abnormal levels—both below- and above-average—at the two “tails.” All derived scores have a distinct placement on the normal curve and are varying expressions of the location of an individual’s performance on that curve.
Stanines are expressed as whole numbers from 1 to 9. The mean is 5, with a standard deviation of 2. Substandard performance would be judged with sta- nines in the range of 1-3 and above average at 7-9. In this transformation, the shape of the original distribution of raw scores is changed into the normal curve.
Standard scores are generally the preferred derived score (15). Their transformation of raw scores yields a mean for the normative group and a standard deviation. This places a given score across the normal curve, and the scores express the distance from the mean of that patient’s performance.
T scores, z scores, and the well-known IQ of the Wechsler scales are all standard scores. Like all standard scores, the z score derives a constant mean and standard deviation across all age ranges The z score has a mean of 0 and a standard deviation of 1. It expresses below-normal performances with the minus sign and above-average with the plus sign, with scores in a range of -3 to +3. These scores are often transformed into other standard scores to eliminate the positive and negative signs (see Figure 3.1). T scores and the IQ scores are drawn from the z score, with different numerical rubrics that eliminate the plus or minus sign associated with z score.
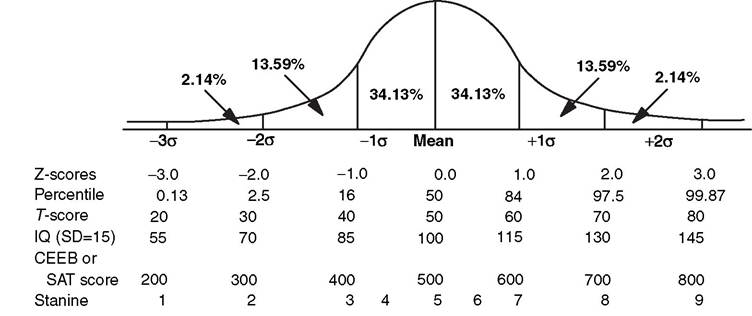
Figure 3.1 The Normal Curve.
Multiplying by 10 and adding a constant of 50 yields a T score ranging from 20 to 80, with an average of 50. Another transformation occurs by multiplying the standard score by 15 and adding 100. This provides a range from 55 to 145, with a mean of 100 and a standard deviation of 15 or 16, depending on the test used. This is the method that produces the Deviation IQ, the form of derived score used on the Wechsler intelligence batteries. The alternative to the Deviation IQ is the Ratio IQ, which is the ratio of mental age to chronological age multiplied by 100, used in the Stanford-Binet tests.
The statistical properties of this are poor, and it is not generally used or well regarded.What appear more understandable, but are not as psychometrically sound as standard scores, are percentile ranks and age- and grade-equivalent scores. Percentile ranks offer easy interpretation, with the rank reflecting the point in a distribution at or below which the scores of a given percentage of individuals fall. To a lay audience, this is often confused with percentages, which are not referenced to a normative population—only to the number correct compared to the total number of items. For example, function at the 50th percentile is average performance, whereas a grade of 50% on a test would be considered failing.
Even more straightforward appeal exists for age- and grade-equivalent scores. These scores are obtained by discerning the average raw score performance on a test for children of a given age or grade level. The individual patient's score on that test is compared to that value. Grade equivalencies are expressed as tenths of a grade (for example, a grade equivalency of 4.1 represents the beginning of fourth grade). Despite their appeal, there are limitations with these forms of derived scores. First, a grade-equivalency value does not mean that a child is performing at that particular level within his or her own school, as the curricular expectations of the school might be different from the mean score established by the normative sample. Some actual age- or grade-equivalency values might not have been earned by any specific member of a normative sample, but instead are extrapolated or interpolated from other points of data. Furthermore, age or grade equivalencies may not be comparable across different tests. The meaning of a first grader who obtains a raw score similar to a third grader is not that the child is functioning as a third grader in that subject. He or she shares that score, but the assumption that the child in first grade has all the skills of a third grader is inappropriate.
Similarly, a 12-year-old patient who achieves an age equivalency score of 8 years, 4 months seldom actually functioned on the test the way a typical 8-year-old child would, and certainly should not be treated like an 8-year-old for most issues in rehabilitation programming.Finally, as is the case with percentiles, age- and grade-equivalents cannot be used in statistical tests, as there is an unequal distribution of scores. Both require conversion to another scale before they can be used in data analysis.
Reliability
This concept of reliability refers to the ability of a test to yield stable (ie, reliable) results. There needs to be a consistency and stability of test scores, and the nonsystematic variation reduced as much as possible. Psychometric theory holds that any score is composed of the measurement of the actual trait that a child possesses as well as an error score, which represents the variation or error of measurement. The reliability coefficient is the conversant statistic to express this property. It can vary from 0.00, indicating no reliability, to 1.00, indicating perfect reliability. High-reliability coefficients are considered particularly important for tests used for individual assessment. In the case of cognitive and special ability tests, a reliability coefficient of 0.80 or higher is required for sufficient stability to be a useful test. Reliability coefficients are calculated for a test across three conditions. One is test-retest, meaning the capacity of the test to yield a similar score if given a second time to a child. Another is alternate-form reliability, where the child is tested with an alternate form of the test, measuring the same trait and in the same way as the initial testing. A third kind refers to internal stability in a test, where in the ideal test, item responses are compared to another item on the test to demonstrate the equivalence of items in measuring the construct in a replicable manner. Active judgments must be made in the choice of tests, with reliability coefficients reviewed in the process of test selection.
Validity
This is another vital consideration in the construction and use of standardized tests. Validity is the extent to which a test actually measures what it intends to measure and affects the appropriateness with which inferences can be made based on the test results. Validity of a given test is expressed as the degree of correlation, with external criteria generally accepted as an indication of the trait or characteristic.
Validity is discussed primarily in terms of content—whether test items represent the domain being measured as claimed—or criterion—the relationship between test scores and a particular criterion or outcome. The criterion may be concurrent, such as comparison of performance on neuropsychological test measures with neurophysiologic measures (eg, computer tomography, electroencephalography).
Alternatively, the criterion may be predictive—the extent to which test measures relate in a predictive fashion to a future criterion (eg, school achievement). In the rehabilitation context, various events and contingencies may affect predictive validity. An appropriate determinant of predictive validity is the likelihood that the individual’s test performance reasonably reflects performance for a considerable period of time after the test administration. Acute disruption in physical or emotional functioning could certainly interfere with intellectual efficiency, leading to nonrepresentative test results. In contrast, chronic conditions would be less likely to invalidate the child’s performance from a predictive standpoint because significant change in performance as a function of illness or impairment would not be expected over time. With therapeutic interventions, a patient’s performance could improve, so test results from prior to that would not be valid. The more time that passes between test administrations, the more likely extraneous factors can intervene and dilute prior predictive validity. Anxiety, motivation, rapport, physical and sensory handicaps, bilingualism, and educational deficiencies can all effect validity (15).
For an inpatient population, the effects of acute medical conditions (eg, pain, the stress of hospitalization, medical interventions themselves, fatigue) can also affect validity. Wendlend and colleagues (16) noted that in a study of cognitive status post-polymyelitis, the deficit seen could well have been due to the effect of hospitalization as opposed to the disease.Construct validity refers to the extent to which the test relates to relevant factors. Another important component of validity is ecological validity, which refers to the extent to which test scores predict actual functionality in real-world settings. Test scores are typically obtained under highly structured clinical testing situations, which include quiet conditions, few distractions, one-on-one guidance, explicit instructions, praise, redirection, and so on. These conditions do not represent typical everyday tasks or settings (17). This disconnect between the test setting and real life is especially relevant in children with brain-related illness or injury. These children, who have high rates of disordered executive functioning (eg, distraction control, organization, planning, self-monitoring, etc.) benefit disproportionately from the highly directive nature of clinical testing, and test scores may overestimate true functional capacity for everyday tasks (18).
A test’s reliability affects validity in that a test must yield reproducible results to be valid. However, as detailed previously, validity requires additional elements.
In the rehabilitation population, all of these issues have particular import. Most tests are developed on a physically healthy population. Motor and sensory handicaps and neurologic impairment are not within the normative samples. Issues of validity predominate here, though with transitory factors as noted previously, reliability can be affected as well. Standardized procedures may have to be modified to ensure that a patient is engaged in the testing in a meaningful way.