C Why PPV Is Higher with Hypothesis-Based Research
Surprisingly perhaps, despite the grim impression you get from the gene screen scenario, the PPV calculation strongly supports doing specific hypothesistesting research. To see why this is, let's look first at pre-study odds.
Ordinarily, experimental basic science builds on a great deal of prior information, which greatly reduces the number of realistic alternative hypotheses and dramatically increases the pre-study odds, T/(T + F). In my experience, an experimental neuroscience publication generally evaluates only one or two hypotheses; a report that compares as many as four would be unusual. The fewer the hypotheses, the stronger the argument. To be conservative here, let's assume that you've come up with four hypotheses that might explain the phenomenon you're studying and that you suspect that one of them is correct. Your pre-study odds are 1/4. Already, assuming that p-value and statistical power are the same as in the gene screen case, the odds of hitting on the right hypothesis are 250 times higher. This translates into a big improvement in PPV.The p-value influences PPV but, since p < 0.05 is conventional, we'll assume it is constant in this example (in a while, we'll see what happens if we change the p-value). What about the power of your statistical tests? Does the fact that it has often been lamentably low4 fatally undercut the advantages of the hypothesis? Actually, while low power does reduce PPV overall, the effect is minor when compared with the advantages gained by having a small number of alternative hypotheses. Even with a low statistical power of 0.2, a hypothesis-testing experiment that successfully ruled out 3 of 4 alternative hypotheses would have a PPV of approximately 0.57. That is, the probability that this hypothesisbased experiment would be reproducible is more than 40 times greater than the open-ended gene screen; we get a 4,000% improvement in PPV just by doing a directed, hypothesis-testing study that evaluates four alternative hypotheses, even if your tests have low statistical power! Improving the pre-study probability of reproducibility of your experimental results is the first quantitative benefit you get from using a hypothesis.
The statisticians would point out that, nevertheless, if your result has a PPV of 0.57, its odds of being reproduced are only slightly better than 50-50, a long way from the level of confidence we expect from science. Obviously, though true, this is not a fatal objection: first, going from abysmally low odds of reproducibility to a 50-50 chance is a giant step forward, despite leaving room for improvement.
Second, and more importantly, the conclusions of an experimental basic science project do not rest entirely on the outcome of a single p-valued test, even though much of the concern about scientific reliability arises directly from this erroneous assumption. As an example, recall that the Reproducibility Project teams that raised the alarm about the reliability of psychology studies (Chapter 7) selected one experimental test from each complex study to try to replicate.5 If that one study was not fully replicable the authors concluded the study was flawed. Similarly, loannidis explicitly posits that “the high rate of non-replication (lack of confirmation) of research discoveries is a consequence of the convenient, yet ill-founded strategy of claiming conclusive research findings solely on the basis of a single study assessed by formal statistical significance, typically for a p-value less than 0.05” [emphasis added].”6 And he explains that, “Research findings are defined here as any relationship reaching formal statistical significance.”
While there may be a kind of science that “claims conclusive findings” as a result of “a single study,” basic bioscientific research does not operate like that.
Instead of relying on a single p-valued test, bioscientists take the results of numerous experiments into account in drawing their conclusions.
8. C.1 How Multiple Tests of a Hypothesis Can Lead to Higher PPV
The principle that “an overall inference can be more reliable and precise than any of its premises individually” is what the philosopher/statistician Deborah Mayo calls “lift-off”7 For Mayo, lift-off is related to her “argument from coincidence,” which she illustrates with an example: wondering if she's going to gain weight during a trip abroad, she weighs herself on three separate, carefully calibrated scales before and after the trip.
When she's back, all three scales report similarly higher weights only for her, not her calibration standards. Since this procedure is surely capable of rejecting the null hypothesis that she didn't gain any weight, it constitutes a genuinely “severe” test, thus illustrating how she'll flesh out the definition of severity, which Popper failed to do. More importantly for us, however, is that her procedure illustrates the power of her “argument from coincidence.” Her procedure is especially convincing, she says, because it would be “preposterous” to assume that she'd get the results that she did because all three scales just happened to be off by similar amounts when she weighs herself. Therefore we believe the scales are right and reject the null hypothesis that she didn't gain weight.8Without saying so exactly, this is the same reasoning that scientists employ when they do multiple tests of a given hypothesis: if the conclusions from all the tests agree, then we mentally combine them when we interpret the validity of the hypothesis because it would be preposterous to think that they all just happened to agree. We reasonably expect conclusions based on multiple tests to be more reliable than those based on single tests.
Although this informal reasoning process is roughly correct, it is vague and doesn't convincingly counter the quantitative arguments of the statisticians. It would be helpful if we had an uncomplicated, formal method of combining the results of a cluster of experiments that test predictions of the same hypothesis. This method would give us an objective estimate of the probability of observing the group of results that we could use to test the hypothesis. Unfortunately, Mayo does not provide a way of calculating the odds of overall inferences of this kind, and it will take more than a judgment of “preposterousness” to satisfy scientific readers.
Fortunately, there are methods for combining results, and they could help solve our problem, although they haven't been used much for this purpose so far.
I'll devote the next section to describing one of these methods.8. C.2 Multiple Testing of Hypotheses: Fisher's Method for Combining Results
We want to calculate how having a collection of different experimental results, all bearing on a single hypothesis, alters our confidence in the conclusions relating to that hypothesis. I’ll start with a nonscientific example to give a better picture of what we need: Suppose a carnival has come to town and offers games of chance. You notice a shady-looking character who seems to be winning a lot, and you hypothesize that he is a shill—someone in league with the carnival owners. For a shill, the games are rigged in his favor, and he only appears to be a legitimate player: his job is to create the illusion that anybody can win and lure onlookers to play (and lose their money because, for them, the games are rigged the other way).
Your hypothesis predicts that the shady guy will win far more games than you’d expect from chance alone. You discretely follow him around and take notes. At one booth, a player has to roll a sequentially numbered 16-sided die and, if an 8 comes up, he wins. The suspect rolls and wins, but his chance of winning, 1/16, is not that unusual. He next tries a game where a player has to fish a green ball out of an opaque urn having 10 green balls scattered among 190 other balls of different colors. The suspect manages to pull out a green ball on his first try. Once again, the odds of that happening, 1/20, are not extremely small. Finally, the suspect goes to the magician’s booth. The magician puts a pea under one of five inverted cups, moves the cups around very quickly, and right away, the suspect correctly identifies the one hiding the pea. His chance of guessing correctly was 1 in 5. Is he part of a crooked scheme or an honest, though lucky, guy? He’s won every time, which certainly seems suspicious, and yet his chances of winning any single game were not particularly small; he could legitimately have won each of them.
On the other hand, he won all three. What are his chances of doing that by luck alone? You can find the odds of his string of successes by multiplying the probabilities of winning all three games: that is, ^(winning all three) = 1/16 x 1/ 20 x 1/5 = 1/1,600. His run had a chance of only 1 in 1,600 of occurring. It is not impossible for that to happen randomly, but your suspicion that he was a part of a scam looks as if it could be justified.A scientific hypothesis makes many independent predictions, and scientists test more than one to test their hypothesis. Ideally, we’d like to be able to combine the statistical results, the p-values from our tests, more or less the way we did at the carnival. For technical reasons,9,10 we can’t simply multiply the p- values from a group of, say, t-tests, together and come up with a global p-value for the probability of getting them all. However, we can effectively do the same thing with a method invented by R. A. Fisher: Fisher’s Method for Combining Probabilities.11
According to Fisher,12 “When a number of quite independent tests of significance have been made... the aggregate gives an impression that the probabilities are on the whole lower than would often have been obtained by chance. It is sometimes desired, taking account only of these probabilities,... to obtain a single test of the significance of the aggregate, based on the product of the probabilities individually observed.” This is exactly what we want to do.
Here is his formula:
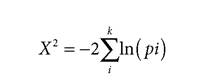
Although it might look daunting, it's not (its derivation is available, if you’re interested.)13 You begin by testing several independent predictions and get a p-value for each test, p. If you did k different tests, then you have k p-values. You take the natural logarithm (ln) of each p-value, add the logarithms together (the capital Greek letter Y, sigma, tells you to add what comes after it).
Finally, you multiply the sum by -2. The resulting value is a statistical construct called a chi-square variable, and to evaluate it you consult a chi-square table (they are available online or at the back of many statistics textbooks) with 2k degrees of freedom. I’ll go through an example shortly. There are some caveats,14,15 the most important being that your tests must be strictly independent—different methods, subjects, dataset, etc. If they are independent, then the number you get from the chi-square table tells you the probability that you’d get that value or a smaller one by chance alone.As was the case with the carnival games, the probability of getting a cluster (“aggregate”) of experimental results will generally be much lower than the probability of getting any single result. As usual, the smaller the probability, the less likely it is to be a random event, and the more confident you can be in the conclusion it supports. Fisher’s Method let’s you calculate a parameter which, although it is a chi-square variable, I’ll call “pFM” because it is like a p-value.
8. C.3 Example of Fisher’s Test to Combine Results
Assume that you’re a neuroscientist, and you have a hypothesis that a group of neurons in the mouse hypothalamus is inhibited by endogenous cannabinoids, which makes the mice more relaxed and less fearful (i.e., “mellower”). Your hypothesis predicts that endocannabinoid activation of cannabinoid receptors on these neurons is crucial for the mellowing response. You test four predictions of the hypothesis in four groups of mouse hypothalamic tissue samples: one group is from mice that were genetically engineered to lack the receptor, one group is
treated with a drug that activates the receptor, one group with a drug that inhibits the receptor, and one normal group in which you collect the fluid around the activated neurons to see if it contains endocannabinoids. Of course, you do all appropriate controls and use recommended group sizes.
The p-values for the four tests are 0.032, 0.042, 0.049, and 0.058. While the last test would be considered insignificant under the conventional, p < 0.05 standard, Fisher would approve of including all values because he felt that standards should not be rigid (Chapter 5), and, moreover, in the combined test individual, test results don't matter: we are only interested in the aggregate probability.
First, you take the logarithms of the p-values: -3.44, -3.17, -3.02, -2.85
Second, you add them together and get: -12.45
Third, you multiply by -2 and get: 24.9
This is your chi-squared value, and you evaluate it by consulting a chi-square table with 2k (i.e., 2 x 4 = 8) degrees of freedom.
The table tells you that the probability of this value is p < 0.005; that is, it is the probability of getting the group of p-values for your four independent tests, what I'm calling “pFM” This value is much lower than any individual p-value and implies that getting the whole collection of your results was very unlikely. You're entitled to feel that your hypothesis has been well-corroborated. The ability to take advantage of Fisher's Method to obtain this parameter, pFM, is the second quantitative benefit of using a hypothesis. But what, besides a greater sense of confidence, can we get from pFM? We can use it to improve our estimate of PPV, the future predictive value of the results.
8. C.4 Using the Significance Level from Fisher's Method to Reassess PPV
How does the p-value affect PPV? Let's assume that, instead of p < 0.05, we used p < 0.001 in the example of the 1,000-gene screen, and, since statistical power generally decreases as p-value decreases, let's also assume that power is only 0.25 rather than 0.5. In this case, PPV would increase from 0.01, which we calculated earlier, to 0.05; thus, decreasing the p-value increased PPV five-fold.
Once again, because you're a basic scientist who wants to assess the validity of your entire hypothesis, not merely the validity of any one test of a prediction, you should take into account the outcomes of all the experiments that you did to test it. It obviously doesn't make sense to use the p-value from a single test to calculate PPV for the overall hypothesis. You could, instead, use a combined estimate, such as pFM, in the PPV formula. Since pFM will generally be much lower than a typical p-value, then PPV will be higher for the hypothesis than for the single test, as we just saw in the gene screen example.
How will pFM affect PPV? For the four-part endo cannabinoid experiment discussed in the previous section, let's compare PPV calculated from one test with a conventional significance level of p < 0.05 and PPV calculated using the pFM that we calculated in the preceding section. Assuming you have four alternative hypotheses in mind, your pre-study odds are 1/4 = 0.25. We'll use the estimate from Button et al. that the average power of neuroscience experiments is only 0.2. With the p < 0.05 case:

(i.e., there is a 50% chance this single result would be reproducible) Using pFM from the aggregate of the four tests we get:
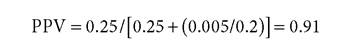
That is, the PPV of the study goes from a meager 50% chance of reproducibility to a very respectable 91% chance when the p-value equivalent goes down. Confidence in your overall conclusion appears to be on much firmer ground than it was when you assessed PPV from only one test. Getting a more realistic estimate of PPV is the third quantitative benefit you get from using the hypothesis.
In summary, use of the scientific hypothesis can enhance the statistical reliability of scientific results quantitatively in three ways. First, a research plan that is focused on testing only a small number of alternative hypotheses has much higher predictive validity (PPV) than less focused investigations because the pre-study odds are higher. Second, combining the results from testing multiple predictions of a single hypothesis with Fisher's Combined Method gives you a new measure of statistical significance, pFM, that will in general be lower, and hence less likely to be explained by random chance, than a single p-value. Third, you can use pFM to estimate a PPV for the hypothesis that will generally be higher than it will for p-valued tests of individual predictions.
8. C.5 Other Benefits of Fisher Method for Combining Results
Does the PPV calculation have practical utility for science or is it merely a tool for various forms of meta-analyses ? Could the Fisher Method have any impact on science more generally? I think that there several potential additional benefits of the combined method:
1. Decreased emphasis on the single “p-value” per se and a shift in attention to the overall study, its rationale, and design. Since only tests of predictions of one hypothesis can be included in the Fisher Method, authors would have to consider their arguments and analyses carefully.
2. Since the Fisher Method is not constrained to a specific “significance level” for any of the constituent tests (i.e., authors would include a result with p = 0.071 as readily as one with p = 0.011). This, too, would reduce inappropriate focus on p-values and thereby the decrease the incentive for selectively reporting only the most significant results.
3. The method would make it easier for others to evaluate an entire study and might even make it possible to compare and evaluate competing hypotheses that purport to explain a given phenomenon.
4. More broadly speaking, some of the theoretical benefits of a much lower p-value (e.g., p < 0.005) (we touched on this proposal in Chapter 5.E.2.d) could be had by using pFM obtained with Fisher's Method, while at the same time avoiding some of the pitfalls of switching to a much more stringent standard.
Taken together, these quantitative benefits constitute a strong argument in favor of hypothesis-based science. The hypothesis also offers numerous qualitative advantages as a thinking tool, and we'll review a few of these next.
8.