An android supply chain application system for automation order processing
M.T. Siregar & Z.P. Puar
Polytechnic APP Jakarta, Ministry of Industry, Jakarta, Indonesia
P. Leonard
Polytechnic STMI Jakarta, Ministry of Industry, Jakarta, Indonesia
ABSTRACT: The objectives of this research is to add value function to the application (software) which has been previously developed registered with copyright number HKI 2-01-000007457 in 2016.
The reason that this became the topic of this research is because nowadays, most industries want to utilize information systems for operating their business activities through easy-to-use application, and if possible connected to the smart phone. This research adopted the System Development Life Cycle (SDLC) method because it is necessary for developing this new application based on previous application which is web-based. The benefit of this application is that the application system has been developed into an android-based system, which is easier, simpler, and can be connected to the android electronic devices such as smart TV and smartphone. Therefore, companies can utilize this application for monitoring their daily business operation; the main functions of this application is for automation order processing. A feasibility survey is conducted with the 40 experienced respondents, in three categories of industries. The method for analysis was AHP (Analytical Hierarchy Process) method. The result of this survey found almost all industries are suitable to use this application, 30.7% in retail, 39.2% in manufacturing, and 30.1% in restaurant.1 INTRODUCTION
In the present global industrial era, the availability of stock of goods is one of the important factors for the industry to maintain the quality, quantity, and continuity of its production activities. However, the industry tends to need raw materials in fixed quantities, considering the industry has a strategic potential in the development of the nation’s industry.
Therefore, the industry must be supported by the procurement of raw materials in terms of time, place, form, quantity, and price. Thus, the availability of raw materials greatly determines the implementation of the production process optimally, so that the production plan can be realized.In the previous research, an integrated system is an interesting challenge in software development because its development must continue to refer to the consistency of the system, so that existing and operational sub-systems are still functioning properly as they integrate the system before and after the integration (Tam et al. 2017). Integrated system is a set of processes to connect multiple computerized systems and applications (software) both physically and functionally. The integrated system will incorporate sub-system components into one system and ensure the functions of the sub-system as a single system. A human-android interaction experiment shows that the integrated system provides relatively human-like interaction (Chikaraishi et al. 2008).
Based on the problems and opportunities existing for developing industrial supply chain applications, this research has objectives to develop current applications (software) to integrate with friendly operating systems, especially simple android operating system.
2 RESEARCH METHOD
This research is conducted through SDLC (System Development Life Cycle) technique with the application of industrial supply chain information system (No. HKI 2-01-000007457) that was previously developed, which will then be connected to the Android operation systems. The details are in Figure 1. Analysis was made by calculating the acceptance of this application using AHP (Analytical Hierarchy Process) method by using 40 respondents who are direct users of the goods/services ordering system. The research stage is shown in Figure 1 (Jogiyanto & Abdillah 2011).
2.1 Scope definition
In this study, the scope consists of the development of monitoring tools are integrated with industrial supply chain in information system of application.
2.2 Problem analysis
This study created problem-solving analysis that occurs in the industry andwhat causes the planning
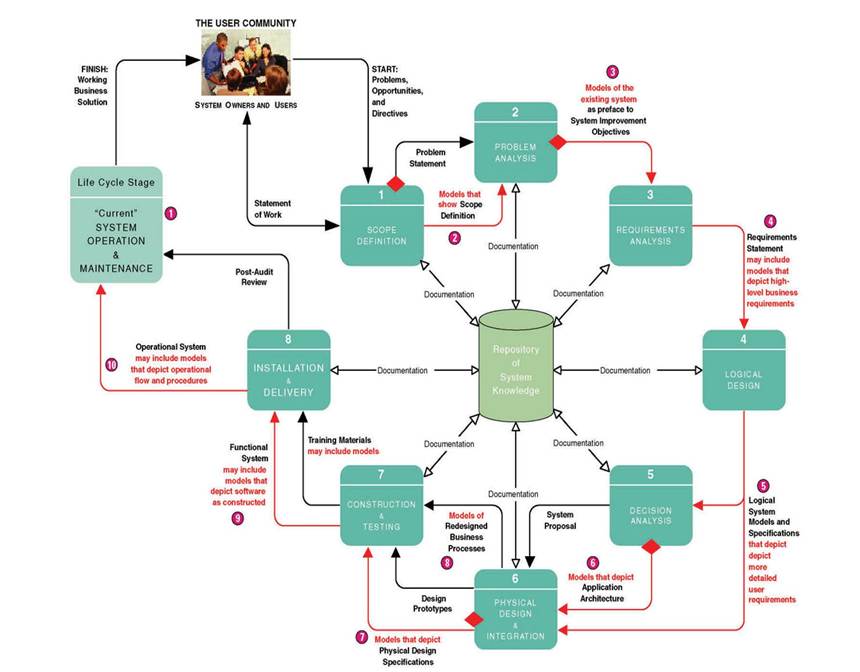
Figure 1. Research stages.
and control of raw materials which are often problematic in overcapacity.
2.3 Requirement analysis
After the problems have been described, then needs analysis was performed in information systems, where the application programming edit is needed to adjust the needs in solving the problem.
2.4 Logical design
The system has been designed and then adjusted to the specification of the equipment that will be connected into the application equipment used in this research which include a smart TV and a smart phone.
2.5 Decision analysis
The result of designing a device specification with an ERP application wasconnected to an integrated system so that data entered into the system will appear in the planned monitoring tool as the output of digital numbers.
2.6 Physical design and integration
The monitoring tools are designed so to connect the application of supply chain information system with display equipment, which are smart TV and smart phone, so that the equipment can work with computer. The display equipment created is a digital system as in Figure 2 (Bin-Abbas & Bakry 2014).
After the programming is appropriate to the system, then it is connected with android studio applications to change the application function into the android smart phone. The android system connected to system circuits resulted in the application of the supply chain information system integrated automatically with the actual conditions on the android smart phone in real time (O’Brien & Mara- kas 2010).
2.7 Construction testing
Monitoring tools that have been connected with the application are then tested to see the level of accuracy of automation tools to the application. In this test, the result is expected to get 100% accuracy level (see Figure 3).
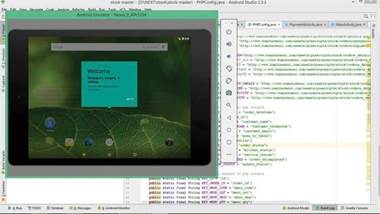
Figure 2. Design application connected to Android system.
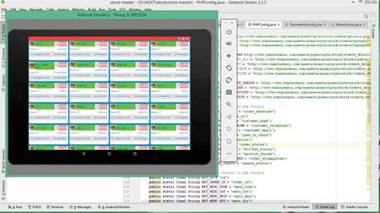
Figure 3. Application testing connected android system.
2.3 Installation and delivery
The results of the integrated tools trial will be checked in final phase to avoid errors and damage, and then formed into a more secure package, so that enterprise users can try the tool as a new tool for monitoring raw material needs. The AHP method is used to measure the acceptability of the monitoring tools regarding the suitability of the industry to utilize it. The results of the AHP calculation will then be used to analyze the feasibility of the monitoring system by comparison with conventional methods that have been used in the industry.
3 RESULTS AND DISCUSSION
This application is a repository for business applications that are integrated on Android smartphones to facilitate users when ordering goods from the warehouse. This application also makes it easy for the user, for example front-liner on the tenant-shop to simplify the work with the mobile device so that the front-liner can start placing orders, dynamically updating the goods without having to print new items, or the option to cancel reservations from consumers.
3.1 Main menu
Main Menu in this application consists of Dashboard menu, Transactions menu, and Settings menu. Dashboard menu contains the global information required by the manager such as recapitulation of transaction amount, amount of transaction volume in Rupiah, last order number, and others. The Transaction menu is used in the following sections:
• Waiter that contains the results of the activity of filling the order goods application on the Android app, which starts from:
a. Determine the number of places tenants to order goods
b. Ordering food items containing the results of transaction activity of goods order selection
• Cashier containing the order recapitulation result made by Waiter on behalf of a certain tenant before proceeding to Warehousing
• Warehousing contains warehouse layout tables and the following order in each warehouse number including the status of the order is being ordered, is being carried out the delivery process, or has finished the delivery process and continued by Waiter to deliver the order to tenant.
The Setting menu contains the number of tenants as well as the layout of the tenant number sequence and so on, which is possible from various floors. Administrators can set the layout on each floor. See Figure 4.
The Dashboard menu contains the global information required by the manager such as the recapitulation of the transaction amount, the amount of the transaction volume in Rupiah, the last order number, and others if necessary. To display this Dashboard stuff, the system performs the calculation of data based on the order data of goods entered by the waiter and that has been done data recording.
3.2 Purchase order menu
Front-liner/Waiter request goods from certain tenants can access this menu. In this process, Transaction menu will do the following steps:
• Waiter shall first record personal data to the extent possible,
• Reservation Code will be set automatically from the system.
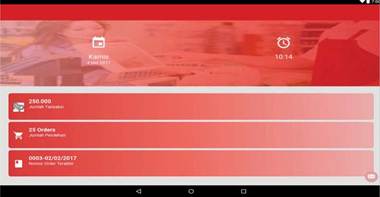
Figure 4. Design application connected to Android system.
Figure 5. Purchase order menu.
• The data can still less be filled by the Waiter himself. The filled data are:
a. Tenant Name
b.Phone number
c. E-mail
d.Reservation Date (auto-set)
e. Shop layout number code
f. Maximum length of delivery
• Based on customer’s choice, Waiter will click Menu Selection to select the items available (e.g. Food, Fashion, or Accessories). These items can be set up at the beginning of the application. Purchase order menu is given in Figure 5.
3.3 Order menu
After Front-Liner clicks on the Item Options, the details of the item will be accessible by Waiter to serve the request. The following steps shall be taken:
• Each item has been set with the price so that the user can swipe the goods, then the system performs data analysis based on order data items entered by the waiter and record data as well as the number of orders and the amount of Rupiah orders.
• For the process of change, then the old data will be updated with the new data and saved to the existing database on the computer cashier.
• After the verification by clicking the PAY button, then the screen at the cashier will show the payment items along with the details.
Order menu can be seen in Figure 6.
3.4 Cashiermenu
The cashier contains the details of the items that have been approved by the customer and have been shipped by the front-liner (Figure 7). In this item, Name of Goods Details, Unit Price per Detail Goods, Order Number (QTY), and Total Price per Goods will be written. It will also display Discount when there is a promo program, VAT tax, and Service Charge, and the total performance to be paid.
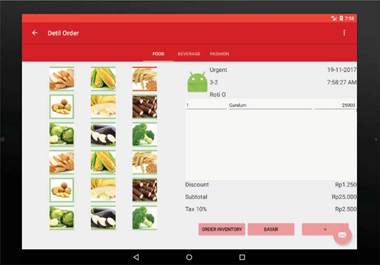
Figure 6. Order menu.
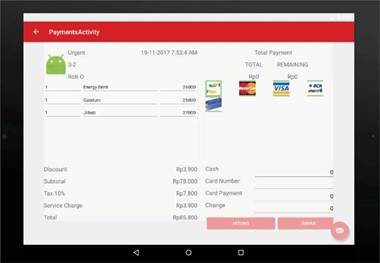
Figure 7. Cashier menu.
For payment options, there is Cash and External Credit-Visa. After the payment, the cashier will click Complete Order on the warehousing so that the employee in the warehousing will see the order directly to be done, and can also use the printer as a medium order.
Cashier Menu can also be viewed by recap (list) by clicking the left pop-up menu, so the application program will display the menu as follows (Figure 8):
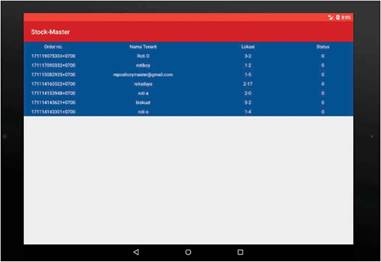
Figure 8. Recapitulation cashier menu.
3.5 Warehouse menu
In this Warehouse Menu, the following steps will be done (Figure 9):
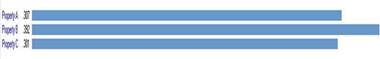
Figure 11. Weight attribute industry suitable.
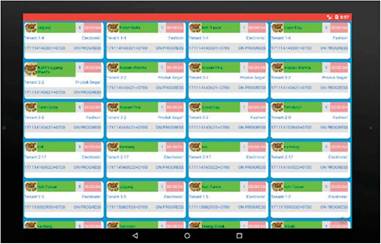
Figure 9. Warehouse menu.
• After receiving the verification from the cashier, the warehousing section will appear with additional order items ordered so that the chef in the warehousing officer will see the order directly to be done.
• The completed order result is inputted into the application system. Then the food items can be immediately transferred to the customer, and if the waiter has delivered the goods to the tenant with a certain number of layouts, then the waiter will click the layout so that the table display on the screen will be DONE (completed).
• Results of transactions that have been done synchronize the process in the online data server that has been provided (Ayat et al. 2011).
4 ANALYZING AND TESTING
For testing the application using the AHP method by conducting a survey on 40 respondents who work as industry players, it is needed to determine the acceptance of applications if the application is applied in the industry (see in Figure 10).
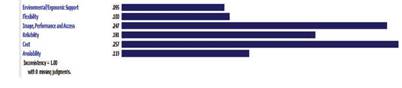
Figure 12. Weight attributes.
Input data is inserted that has a purpose of “Implementation of industrial supply chain software”, with 6 attributes; environment, this application can be used without damaging environment; flexibility, this application can be used not only by computer user but multi-users; image performance is the appearance of software; reliability is real time; cost is the price of the application; availability is the easiness to access the application. The attributes are elaborated with three alternative companies: property A (retail industry), property B (manufacturing industry), and property C (restaurant). The result of the test by the AHP method with the survey based on the questionnaire resulted in the following results (Siregar & Puar 2018).
From Figure 11, it is known that various industries are suitable to use this application; 30.7% in the retail industry, 39.2% in the manufacturing industry, and 32.1% in the restaurant. This indicates that the three industries are suitable for using the program applications that have been created with android system integration and display tools (Endrawati & Siregar 2018).
Based on the testing of priority attributes in Figure 12, it is found that the priority things of this application are cost with 25.7% and performance with 24.7%. Therefore, costs and application performance are quite necessary concerns for development of this application in the future (Puar & Siregar 2017).
Ξl Goal: Implementasi software rantai pasok di Industri
Environmental/Ergonomic Supportl
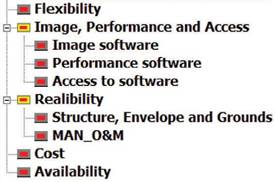
Figure 10. AHP criteria.
5 CONCLUSION
The physical form of integrated monitoring tool is an electronic display device with android operating system connected to the smart TV and smart phone. Performance of work system between smart TV and smart phone device can be integrated in real time by using wireless function and FTP (file transfer protocol) function. The results of the survey of acceptance of applications in the industry show that 39.2% of the application is suitable for manufacturing industries. Priority factors required in this program are cost and systems performance. Technology requirement is needed by industries to strengthen their
business in the markets. Research studies concerning with technology applied to the industries need to directly solve industry-related problems.
REFERENCES
Ayat, M., Masrom, M. & Sahibuddin, S. 2011. Issues in implementing it governance in small and medium enterprises. Proceedings of the 2nd International Conference on Intelligent Systems, Modelling and Simulation (ISMS), Phnom Penh, Cambodia.
Bin-Abbas, H. & Bakry, S.H. 2014. Assessment of IT governance in organizations: A simple integrated approach. Computers in Human Behavior 32: 261-267.
Chikaraishi, T., Minato, T., & Ishiguro, H. 2008. Development of an android system integrated with sensor networks. In Intelligent Robots and Systems, 2008. IROS 2008. IEEE/ RSJ International Conference on (pp. 326-333). IEEE.
Endrawati, T. & Siregar, M.T. 2018. Analysis of logistic distribution performance of good supply from PT. Mentari Trans Nusantara distribution centre to branches using Smart PLS 3.0. In AIP Conference Proceedings 1941(1): 020007.
Jogiyanto, H.M. & Abdillah, W. 2011. Sistem Informasi Teknologi Informasi, Yogyakarta: Andi Publisher.
O’Brien, J.A. & Marakas, G. 2010. Foundation Concept: Information Systems in Business in Management Information System. New York: The McGraw-Hill Companies Inc.
Puar, Z.P. & Siregar, M.T. 2017. Rancangan Sistem Elek- tronik Kanban Untuk Meningkatkan Efektivitas Pro- duksi Just in Time. Jurnal manajemen industri dan logistic 1(1): 86-93.
Siregar, M.T. & Puar, Z.M. 2018. Implementasi Lean Distribution Untuk Mengurangi Lead Time Pengiriman Pada Sistem Distribusi Ekspor. Jurnal Teknologi, 10(1): 1-8.
Tam, K., Feizollah, A., Anuar, N.B., Salleh, R. & Cavallaro, L. 2017. The evolution of android malware and android analysis techniques. ACM Computing Surveys (CSUR) 49(4): 76.