Big Data and Following Twitter Agenda (1-31 May 2020)
Big data analysis has been used extensively in analysis and evaluations in recent years. It is possible to reach results that attract the attention of many areas from politicians, economists, health care to environmentalists on observing and guiding trends and preferences.
As a result, it is the human being who is dealt with and whose behaviour is observed. The demands, reactions and expectations of large masses are both being understood and directed. 1n this sense, it can be said that it is one of the areas that attract the most attention of public relations groups.The first response of the economy to exogenous negative shocks is withdrawal into itself. 1ndividuals tend to reduce their expenses and postpone their obligations; companies give up investment decisions. It is inevitable that this situation will prevent employment as well as affect total supply and demand. 1t would not be surprising that a situation where labour is negatively affected will create a slowdown in the economy as a whole. This continues until the uncertainty ends (Steel 2020, p. 318).
In this part of the research, developments in this direction will be observed through the behaviour of Twitter users.
13.4.1 Research Results
The following questions were sought within the scope of the research:
• How did the headers used on Twitter change during the pandemic period?
• Which accounts have Twitter users tagged/mentioned or shared or together with which headers did they use their messages?
• Which titles were the most preferred? and
• What is the level of emphasis on daily life and economic difficulties in their topics?
13.4.2 Method
The “content analysis method”, one of the quantitative research methods, was used in the study. Content analysis draws attention as a method that reveals the closed areas of texts in media messages instead of the visible and easily determined content (Bilgin 2014).
Content analysis ensures that opinions and information are revealed objectively and systematically by digitizing the discourse in the text (Altunigik et al. 2010). Kocak and Arun (2006) define this method as “a quantitative research method that enables the scientific evaluation of the judgments put forward by the researcher in the light of clearly formulated rules to classify the signs and to reveal which judgments these signs contain”.13.4.3 Preparing Data Set
One of the most used social media platforms today is Twitter social media platform. Social media platforms are used more intensely by the users day by day. People shared their experiences about the disease and their opinions about the restrictions taken during the pandemic in the social media environment. By commenting on the posts of other users, users can act positively/negatively or objectively to the subject as well as remain indifferent.
Within the scope of this study, users’ posts were collected from the Twitter social media platform by means of the keywords determined regarding the pandemic. The determined keywords are shown in Table 13.1. The “Twitter API” (Twitter 2020) provided by the Twitter platform was used for data collection. Necessary permissions (“key” and “tokens”) were created. “Tweepy” library in Python language (Tweepy 2020) was used for these actions. A data set was obtained with a total of 19,199,490 user posts between 1 and 31 May 2020.
Approximately 150 “key” expressions created for the big data screening were broadened considering the epidemic and its effects. A screening set was created in a way to include issues related to daily news, trade, general economy, violence, worship and staying at home.
The number of posts collected daily between 1 May 2020 and 31 May 2020 is shown in Fig. 13.2.
During the period under review, an average of 535 thousand tweets per day were posted. 1 and 19 May are the dates with the lowest number of Twitter messages. 694 thousand tweets belonging to 23 May exceeded the average by 30%.
Although Table 13.1 WordsscannedinbigdataKeywords in Turkish
‘Covid19’, ‘corona’, ‘coronavirus’, ‘covid19tr’, ‘coronavirus’, ‘virus’, ‘microbe’, ‘corona’, ‘coronavirus’, ‘epidemic’, ‘death’, ‘intensive care’, ‘mask’, ‘hygiene’, ‘cleanliness’, ‘number of deaths’, ‘mortality rate’, ‘new case’, ‘recovery rate’, ‘healing number’, ‘medical staff’, ‘doctor’, ‘Cemal Ta§£toglu’, ‘world health organization’, ‘WHO’, ‘firms will go bankrupt’, ‘unemployment’, ‘stagnation’, ‘economy will collapse’, ‘debt’, ‘tourism’, ‘hunger’, ‘production’, ‘consumption’, ‘food’, ‘support’, ‘bread’, ‘help’, ‘daily workers’, ‘agriculture’, ‘production’, ‘harvest time’, ‘crop in the field’, ‘grocer’, ‘market’, ‘bakery’, ‘Market’, ‘restaurant’, ‘cafe’, ‘restaurant’, ‘service sector’, ‘Precaution’, ‘panic’, ‘fear’, ‘state financial protection’, ‘power’, ‘SME’, ‘support’, ‘subsidy’, ‘credit’, ‘bankrupt’, ‘bankrupt’, ‘production’, ‘loan debt’, ‘installment’, ‘tax’, ‘social security premium’, ‘salary’, ‘wage’, ‘layoffs’, ‘unemployed’, ‘paid leave’, ‘unpaid leave’, ‘short work allowance’, ‘loan’, ‘bank’, ‘interest’, ‘Internet’, ‘e-education’, ‘commerce’, ‘home office’, ‘flexible working’, ‘entertainment’, ‘social media’, ‘fun’, ‘no time’, ‘boredom’, ‘sports’, ‘weight gain’, ‘walking’, ‘feed the cat’, ‘feed the dog’, ‘fasting’, ‘prayer’, ‘worship’, ‘Friday’, ‘tarawih’, ‘mosque’, ‘church’, ‘Iran’, ‘mullah’, ‘pope’, ‘Sunday ritual’, ‘Friday prayer’, ‘family’, ‘child’, ‘violence’, ‘violence against women’, ‘e-school’, ‘iftar’, ‘insult’, ‘swearing’, ‘lie’, ‘slander’, ‘thieves’, ‘panic’, ‘fear’, ‘concern’, ‘deaths has increased,’ ‘turkey actual figures conceals’, ‘true number of deaths’
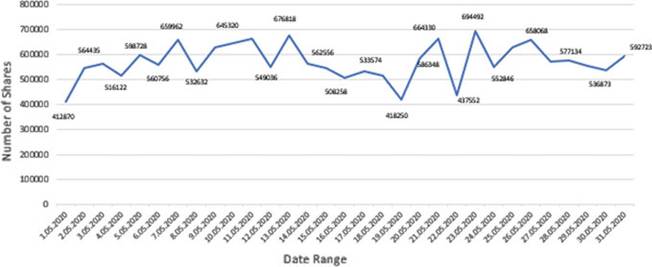
Fig. 13.2 Number of shares collected daily. Source Created by author
Twitter users have an average daily message habit in the relevant date range, it can be said that they use Twitter intensively depending on the situation and the agenda.
13.5