The ‘Bad News’: New Economic and Social Issues - The Great Recession
Economic policy has to face hard problems currently. As Blanchard, Dell'Ariccia and Mauro (2010: 10) say, defining a new macroeconomic policy framework is a very difficult task, more than before, but not a desperate one.
‘The bad news is that the crisis has made clear that macroeconomic policy must have many targets; the good news is that it has also reminded us that we have in fact many instruments, from “exotic” monetary policy to fiscal instruments, to regulatory instruments. It will take some time, and substantial research, to decide which instruments to allocate to which targets, between monetary, fiscal, and financial policies.'The bad news aspect is due to the fact that many issues have arisen with evidence at the same time. The Great Recession, rising inequality, secular stagnation and globalisation are the (partly) new issues that have arisen in recent decades. To be true, they had already manifested in the past, but they seemed to be dormant or to have been tamed. This was the case of the crisis, whose main occurrence dates back to the Great Depression of the 1930s, and the ensuing stagnation.[LXIV] Globalisation and rising inequalities within both developed and less developed countries (LDCs) - even if inequality between them decreased - after World War II seemed to have been under control for a while (say, until the 1970s) but re-emerged in the following decades. Even if these tendencies are strictly intertwined, we will try to deal with each one at a time, starting from the crisis.
The recent crisis has been very heavy. The trends in income and employment growth in some important (both Organisation for Economic Co-operation and Development (OECD) and non-OECD) countries are shown in Table 5.1 for the former variable and in Table 5.2 for the latter. The time impact of the crisis has been different across countries.
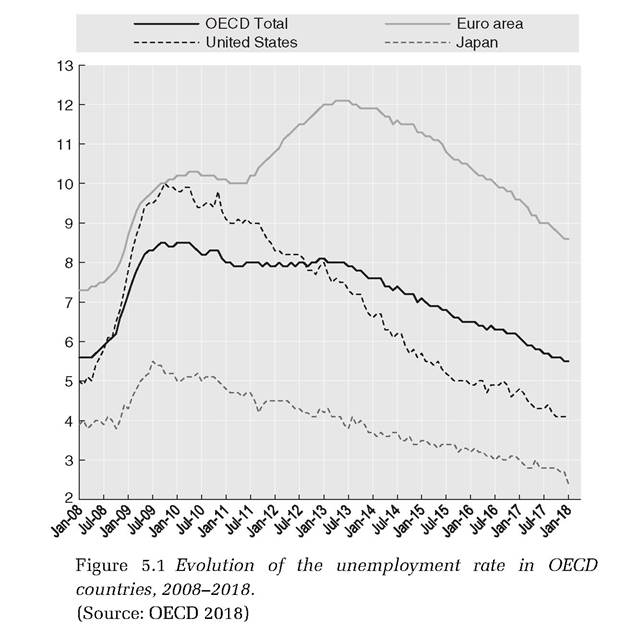
In fact, the United States has been hit very hard, followed by European countries and then Brazil, Russia, India, China and South Africa (BRICS). This difference in timing - similar to the propagation of a wave - has different roots ranging from the nature of the policies implemented in the various countries to the different structural positions of each.Since its beginning millions of jobs have been lost. The crisis has hit some countries - especially European ones - more than others, driving up the unemployment rate in some countries to peak levels. In the Euro area it rose by around 5 p. p. to around 12 per cent in the 5 years to 2013 (see fig. 5.1), but in some European countries such as Spain it almost tripled, to 23 per cent. As a whole, the impact on OECD countries was not so heavy, reaching the peak in 2009-10 (8.4 percent) and then slowing down to 5.5 percent in 2017-18. In the United States the impact has been high until 2010-11, being relatively mild in recent years. Finally, in Japan the peak has been reached by mid-2009, but the country has remained relatively untouched by the crisis. However, it must be realised that in some cases, the unemployment rate underestimates the negative impact of the crisis, even in terms of unemployment. In fact, the number of youth ‘Not (engaged) in Education, Employment or Training’ (NEET) has increased as an effect of the crisis, almost all major developed countries, except Germany, Japan, Sweden and the UK, from 2007 to 2014, the year which signed the end of the crisis (see fig. 5.2).
The recession has been largely an effect of the pro-market policies enacted in these countries, which have favoured
Table 5.1 Recent and projected growth rates for real GDP, 2007-17
| 2007 | 2008 | 2009 | 2010 | 2011 | 2012 | 2013 | 2014 | 2015 | 2016 | 2017 | |
| OECD countries | |||||||||||
| OECD | 2.7 | 0.2 | -3.5 | 3.0 | 1.9 | 1.3 | 1.2 | 1.9 | 2.1 | 1.8 | 2.1 |
| Euro areaα | 3.0 | 0.4 | -4.5 | 2.0 | 1.5 | -0.9 | -0.3 | 1.0 | 1.6 | 1.6 | 1.7 |
| France | 2.4 | 0.2 | -2.9 | 2.0 | 2.1 | 0.2 | 0.6 | 0.6 | 1.2 | 1.4 | 1.5 |
| Germany | 3.4 | 0.8 | -5.6 | 3.9 | 3.7 | 0.6 | 0.4 | 1.6 | 1.4 | 1.6 | 1.7 |
| Japan | 2.2 | -1.0 | -5.5 | 4.7 | -0.5 | 1.7 | 1.4 | 0.0 | 0.6 | 0.7 | 0.4 |
| Korea | bgcolor=white>5.52.8 | 0.7 | 6.5 | 3.7 | 2.3 | 2.9 | 3.3 | 2.6 | 2.7 | 3.0 | |
| United Kingdom | 2.6 | -0.5 | -4.2 | 1.5 | 2.0 | 1.2 | 2.2 | 2.9 | 2.3 | 1.7 | 2.0 |
| United States | 1.8 | -0.3 | -2.8 | 2.5 | 1.6 | 2.2 | 1.5 | 2.4 | 2.4 | 1.8 | 2.2 |
| Non-OECD countries | |||||||||||
| Brazil | 6.1 | 5.1 | -0.1 | 7.5 | 3.9 | 1.9 | 3.0 | 0.1 | -3.9 | -4.3 | -1.7 |
| China | 14.2 | 9.6 | 9.2 | 10.6 | 9.5 | 7.7 | 7.7 | 7.3 | 6.9 | 6.5 | 6.2 |
| India | 9.8 | 3.9 | 8.5 | 10.3 | 6.6 | 5.6 | 6.6 | 7.2 | 7.4 | 7.4 | 7.5 |
| Russia | 8.5 | 5.2 | -7.8 | 4.5 | 4.3 | 3.5 | 1.3 | 0.7 | -3.7 | -1.7 | 0.5 |
Note: Values for 2016 and 2017 are OECD projections. a Aggregate of fifteen OECD countries of the Euro area.
Source: OECD 2016.Table 5.2 Recent and projected growth rates for employment, 2007-17
| 2007 | 2008 | 2009 | 2010 | 2011 | 2012 | 2013 | 2014 | 2015 | 2016 | 2017 | |
| OECD countries | |||||||||||
| OECD | 1.5 | 0.6 | -1.8 | 0.3 | 1.0 | 1.0 | 0.7 | 1.3 | 1.4 | 1.5 | 1.1 |
| Euro areaα | 2.0 | 0.9 | -1.9 | -0.5 | 0.2 | -0.6 | -0.6 | -0.6 | 1.0 | 1.3 | 1.0 |
| France | 1.7 | 1.3 | -1.0 | 0.2 | 0.1 | 0.2 | -0.2 | 0.1 | 0.0 | 0.4 | 0.5 |
| Germany | 2.1 | 1.0 | -0.3 | 0.8 | 2.5 | 1.0 | 1.0 | 0.9 | 0.7 | 1.6 | 0.8 |
| Japan | 0.6 | -0.3 | -1.5 | -0.3 | -0.1 | -0.3 | 0.7 | 0.6 | 0.4 | 0.5 | -0.2 |
| Korea | 1.2 | 0.6 | -0.3 | 1.4 | 1.7 | 1.8 | 1.6 | 2.1 | 1.3 | 1.2 | 1.2 |
| United Kingdom | 0.8 | 0.9 | -1.6 | 0.2 | 0.5 | 1.1 | 1.2 | 2.3 | 1.5 | 1.2 | 0.6 |
| United States | 1.1 | -0.5 | -3.8 | -0.6 | 0.6 | 1.8 | 1.0 | 1.6 | 1.7 | 2.1 | 1.5 |
| Non-OECD countries | |||||||||||
| Brazil | 1.6 | 3.2 | 0.5 | 0.7 | 0.7 | 1.7 | 1.4 | 1.5 | 0.0 | -1.6 | 0.7 |
| China | NA | NA | NA | NA | NA | NA | NA | NA | NA | NA | NA |
| India | NA | NA | NA | NA | NA | NA | NA | NA | NA | NA | NA |
| Russia | 2.5 | 0.6 | -2.3 | 0.7 | 1.5 | 1.0 | -0.2 | 0.2 | 1.1 | 0.0 | -0.2 |
Note: Values for 2016 and 2017 are OECD projections [NA = not available).
a Aggregate of fifteen OECD countries of the Euro area.Source: OECD 2016.
unregulated growth of the financial sector, as well as other wrong policies, such as preference being given to abating inflation rather than unemployment and the instruments implemented for this (e.g. fiscal consolidation).2 Unregulated globalisation has made it easier to transmit recessionary impulses from one country to another.
The most important pro-market policy behind the crisis was financial market liberalisation, which increased market
2 ‘The short-run costs in terms of lower output and welfare and higher unemployment have been underplayed, and the desirability for countries with ample fiscal space of simply living with high debt and allowing debt ratios to decline organically through growth' has been underappreciated (Ostry, Loungani and Furceri, 2016: 40).
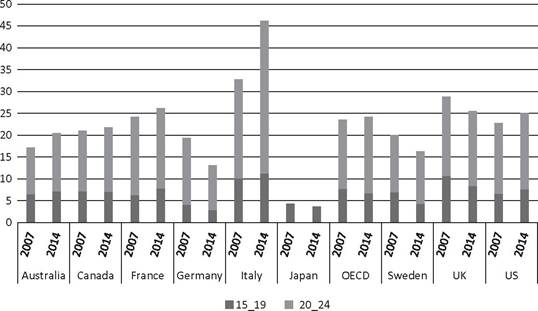
Figure 5.2 NEETs in major OECD countries, 2007-2014. (Source: OECD 2016)
concentration, fed the housing and financial asset bubble[65] and caused misallocation of resources.[66] As an effect of this approach, the Fed was largely passive while financial intermediaries and ordinary people took on increasing risk and allowed the crisis to intensify for more than a year after it had begun. As the Fed finally tried, but failed, to avoid allowing the bubble to enlarge, the question arises whether this could have been avoided by other, more effective and timely policy instruments such as financial regulation. On the other side of the Atlantic, the European Central Bank (ECB) action also raised critiques. After a non-enthusiastic performance since adoption of the euro, it was not able to prevent the contagion of private debt into sovereign debt. To be fair, the failures in the Euro area were related more to its general architecture than to specific ECB policies.
In addition, in the Euro area, other policies and the general institutional design that were clearly in favour of free markets nourished the crisis and were unable to stop it for a long time (Acocella 2016b). The interaction of interest rates being stuck at the zero lower bound (ZLB), deflation and private indebtedness (‘debt deflation') implies that a reduction of inflation, which usually has the effect of stimulating output, is contractionary (Neri and Notarpietro 2014). The general lesson from the crisis is that we are far from having achieved an optimal institutional design. Alternative explanations of the crisis in terms of other factors have been suggested, but institutions have certainly played an important role in feeding the crisis in the Euro area, as a comparison with the United States easily shows.The next three sections of this chapter show the need for giving an image to the ‘good news' and devising new policies (Section 5.2), in particular, new monetary and fiscal policy tools (respectively, Sections 5.3 and 5.4).
5.2