Development facts
In Section 2.1 we briefly review key development facts, focusing on the vast and rising differences in per capita income across nations. Section 2.2 reminds the reader how these disparities came about by quickly surveying the economic history behind income divergence.
2.1. Poverty and riches
What does it mean to live on one or two dollars per day? Poverty translates into hunger, lack of shelter, illness without medical attention. Calorie intake in the poorest countries is far lower than in the rich. The malnourished are less productive and more susceptible to disease than those who are well fed. Infant mortality rates in the poorest countries are up to 40 or 50 times higher than the OECD average. Many of the common causes, such as pneumonia or dehydration from diarrhea, cost very little to treat.
The poor are more vulnerable to events they cannot control. They are less able to diversify their income sources. They are more likely to suffer from famine, violence and natural disasters. They have lower access to credit markets and insurance, with which to smooth out their consumption. Their children risk exploitation, and are less likely to become educated.
The plight of the poor is even more striking when compared to the remarkable wealth of the rich. Measured in 1996 US dollars and adjusted for purchasing power parity, average yearly income per capita in Luxembourg for 2000 was over $46,000.[214] In Tanzania, by contrast, average income for 2000 was about $500. In other words, people in Luxembourg are nearly 100 times richer on average than those living in the very poorest countries.[215] Luxembourg is rather exceptional in terms of per capita income, but even in the US average income is now about 70 times higher than it is in Tanzania.
How has the gap between the richest and the poorest evolved over time? The answer is simple: It has increased dramatically, even in the postwar era.
In 1960, per capita income in Tanzania was $478. After rising somewhat during the 1960s and 1970s it collapsed again in the 1980s. By 2000 it was $457. Many other poor countries have had similar experiences, with income hovering around the $500-1,000 mark. Meanwhile, the rich countries continued exponential growth. Income in the US grew from $12,598 in 1960 (26 times that of Tanzania) to $33,523 in 2000 (73 times). Other rich industrialized countries had similar experiences. In Australia over the same period per capita GDP rose from $10,594 to $25,641. In France it rose from $7,998 to $22,253, and in Canada from $10,168 to $26,983.Figure 1 shows how the rich have gotten richer relative to the poor. The left hand panel compares an average of real GDP per capita for the 5 richest countries in the Penn World Tables with an average of the same for the 5 poorest. The comparison is at each point in time from 1960 to the year 2000. The right panel does the same comparison with groups of 10 countries (10 richest vs. 10 poorest) instead of 5. Both panels show that by these measures income disparity has widened dramatically in the postwar era, and the rate of divergence is, if anything, increasing. The vast and growing disparity in output per person shown in Figure 1 is what growth and development theorists are obliged to explain.[216]
2.2. A brief history of economic development
How did the massive disparities in income shown in Figure 1 arise? It is worth reviewing the broad history of economic development in order to remind ourselves of key facts.[217]
Although the beginnings of agriculture some ten thousand years ago marked the start of rapid human progress, for most of the subsequent millennia all but a tiny fraction of humanity was poor as we now define it, suffering regularly from hunger and highly vulnerable to adverse shocks. Early improvements in economic welfare came with the rise of premodern city-states. Collective organization of irrigation, trade, communications
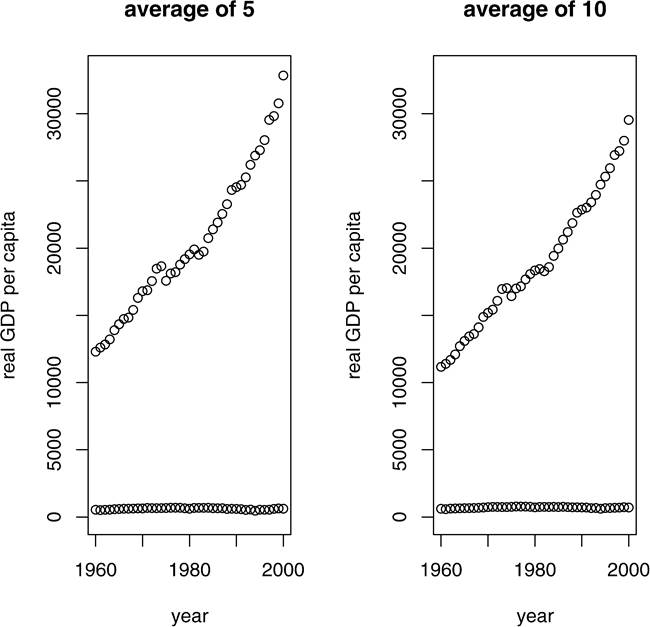
Figure 1.
and security proved more conducive to production than did autarky. Handicraft manufacture became more specialized over time, and agriculture more commercial. (Already the role of increasing returns and the importance of institutions are visible here.)
While such city-states and eventually large empires rose and fell over time, and the wealth of their citizens with them, until the last few hundred years no state successfully managed the transition to what we now call modern, self-sustaining growth. Increased wealth was followed by a rise in population. Malthusian pressure led to famine and disease.
The overriding reason for lack of sustained growth was that in the premodern world production technology improved only slowly. While the scientific achievements of the ancient Mediterranean civilizations and China were remarkable, in general there was little attempt to apply science to the economic problems of the peasants. Scientists and practical people had only limited interaction. Men and women of ability usual found that service to the state - or predation against other states - was more rewarding than entrepreneurship and invention.
Early signs of modern growth appeared in Western Europe around the middle of the last millennium. Science from the ancient world had been preserved, and now began to be extended. The revolutionary ideas of Copernicus led to intensive study of the natural world and its regularities. The printing press and movable type dramatically changed the way ideas were communicated. Innovations in navigation opened trade routes and new lands. Gunpowder and the cannon swept away local fiefdoms based on feudal castles.
These technological innovations led to changes in institutions. The weakening of local fiefdoms was followed in many countries by a consolidation of central authority, which increased the scale of markets and the scope for specialization.[218] Growing trade with the East and across the Atlantic produced a rich and powerful merchant class, who subsequently leveraged their political muscle to gain strengthened property and commercial rights.
Increases in market size, institutional reforms and progress in technology at first lead to steady but unspectacular growth in incomes. In 1820 the richest countries in Europe had average per capita incomes of around $1,000 to $1,500 - some two or three times that of the poorest countries today. However, in the early 19th Century the vast majority of people were still poor.
In this survey we compare productivity in the poor countries with the economic triumphs of the rich. Richness in our sense begins with the Industrial Revolution in Britain (although the rise in incomes was not immediate) and, subsequently, the rest of Western Europe. Industrialization - the systematic application of modern science to industrial technology and the rise of the factory system - led to productivity gains entirely different in scale from those in the premodern world.
In terms of proximate causes, the Industrial Revolution in Britain was driven by a remarkable revolution in science that occurred during the period from Copernicus through to Newton, and by what Mokyr (2002) has called the “Industrial Enlightenment”, in which traditional artisanal practices were systematically surveyed, cataloged, analyzed and generalized by application of modern science. Critical to this process was the interactions of scientists with each other and with the inventors and practical men who sought to profit from innovation.
Science and invention led to breakthroughs in almost all areas of production; particularly transportation, communication and manufacturing. The structure of the British economy was massively transformed in a way that had never occurred before. Employment in agriculture fell from nearly 40% in 1820 to about 12% in 1913 (and to 2.2% in 1992). The stock of machinery, equipment and non-residential structures per worker increased by a factor of five between 1820 and 1890, and then doubled again by 1913. The literacy rate also climbed rapidly. Average years of education increased from 2 in 1820 to 4.4 in 1870 and 8.8 in 1913 [Maddison (1995)].
As a result of these changes, per capita income in the UKjumped from about $1,700 in 1820 to $3,300 in 1870 and $5,000 in 1913. Other Western European countries followed suit. In the Netherlands, income per capita grew from $1,600 in 1820 to $4,000 in 1913, while for Germany the corresponding figures are $1,100 and $3,900.12
Looking forward from the start of the last century, it might have seemed likely that these riches would soon spread around the world. The innovations and inventions behind Britain’s productivity miracle were to a large extent public knowledge. Clearly they were profitable. Adaptation to new environments is not costless, but nevertheless one suspects it was easy to feel that already the hard part had been done.
Such a forecast would have been far too optimistic. Relatively few countries besides Western Europe and its off-shoots have made the transition to modern growth. Much of the world remains mired in poverty. Among the worst performers are Sub-Saharan Africa and South Asia, which together account for some 70% of the 1.2 billion people living on less than $1 per day. But poverty rates are also high in East Asia, Latin America and the Carribean. Why is it that so many countries are still poorer than 19th Century Britain? Surely the different outcomes in Britain and a country such as Mali can - at least from a modeler’s perspective - be Pareto ranked. What deviation from the neoclassical benchmark is it that causes technology growth in these countries to be retarded, and poverty to persist?