Econometric issues II: Data and error properties
In this section we consider a range of questions that arise in growth econometrics from the properties of data and errors. Starting with data issues, Section 7.1 examines how one may handle outliers in growth data.
Section 7.2 examines the problem of measurement error. This is an important issue since there are good reasons to believe that the quality of the data is sometimes poor for less developed economies. In Section 7.3 we consider the case where data are not even measured, i.e. are missing. Turning to issues of the properties of model errors, Section 7.4 examines the analysis of heteroskedas- ticity in growth contexts. Finally, Section 7.5 addresses the problem of cross-section correlation in model errors.7.1. Outliers
Empirical growth researchers often work with small data sets and estimate relatively simple models. In these circumstances, OLS regressions are almost meaningless unless they have been accompanied by systematic investigation of the data, including the sensitivity of the results to outlying observations.
There are various reasons why some observations may be unrepresentative. It is possible for variables to be measured with error for that particular region or country. Alternatively, the model specified by the researcher may omit a relevant consideration, and so a group of country observations will act as outliers. By construction, least squares estimates can be highly sensitive to the presence of small groups of observations. The practical implication is that OLS can give a misleading account of the patterns in the majority of the data. The dangers of using OLS were forcibly expressed by Swartz and Welsch (1986, p. 171): “In a world of fat-tailed or asymmetric error distributions, data errors, and imperfectly specified models, it is just those data in which we have the least faith that often exert the most influence on the OLS estimates”.
Some researchers respond to this concern using leverage measures or single-case diagnostics such as Cook’s distance statistic. There are well-known problems with these approaches, because where more than one outlier is present, its effect can easily be hidden by another (known in the statistics literature as “masking”). By far the best response is to use a more robust estimator, such as least trimmed squares, at least as a preliminary way of investigating the data.[368] These issues are discussed in more detail in Temple (1998, 2000b).
7.2. Measurement error
We now turn to a more general discussion of measurement error. It is clear that measurement errors are likely to be pervasive, especially in data that relate to developing countries. Concepts that appear straightforward in economic models can present huge measurement problems in practice, as in the example of the capital stock discussed by Pritchett (2000b). Yet relatively few empirical studies of growth consider the impact of measurement error in any detail.
The best-known statistical result applies to a bivariate model where the independent variable is measured with error.[369] The estimate of the slope coefficient will be biased towards zero, even in large samples, because measurement error induces covariance between the observable form of the regressor and the error term. This attenuation bias is well known, but sometimes misleads researchers into suggesting that measurement error will only mask effects, a claim that is not true in general. When there are multiple explanatory variables, but only one is measured with error, then typically all the parameter estimates will be biased. Some parameter estimates may be biased away from zero and, although the direction of the bias can be estimated consistently, this is rarely done. When several variables are measured with error, the assumption that measurement error only hides effects is even less defensible.
Where measurement error is present, the coefficients are typically not identified unless other information is used.
The most popular solution is to use instrumental variables, if an instrument can be found which is likely to be independent of the measurement error. A more complex solution is to exploit higher-order sample moments to construct more sophisticated estimators, as in Dagenais and Dagenais (1997). These procedures may be unreliable in small samples since the use of higher-order moments will make them especially sensitive to outliers.Sometimes partial identification is possible, in the sense that bounds on the extent of measurement error can be used to derive consistent estimates of bounds on the slope parameters. Although it can be difficult for researchers to agree on sensible bounds on the measurement error variances, there are easier ways of formulating the necessary restrictions, as discussed by Klepper and Leamer (1984). Their reverse regression approach was implemented by Persson and Tabellini (1994) and Temple (1998), but has rarely been used by other researchers. Another strategy is to investigate sensitivity to varying degrees of measurement error, based on method-of-moments corrections. Again, this is easy to implement in linear models, and should be applied more routinely than it is at present. Temple (1998) provides a discussion of both approaches in the context of estimating technology parameters and the rate of conditional convergence within the Mankiw, Romer and Weil (1992) model.
7.3. Missingdata
Some countries never appear in growth data sets, partly by design: it is common to leave out countries with very small populations, oil producers, and transition economies. These are countries that seem especially unlikely to lie on a regression surface common to the majority of the OECD countries or the developing world. Countries with small populations should not be allowed to carry a great deal of weight in attempting to draw generalizations about growth for larger countries.
Other countries are left out for different reasons. When a nation experiences political chaos, or lacks economic resources, the collection of national accounts statistics will be a low priority.
This means that countries like Afghanistan, Ethiopia and Somalia rarely appear in comparative growth studies. In other cases, countries appear in some studies but not in others, depending on the availability of particular variables of interest.Missing data are of course a potentially serious problem. If one started from a representative data set and then deleted countries at random, this would typically increase the standard errors but not lead to biased estimates. More serious difficulties arise if countries are missing in a systematic way, because then parameter estimates are likely to be biased. This problem is given relatively little attention in mainstream econometrics textbooks, despite a large body of research in the statistics literature.
A variety of solutions are possible, with the simplest being one form or another of imputation, with an appropriate adjustment to the standard errors. Hall and Jones (1999) and Hoover and Perez (2004) are among the few empirical growth studies to carry out imputation in a careful and systematic way. This approach may be especially useful when countries are missing from a data set because a few variables are not observed for their particular cases. It is then easy to justify using other available information to predict the missing data, and thereby exploit the additional information in the variables that are observed. Alternative approaches to missing data are also available, based on likelihood or Bayesian methods, which can be extended to handle missing observations.
7.4. Heteroskedasticity
It is common in cross-section regressions for the underlying disturbances to have a non-constant variance. As is well known, the coefficient estimates remain unbiased, but OLS is inefficient and the estimates of the standard errors are biased. Most empirical growth research simply uses the heteroskedasticity-consistent standard errors developed by Eicker (1967) and White (1980). These estimates of the standard errors are consistent but not unbiased, which suggests that alternative solutions to the problem may be desirable.
For data sets of the size found in cross-country empirical work, the alternative estimators developed by MacKinnon and White (1985) are likely to have better finite sample properties, as discussed in Davidson and MacKinnon (1993) and supported by simulations in Long and Ervin (2000).There are at least two other concerns with the routine application of White’s het- eroskedasticity correction as the only response to heteroskedasticity. The first is that by exploiting any structure in the variance of the disturbances, using weighted least squares, it may be possible to obtain efficiency gains. The second and more fundamental objection is that heteroskedasticity can often arise from serious model misspecification, such as omitted variables or neglected parameter heterogeneity. Evidence of heteroskedasticity should then prompt revisions of the model for the conditional mean, rather than mechanical adjustments to the standard errors. See Zietz (2001) for further discussion and references.
7.5. Cross-section error correlation
An unresolved issue in growth econometrics is the treatment of cross-section correlation in model errors. Such correlation may have important consequences for inference; as noted by DeLong and Summers (1991) in the growth context, failure to account for cross-sectional dependence can lead to incorrect calculation of standard errors and hence, incorrect inferences. One would certainly expect cross-sectional dependence to be present when studying growth. For example, countries that are geographically close together, or trading partners, may experience common shocks.
Whether this effect is sizeable remains an open question, but one that might be addressed using ideas developed in Baltagi, Song and Koh (2003) and Driscoll and Kraay (1998), among others. In the context of growth regressions, work on cross-section dependence may be divided into two lines. One direction concerns the identification of the presence of cross-section dependence.
Pesaran (2004b) develops tests for cross-section dependence that do not rely on any prior ordering; this framework in essence sums the cross-section sample error correlations in a panel and evaluates whether they are consistent with the null hypothesis that the population correlations are zero. Specifically, he proposes (recalling that N denotes the cross-section dimension and T the time dimension) a cross-section dependence statistic CD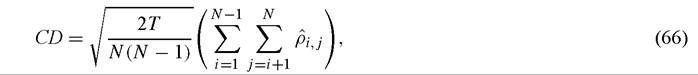
where ρij is the sample correlation between εi,t and εj,t; Pesaran gives conditions under which this statistic converges to a Normal (0, 1) random variable (as N and T become infinite) under the null hypothesis of no cross-section correlation. This test statistic is based on earlier work by Breusch and Pagan (1980) and appears to possess good finite sample properties in comparison to this earlier work. Using a country-level panel, Pesaran (2004b) finds strong rejections of the null of no cross-section correlation both for the world as a whole as well as within several geographic groupings.
The second and primary direction for the analysis of cross-section correlation has been concerned not so much with testing for its presence, but rather accounting for its presence in growth exercises. One approach relies on formulating a statistical model of the dependence. Phillips and Sul (2003) model the residuals in a growth panel as

where θt and ui,t are independent random variables; ui,t is assumed to be i.i.d. across countries and across time. Phillips and Sul (2002) describe the properties of panel estimators under this assumption.
Another possibility in analyzing cross-sectional dependence is to treat the problem as one of spatial correlation in errors. The problem of spatial correlation has been much studied in the regional science literature, and statisticians in this field have developed spatial analogues of many time series concepts, see Anselin (2001) for an overview. Spatial methods have, in our view, an important role to play in growth econometrics. However, when these methods are adapted from the spatial statistics literature, they raise the problem of identifying the appropriate notion of space. One can imagine many reasons for cross-section correlation. If one is interested in technological spillovers, it may well be the case that in the space of technological proximity, the United Kingdom is closer to the United States than is Mexico. Put differently, unlike the time series and spatial cases, there is no natural cross-section ordering to elements in the standard growth data sets. Following language due to Akerlof (1997) countries are perhaps best thought of as occupying some general socio-economic-political space defined by a range of factors; if one could identify their locations, then spatial methods could be implemented.
An interesting approach to addressing the relevant spatial location of countries is pursued by Conley and Ligon (2002). In their analysis, they attempt to construct estimates of the spatial covariation of the residuals εi in a cross-section. In order to do this, they construct different measures of socioeconomic distance between countries. They separately consider geographic distance (measured between capital cities), as well as measures of the costs of transportation between these cities. Once a distance metric is constructed, these are used to construct a residual covariance matrix. Estimation methods for this procedure are developed in Conley (1999). Conley and Ligon (2002) find that allowing for cross-section dependence in this way is relatively unimportant in terms of appropriate calculation of standard errors for growth model parameters. Their methods could be extended to allow for comparisons of different variables as the source for cross-section correlation as is done in Conley and Topa (2002) in the context of residential neighborhoods. A valuable generalization of this work would be the modeling of cross-section correlations as a function of multiple variables. Such an analysis would make further progress on the measurement of distances in socioeconomic space, which, as we have suggested, presumably are determined by multiple channels.
A generally unexplored possibility for studying cross-section dependence in growth (and other contexts) is to model these correlations structurally as the outcome of spillover effects.[370] The theoretical literature on social interactions studies crosssectional dependence in precisely this way [see Brock and Durlauf (2001b) for a survey of this literature]. While such models have the potential for providing firm microfoundations for cross-section dependence, the presence of such spillovers has consequences for identification that are not easily resolved [Brock and Durlauf (2001b), Manski (1993)] and which have yet to be explored in growth contexts; Binder and Pesaran (2001) and Brock and Durlauf (2001b) analyze identification and estimation problems for intertemporal environments that are particularly germane to growth contexts.
8.