Engines of liberation
Is it, then, consistent to hold the developed woman of this day within the same narrow political limits as the dame with the spinning wheel and knitting needle occupied in the past? No, no! Machinery has taken the labors of woman as well as man on its tireless shoulders; the loom and the spinning wheel are but dreams of the past; the pen, the brush, the easel, the chisel, have taken their places, while the hopes and ambitions of women are essentially changed.
[Elizabeth Cady Stanton, “Solitude of Self”, an address before United States Congressional Committee on the Judiciary, January 18, 1892.]
For ages woman was man’s chattel, and in such condition progress for her was impossible; now she is emerging into real sex independence, and the resulting outlook is a dazzling one. This must be credited very largely to progression in mechanics; more especially to progression in electrical mechanics.
Under these new influences woman’s brain will change and achieve new capabilities, both of effort and accomplishment.
[Thomas Alva Edison, as interviewed in GoodHousekeepingMagazine, LV, no. 4 (October 1912, p. 440).]
The twentieth century witnessed a dramatic rise in labor-force participation by married women.[150] It will be argued here that technological advance in the household sector liberated women from the home, in particular from the oppressive burden of housework. The standard Solow (1956)-Ramsey (1928) growth model will be extended along two dimensions. First, household production will be included in the framework. Second, a technology adoption decision will be incorporated into the analysis.
Time savings. As a backdrop to the subsequent analysis, a quick detour will be taken to consider some evidence on the reduction of time spent on housework. At the start of Second Industrial Revolution women’s magazines were filled with articles extolling the virtues of appliances, the new domestic servants.
For example, in 1920 an article in the Ladies' Home Journal entitled “Making Housekeeping Automatic” claimed that appliances could save a 4-person family 18.5 hours a week in housework - see Table 2. Some more scientific evidence comes from the sociology literature - see Table 3. In 1924 a pair of famous sociologists, Robert and Helen Lynd, studied a small town in Indiana, Middletown. They found that 87 percent of married women in 1924 spent 4 or more hours doing housework each day. Zero percent spent less than 1 hour a day. The townTable 2
Estimated weekly hours saved by appliances
| Task | With appliances | Without appliances | Time savings |
| Breakfast | 7 | 10 | 3 |
| Luncheons | 10.5 | 14 | 3.5 |
| Dinners | 10 | 12 | 2 |
| Dishwashing and clearing | 10.5 | 15.75 | 5.25 |
| Washing and ironing | 6.5 | 9 | 2.5 |
| Marketing and errands | 6 | 6 | 0 |
| Sewing and mending | 3.5 | 4 | 0.5 |
| Bed making | 2.75 | 3.5 | 0.75 |
| Cleaning and dusting | 2 | 3 | 1 |
| Cleaning kitchen and refrigerator | 2 | 2 | 0 |
| Total | 60.75 | 79.25 | 18.5 |
Source: Ladies’ Home Journal (1920).
Table 3
Daily housework in Middletown (percentage of married housewives in each category)
| Year | ≥4 hours | 2-3 hours | ≤ 1 hour |
| 1924 | 87 | 13 | 0 |
| 1977 | 43 | 45 | 12 |
| 1999 | 14 | 53 | 33 |
Source: Caplow, Hicks and Wattenberg (2001, p. 37).
was restudied by sociologists at two later dates. By 1999 only 14 percent of married women spent more than 4 hours a day on housework, and 33 percent spent less than 1 hour a day.
5.1. Theenvironment
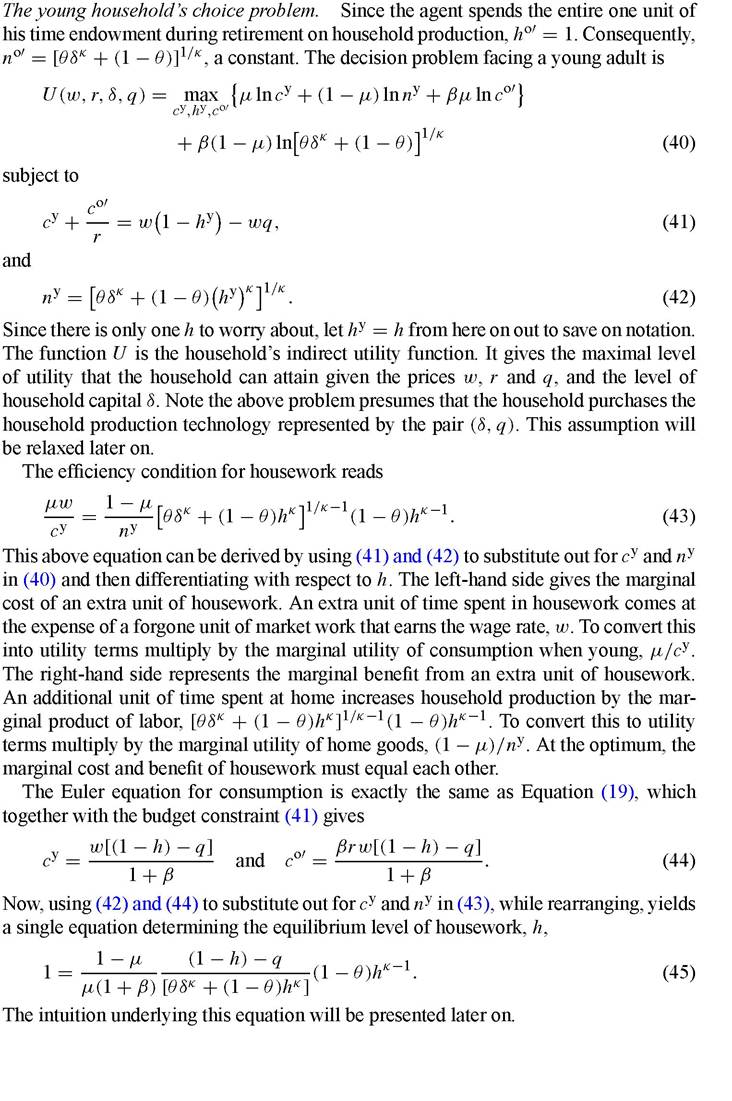
Consider a small open economy populated by overlapping generations.18 Individuals live for two periods, they work in the first period and retire in the second. They are endowed with one unit of time for either working in the market or at home.
Tastes. The lifetime utility function for a young adult is given by

where cy and co' denote the individual’s consumption when young and old, and (with a change in notation from the previous sections) ny and no' now stand for young and old household production.
Income. Young adults work for the market wage, w. They save for old age at the internationally determined time-invariant gross interest rate r.
Household production technology. Let the production of home goods, n, be governed by
where S is the stock of household capital and (with another change in notation) h now represents the amount of time spent on housework.
When ę > 0 (ę < 0), capital and labor are Edgeworth-Pareto substitutes (complements) in producing utility.19 Finally, assume that household capital is lumpy or indivisible. A person acquires this capital when young and keeps it for his entire life, whereupon it fully depreciates. Let the time cost of purchasing S units of household capital be q.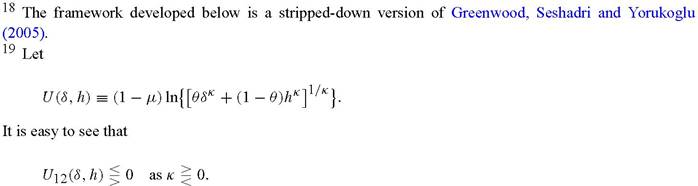
The firm’s problem. Once again let market output, o, be produced in line with the following production function:
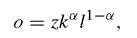
where k and l are the inputs of capital and labor used in production and z is the level of productivity in the market sector. Now, suppose that capital depreciates fully after use in production. The rental rate on capital will therefore be r, since it must yield the same return as a bond. Given this production structure, once again wages will be given by (9).
5.2. Analysis
What is the effect of technological advance in the home sector on the amount of time devoted to housework? The answer will depend upon whether capital and labor in household production are Edgeworth-Pareto substitutes or complements in generating utility. Likewise, what impact will technological progress in the market sector have on the amount of time allocated to housework?
Corollary. Technological progress in the market sector, or an increase in z, has no effect on time spent in housework h.
Proof. The proof is trivial since z does not enter (45), because w does not. ?
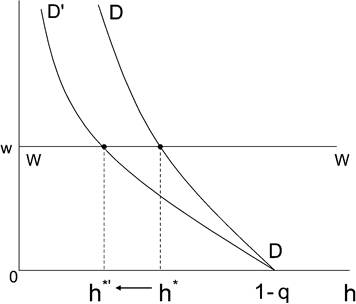
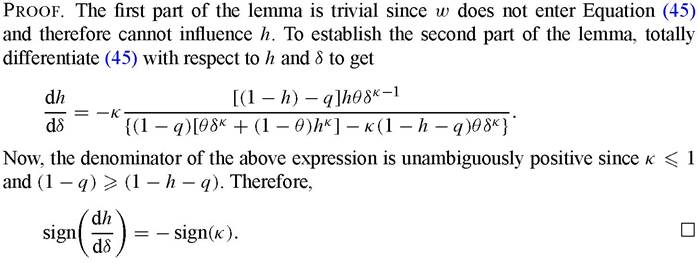
Figure 9.
The effect of an improvement in household technology on time spent on housework.
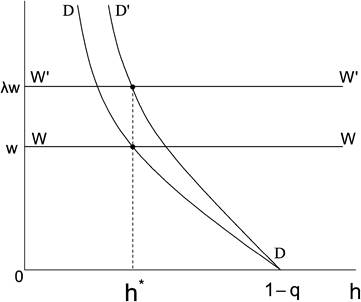
Figure 10. The effect of an increase in wages on time spent on housework.
Therefore, the demand curve for housework will shift down or up depending upon whether labor and capital are substitutes (κ > 0) or complements (κ < 0) in home production. Figure 9 portrays the case where labor and capital are substitutes.
Now, let wages jump up by a factor of λ. It is easy to deduce that the WW and DD curves will also shift up by a factor of λ to W'W' and DzD, as is shown in Figure 10. Hence, the equilibrium level of housework remains unaffected. With logarithmic preferences an increase in wages by a factor of λ will cause the consumption of market goods to increase by the same factor, which leads in turn to an equiproportionate rise in the relative price of home goods. Therefore, the value of marginal product curve shifts up by the factor λ.
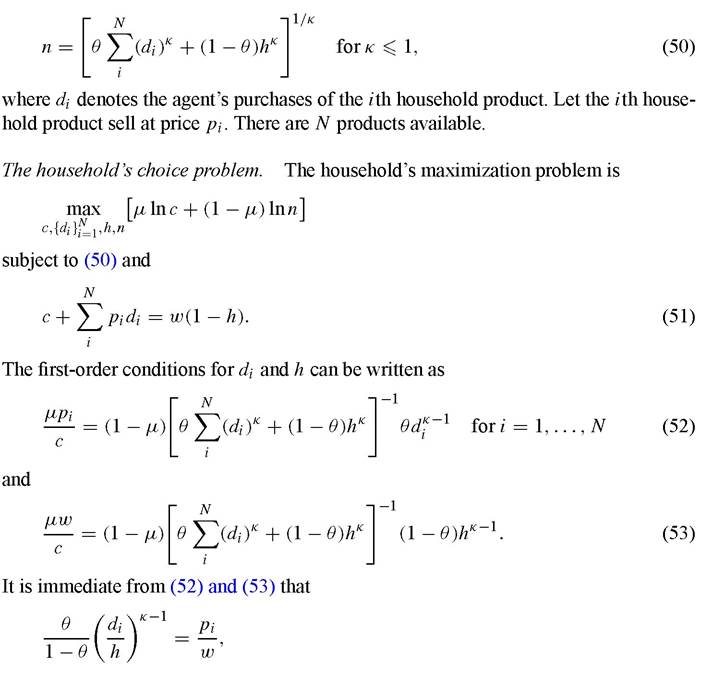
Example 5 (Female labor-force participation, 1900 and 1980). Assume the following parameter values.
(i) Tastes: β = 0.9420.
(ii) Technology: θ = 0.33, κ = 0.5, q = 0.
In 1900 about 5 percent of married white females worked. Assume that none did. There are about 224 nonsleeping hours available per couple in a week. If males worked a 40 hour week then 1 — h = 40/224 = 0.18 in 1900. Now, suppose that the amount of household capital in 1900 is negligible; i.e., set δ = 0. By using (45) it can be calculated that a value of μ = 0.145 is need to generate 1 — h = 0.18. Next, about 50 percent of white married women worked in 1980. Therefore, 1 — h = 60/224 = 0.27. From (45) it can be deduced that this value for 1 — h can be obtained by setting δ = 1.41. Thus, a rise in female labor-force participation from zero to 50 percent can be generated by letting δ increase from 0 to 1.41.
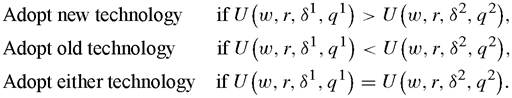
A technology adoption decision. Now suppose that the household faces a choice between two household production technologies, namely a new versus an old one. Represent the new technology by the pair (δ1, q1), and the old one by (δ2, q2). To make the problem interesting, assume that δ1 > δ2 and q1 > q2. The new technology offers more capital services but costs more. Characterizing the household’s adoption decision is straightforward:
Lemma 6. When capital and labor are Edgeworth-Pareto substitutes in household production (0 < ę ≤ 1), the adoption of a new household technology will be associated with a decline in the amount of time spent on housework.
Proof. From Equation (45) it is easy to calculate that

where again the denominator is positive since κ ≤ 1 and (1 - q) f (1 - h - q). Second, it was already established in Lemma 5 that sign(dh∕dδ) = - sign(κ). The result is now immediate since q1 > q2 and δ1 > δ2. ?
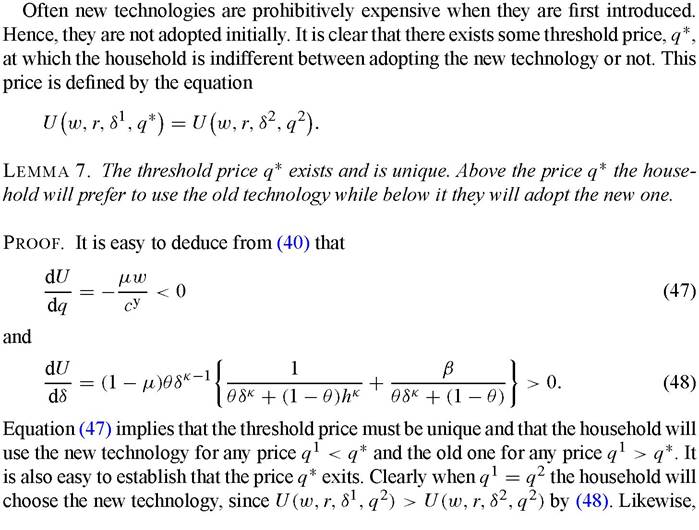
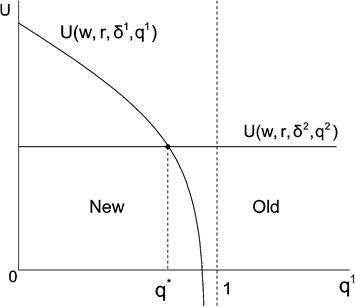
Figure 11. The determination of the threshold price, q *.
 sufficiently close to one, since at this high price there will be no resources left over for market consumption. Hence, by the Intermediate Value Theorem the threshold price q * must exist. ?
The situation described by the lemma is portrayed in Figure 11. So long as the price for the new technology declines over time to the point q * households will eventually adopt it.
5.3. Analysis with nondurable household products and services
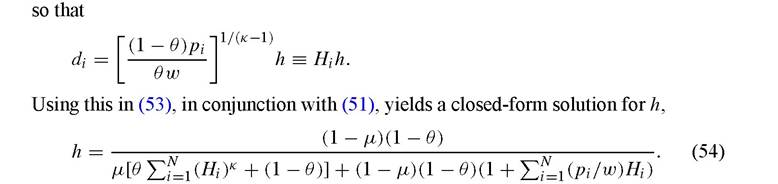
Over the last 100 years or so there has been a dramatic rise in the number of labor-saving nondurable household products and services. These goods and services economize on the need for housework. For example, in 1900 the bulk of baked goods, or 92 percent, was made at home.[151] The average housewife is said to have baked more than 1 /2 ton of bread a year. She spent over 2 hours a week baking goods.[152] By 1965 this had dropped to 22 percent. Similarly, 96 percent of vegetables purchased were unprocessed in 1900, as opposed to 30 percent in 1965.[153] Per-capita consumption of canned fruits rose from 3.6 pounds in 1910 to 21.6 pounds in 1950.[154] Think of the time saved cleaning, pealing, canning, or otherwise preparing fruits and vegetables. There were about 2,100 packaged food products available in 1980, compared with 10,800 today.[155] Last, in 1900 only 5 percent of food expenditure was on meals away from home. This had risen to 30 percent by 1987.25 To explore how the introduction of new household products and services may promote female labor-force participation, a static model of the household will be presented.
Setup. For tastes take a static version of (39), so that utility is given by
μ lnc + (1 — μ) lnn, (49)
where c and n represent the individual’s consumption of market and home goods, respectively. As before, the individual is endowed with one unit of time that he can use either for market work 1 — h, or housework h. Market work is compensated at the wage rate w. Home goods are produced in line with the household production function given below
[1] Lebergott (1993, p. 77).
Analysis. The upshot of the above discussion is now within easy grasp.
Lemma 8. An expansion in the number of household products and services, N, will cause housework, h, to decrease and market work, 1 - h, to increase.
Proof. It is trivial to see that (54) is decreasing in N. ?
Lemma 9. A decline in the time price of the i th household product, pi/w, will
(a) cause housework, h, to decline when intermediates goods and labor are Edgeworth-Pareto substitutes (or when ę > 0),
(b) cause housework, h, to increase when intermediates goods and labor are Edgeworth-Pareto complements (or when ę < 0),
(c) have no effect on housework, h, when intermediates goods and labor are neither Edgeworth-Pareto substitutes or complements (or when κ = 0).
Proof. Observe that H. and (pi∕w)Hi are both decreasing or increasing in pi∕w depending on whether ę > 0 or ę < 0. The results follow. ?
Given the form of tastes (49) and the household production function (50), an increase in the number of household products reduces the marginal product of housework (measured in utility terms).[156] Hence, housework declines. Likewise, a decline in time price of household product i will lead to its increased use. When intermediates goods and housework are Edgeworth-Pareto substitutes (complements) in utility this causes a fall (rise) in the marginal product of housework (again denoted in utility terms). Housework again drops.
6.