International comparisons
3.1. Introduction
In this section I present international comparisons of economic growth among the G7 nations - Canada, France, Germany, Italy, Japan, the United Kingdom, and the United States.
These comparisons focus on the impact of investment in IT equipment and software over the period 1980-2001. In 1998 the G7 nations accounted for nearly 60 percent of world output[478] and a much larger proportion of world investment in IT. Economic growth in the G7 has experienced a strong revival since 1995, driven by a powerful surge in IT investment.The resurgence of economic growth in the United States during the 1990s and the crucial role of IT investment has been thoroughly documented and widely discussed.[479] Similar trends in the other G7 economies have been more difficult to detect, partly because of discrepancies among official price indexes for IT equipment and software identified by Andrew Wyckoff (1995).[480] Paul Schreyer (2000) has constructed “internationally harmonized” IT prices that eliminate many of these discrepancies.[481]
Using internationally harmonized prices, I have analyzed the role of investment and total factor productivity as sources of growth in the G7 countries over the period 19802001. I have subdivided the period in 1989 and 1995 in order to focus on the most recent experience, particularly the post-1995 surge. I have decomposed growth of output for each country between growth of input and total factor productivity. Finally, I have allocated the growth of input between investments in tangible assets, especially information technology and software, and human capital.
Growth in IT capital input per capita jumped to double-digit levels in the G7 nations after 1995. This can be traced to acceleration in the rate of decline of IT prices, analyzed in my Presidential Address to the American Economic Association.[482] The powerful surge in investment was most pronounced in Canada, but capital input growth in the United States, the United Kingdom, and Japan was only slightly lower.
France, Germany, and Italy also experienced double-digit growth, but lagged considerably behind the leaders.During the 1980s total factor productivity played a minor role as a source of growth for the G7 countries except Japan, where total factor productivity accounted for 25 percent of economic growth. Total factor productivity accounted for only 15 percent of growth in the United States, 13 percent in France, 12 percent in the United Kingdom, and 11 percent in Germany; only 2 percent of growth in Canada was due to total factor productivity, while the decline of total factor productivity retarded growth by 14 percent in Italy. Between 1989 and 1995 total factor productivity growth declined further in the G7 nations, except for Italy and Germany. Total factor productivity declined for France and the United Kingdom but remained positive for the United States, Canada, and Japan.
Total factor productivity growth revived in all the G7 countries after 1995, with the exception of Germany and Italy, where it declined, and Japan, where it remained very similar. The resurgence was most dramatic in Canada, The United Kingdom, and France, partly offsetting years of dismal total factor productivity growth. Japan exhibited the highest growth in output per capita among the G7 nations from 1980 to 1995. Japan’s level of output per capita was the lowest in the G7. Japan’s total factor productivity growth far outstripped the other members of the G1 with the exception of the United Kingdombetween 1995-2001. Nonetheless, Japan’s total factor productivity remained the lowest among the G1 nations.
The United States led the G1 in output per capita for the period 1989-2000. Canada’s edge in output per capita in 1980 had disappeared by 1989. The United States led the G1 countries in input per capita during 1980-2000, but U.S. total factor productivity languished below the levels of Canada, France, and Italy.
In Section 3.2 I outline the methodology for this study, based on Section 2.
I have utilized the U.S. data presented there through 2001. Comparable data on investment in information technology have been constructed for Canada by Statistics Canada.[483] Data on information technology for France, Germany, Italy, and the United Kingdom have been developed for the European Commission by Bart Van Ark et al.[484] Finally, data for Japan have been assembled by myself and Kazuyuki Motohashi for the Research Institute on Economy, Trade, and Industry.[485] I have linked these data by means of the OECD’s purchasing power parities for 1999.[486]In Section 3.3 I consider the impact of IT investment and the relative importance of investment and total factor productivity in accounting for economic growth among the G1 nations. Investments in human capital and tangible assets, especially IT equipment and software, account for the overwhelming proportion of growth. Differences in the composition of capital and labor inputs are essential for identifying persistent international differences in output and accounting for the impact of IT investment.
In Section 3.4 I consider alternative approaches to international comparisons. The great revival of interest in economic growth among economists dates from Maddison’s (1982) updating and extension of Simon Kuznets’ (1911) long-term estimates of the growth of national product and population for 14 industrialized countries, including the G1 nations. Maddison (1982, 1991) added Austria and Finland to Kuznets’ list and presented growth rates covering periods beginning as early as 1820 and extending through 1989.
Maddison (1987, 1991) also generated growth accounts for major industrialized countries, but did not make level comparisons like those presented in Section 3.2 below. As a consequence, total factor productivity differences were omitted from the canonical formulation of “growth regressions” by William Baumol (1986). This proved to be a fatal flaw in Baumol’s regression model, remedied by Nazrul Islam’s (1995) panel data model.
Section 3.5 concludes.3.2. Investment and total factor productivity
My papers with Laurits Christensen and Dianne Cummings (1980, 1981) developed growth accounts for the United States and its major trading partners - Canada, France, Germany, Italy, Japan, Korea, The Netherlands, and the United Kingdom for 19471973. We employed GNP as a measure of output and incorporated constant quality indices of capital and labor input for each country. Our 1981 paper compared levels of output, inputs, and total factor productivity for all nine nations.
I have updated the estimates for the G7 - Canada, France, Germany, Italy, Japan, the United Kingdom, and the United States - through 1995 in earlier work. The updated estimates are presented in my papers with Chrys Dougherty (1996, 1997) and Eric Yip (2000). We have shown that total factor productivity accounted for only 11 percent of economic growth in Canada and the United States over the period 1960-1995.
My paper with [Jorgenson and Yip (2000)] attributed 47 percent of Japanese economic growth during the period 1960-1995 to total factor productivity growth. The proportion attributable to total factor productivity approximated 40 percent of growth for the four European countries - France (38 percent), Germany (42 percent), Italy (43 percent), and the United Kingdom (36 percent). Input growth predominated over productivity growth for all the G7 nations.
I have now incorporated new data on investment in information technology equipment and software for the G7. I have also employed internationally harmonized prices like those constructed by Schreyer (2000). As a consequence, I have been able to separate the contribution of capital input to economic growth into IT and non-IT components. While IT investment follows similar patterns in all the G7 nations, non-IT investment varies considerably and helps to explain important differences in growth rates among the G7.
3.2.1. Comparisons of output, input, and productivity
My first objective is to extend my estimates for the G7 nations with Christensen, Cummings, Dougherty, and Yip to the year 2001.
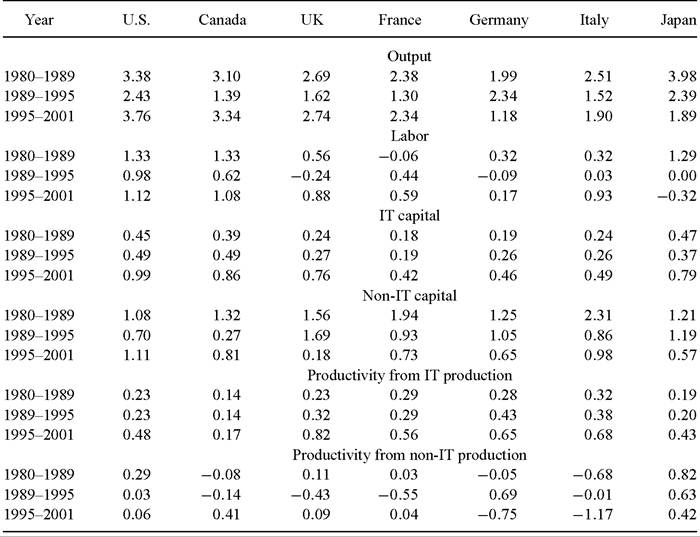
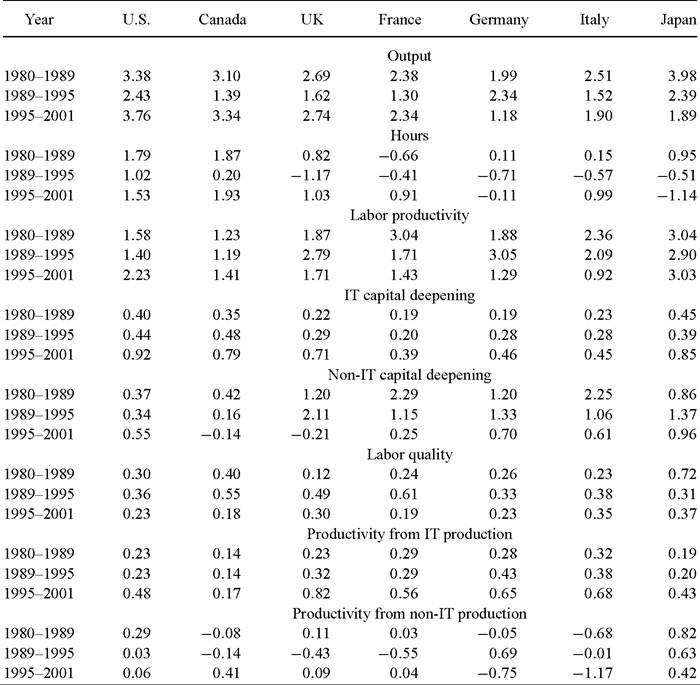
Following the methodology of my Presidential Address, I have chosen GDP as a measure of output. I have included imputations for the services of consumers’ durables as well as land, buildings, and equipment owned by nonprofit institutions. I have also distinguished between investments in IT equipment and software and investments in other forms of tangible assets.A constant quality index of capital input is based on weights that reflect differences in capital consumption, tax treatment, and the rate of decline of asset prices. I have derived estimates of capital input and property income from national accounting data. Similarly, a constant quality index of labor input is based on weights by age, sex, educational attainment, and employment status. I have constructed estimates of hours worked and labor compensation from labor force surveys for each country.
InTable 91 present output per capita for the G7 nations from 1980 to 2001, taking the United States as 100.0 in 2000. Output and population estimates are given separately in
Table 9
Levels of output and input per capita and total factor productivity
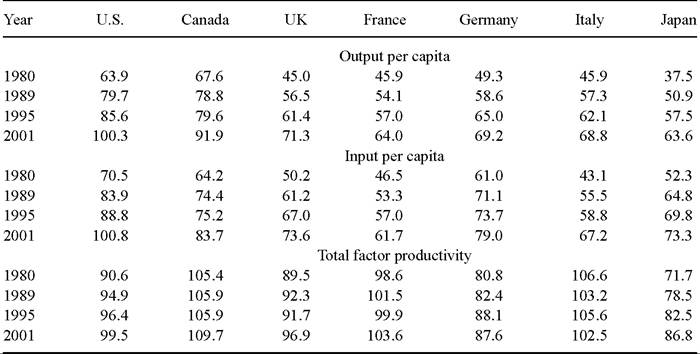
Note: U.S. = 100.0 in 2000, Canada data begins in1981.
Tables 10 and 11, respectively. I use 1999 purchasing power parities from the OECD to convert output from domestic prices for each country into U.S. dollars. The United States gained the lead among the G7 countries in output per capita after 1989. Canada led the United States in 1980, but fell behind in 1989. The U.S.-Canada gap widened considerably during the 1990s.
The four major European nations - the United Kingdom, France, Germany, and Italy - had very similar levels of output per capita throughout the period 1980-1989. Japanremainedinlastplacefrom 1980 to 2001, lagging considerably behind the United States and Canada, but only slightly behind France in 2001. Japan led the G7 in the growth of output per capita from 1980-1989, but fell behind all but Germany after 1995.
In Table 9 I present input per capita for the G7 over the period 1980-2001, taking the United States as 100.0 in 2000. I express input per capita in U.S. dollars, using purchasing power parities constructed for this study.[487] The United States was the leader among the G7 in input per capita throughout the period. In 2001 Canada ranked next to the United States with Germany third and the United Kingdom and Japan close behind. France and Italy started at the bottom of the ranking and remained there throughout the period.
Table 10
Growth rate and level of output
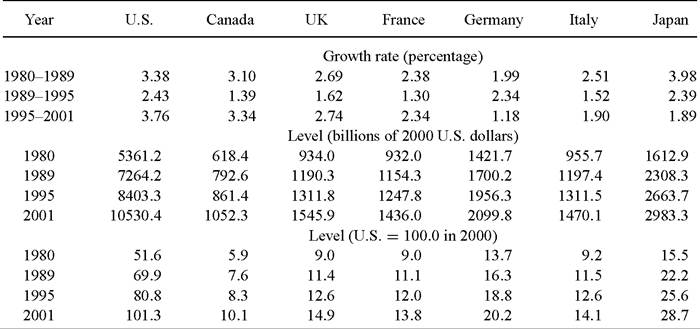
Note: Canada data begins in 1981.
Table 11
Growth rate and level in population
Note: Percentage, Canada data begins in 1981.
Finally, Table 9 presents total factor productivity levels for the G7 over the period 1980-2001. Total factor productivity is defined as the ratio of output to input, including both capital and labor inputs. Italy led in 1980 and Canada was the total factor
Table 12
Growth in output and input per capita and total factor productivity
Note: Percentage, Canada data begins in 1981.
productivity leader throughout the period 1989-2001 with France close behind. Japan made substantial gains in total factor productivity during the period, while there were more modest increases in the United States, Canada, the United Kingdom, France, and Germany, and a decline in Italy.
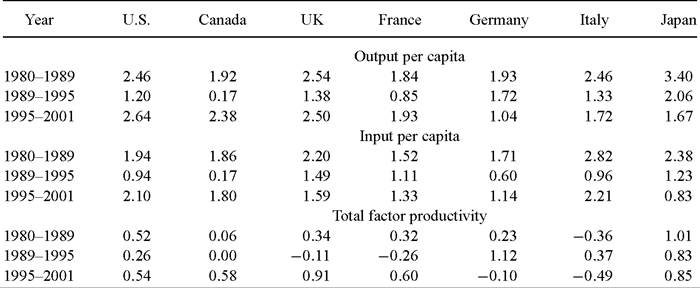
I summarize growth in output and input per capita and total factor productivity for the G7 nations in Table 12, while the growth rates of output and population for the period 1980-2001 in Tables 10 and 11. Output growth slowed in the G7 after 1989, but revived for all nations except Japan and Germany after 1995. Output per capita followed a similar pattern with Canada barely expanding during the period 1989-1995.
Japan led in growth of output in the 1980s, and output per capita through 1995, but fell to the lower echelon of the G7 after 1995. Japan also led in total factor productivity growth during the period 1980-1995. For all countries and all time periods, except for Germany during the period 1989-1995 and Japan after 1995, the growth of input per capita exceeded growth of total factor productivity by a substantial margin. Total factor productivity growth in the G7 slowed during the period 1989-1995, except for Germany and Italy, where total factor productivity slumped after 1995.
Italy led the G7 in growth of input per capita for the periods 1980-1989 and 19952001, but relinquished leadership to the United Kingdom for the period 1989-1995. Differences among input growth rates were smaller than differences among output growth rates, but there was a slowdown in input growth during 1989-1995 throughout the G7. After 1995 growth of input per capita increased in every G7 nation except Japan.
Table 13
Levels of capital input and capital stock per capita and capital quality
Note: U.S. = 100.0 in 2000, Canada data begins in 1981.
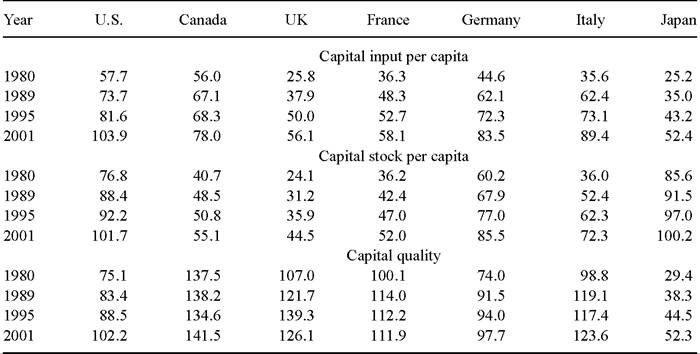
3.2.2. Comparisons of capital and labor quality
A constant quality index of capital input weights capital inputs by property compensation per unit of capital. By contrast an index of capital stock weights different types of capital by asset prices. The ratio of capital input to capital stock measures the average quality of a unit of capital. This represents the difference between the constant quality index of capital input and the index of capital stock employed, for example, by Kuznets (1971) and Solow (1970).
In Table 13 I present capital input per capita for the G7 countries over the period 1980-2001 relative to the United States in 2000. The United States was the leader in capital input per capita throughout the period, while Japan was the laggard. Canada led the remaining six countries in 1980, but was overtaken by Germany and Italy in 1995. Italy led the rest of the G7 through 2001, but lagged considerably behind the United States.
The picture for capital stock per capita has some similarities to capital input, but there are important differences. Capital stock levels do not accurately reflect the substitutions among capital inputs that accompany investments in tangible assets, especially investments in IT equipment and software. Japan led the G7 in capital stock per capita until 2001, when the United States took the lead. The United Kingdom lagged the remaining countries of the G7 throughout the period.
The behavior of capital quality highlights the differences between the constant quality index of capital input and capital stock. There are important changes in capital quality overtime and persistent differences among countries, so that heterogeneity in capital in-
Table 14
Levels of IT capital input and IT capital stock per capita and IT capital quality
Note: U.S. = 100.0 in 2000, Canada data begins in1981.
put must be taken into account in international comparisons of economic performance. Throughout the period 1980-2001, Canada led the G7 in capital quality, with the exception of the United Kingdom, which edged ahead in the mid 1990s. Japan remained at the bottom.
I summarize growth in capital input and capital stock per capita, as well as capital quality for the G7 nations in Table 16. Italy was the international leader in capital input growth from 1980-1989, while Canada was the laggard. The United Kingdom led from 1989-1995, while Canada lagged considerably behind the rest of the G7. The United States took the lead after 1995. There was a slowdown in capital input growth throughout the G7 after 1989, except for the United Kingdom, and a revival after 1995 in the United States, Canada, France, and Italy.
A constant quality index of labor input weights hours worked for different categories by labor compensation per hour. An index of hours worked fails to take quality differences into account. The ratio of labor input to hours worked measures the average quality of an hour of labor, as reflected in its marginal product. This represents the difference between the constant quality index of labor input and the index of hours worked employed, for example, by Kuznets (1971) and Solow (1970).
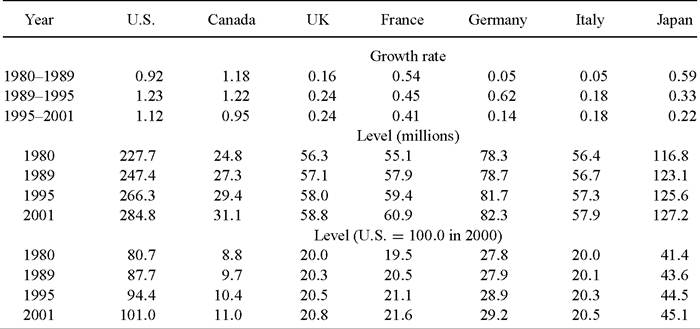
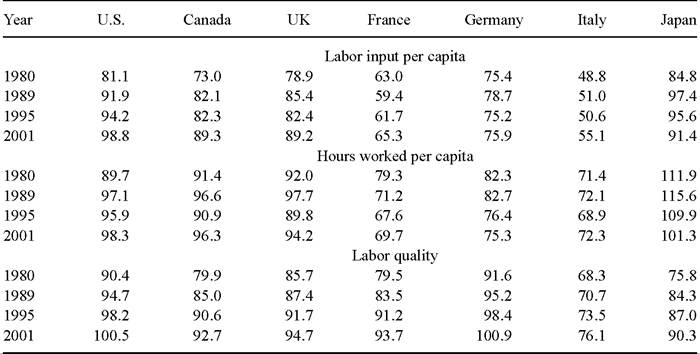
In Table 19 I present labor input per capita for the G7 nations for the period 19802001 relative to the United States in 2000. Japan was the international leader for the period 1980-1995 with the United States leading in 2001, and France and Italy the laggards. Labor input in Japan was nearly double that of Italy. The United States led the remaining G7 nations throughout the period. The United Kingdom ranked third among
Table 15
Levels of non-IT capital input and capital stock per capita and non-IT capital quality
Note: U.S. = 100.0 in2000, Canadadatabegins in1981.
Table 16
Growth in capital input and capital stock per capita and capital quality
id="Picutre 562" class="lazyload" data-src="/files/uch_group77/uch_pgroup302/uch_uch7198/image/image561.jpg">
Note: Percentage, Canada data begins in 1981.
the G7 through 1995. Italy and France lagged behind the rest of the G7 for the entire period.
The picture for hours worked per capita has some similarities to labor input, but there are important differences. Japan was the international leader in hours worked per capita. The United States, Canada, and the United Kingdom moved roughly in parallel.
Table 17
Growth in IT capital input and capital stock per capita and IT capital quality
Note: Percentage, Canada data begins in 1981.
Table 18
Growth in non-IT capital input and capital stock per capita and non-IT capital quality
Note: Percentage, Canada data begins in 1981.
The United Kingdom ranked second in 1980 and 1989, while the United States ranked second in 1995 and 2001. France and Italy lagged the rest of the G7 from 1980-2001.
The behavior of labor quality highlights the differences between labor input and hours worked. Germany was the leader in labor quality throughout the period 1980-2001 with the United States close behind. Canada, the United Kingdom, France, and Japan had similar levels of labor quality throughout the period, but fell short of German and U.S. levels. Italy was the laggard among the G7 in labor quality.
Table 19
Levels of labor input and hours worked per capita and labor quality
Note: U.S. = 100.0 in 2000, Canada data begins in 1981.
Table 20
Growth in labor input and hours worked per capita and labor quality
Note: Percentage, Canada data begins in 1981.
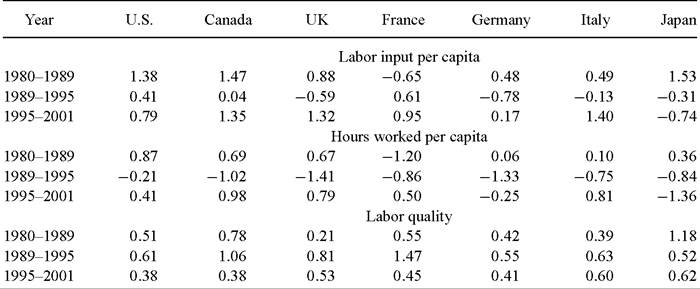
I summarize growth in labor input and hours worked per capita, as well as labor quality for the period 1980-2001 in Table 20. Canada and Japan led the G7 nations in labor input growth during the 1980s, France led from 1989-1995 but relinquished its leadership to Italy after 1995. Labor input growth was negative for France during the 1980s, for the United Kingdom, Germany, and Italy during the period 1989-1995, and for Japan after 1989.
Hours worked per capita fell continuously throughout the period 1980-2001 for Japan and declined for all the G7 nations during the period 1989-1995. Growthinlaborquality was positive for the G7 nations in all time periods. Japan was the leader during the 1980s, relinquishing its lead to France during the early 1990s and taking back the lead in the late 1990s. Growth in labor quality and hours worked are equally important as sources of growth in labor input for the G7.
3.2.3. The relative importance of investment and total factor productivity
Using data from Tables 9 and 10, I can assess the relative importance of investment and total factor productivity as sources of economic growth for the G7 nations. The main conclusion is that investments in tangible assets and human capital greatly predominated over total factor productivity during the period 1980-2001. While total factor productivity fell in Italy during this period, the remaining G7 countries had positive total factor productivity growth for the period as a whole.
Similarly, using data from Table 13 I can assess the relative importance of growth in capital stock and capital quality. Capital input growth was positive for all countries for the period 1980-2001 and all three sub-periods. Capital quality growth was positive for the period as a whole for all G7 countries. Although capital stock predominated in capital input growth, capital quality was also quantitatively significant, especially after 1995.
Finally, using data from Table 19 I can assess the relative importance of growth in hours worked and labor quality. Hours worked per capita declined for France, Germany, and Japan during the periods 1980-1989 and 1995-2001, while labor quality rose in these nations during the period 1980-2001. For the United States, Canada, the United Kingdom, and Italy, both hours worked per capita and labor quality rose. I conclude that labor quality growth is essential to the analysis of growth in labor input.
3.3. Investment in information technology
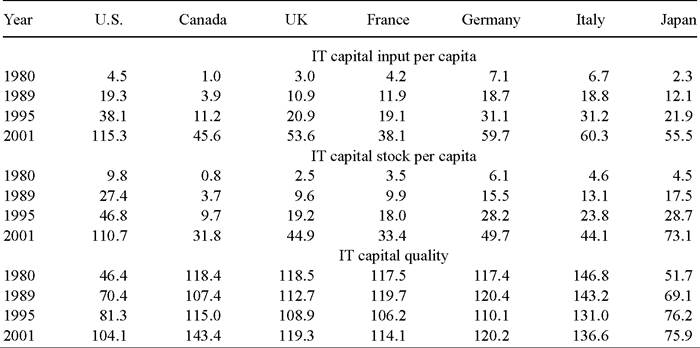
The final step in the comparison of patterns of economic growth among the G7 nations is to analyze the impact of investment in information technology equipment and software. In Table 141 present levels of IT capital input per capita for the G7 for the period 19802001, relative to the United States in 2000. The United States overtook Germany in 1989 and remained the leader through 2001. Canada and Japan lagged behind the rest of the G7 through 1995, but France fell into last place in 2001.
Table 14 reveals substantial differences between IT capital stock and IT capital input. The G7 nations began with very modest stocks of IT equipment and software per capita in 1980. These stocks expanded rapidly during the period 1980-2001. The United States led in IT capital stock throughout the period, while Japan moved from the third lowest level in 1980 to the second highest from 1989-2001.
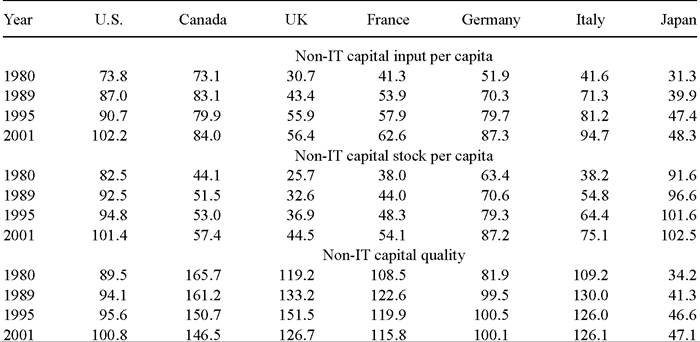
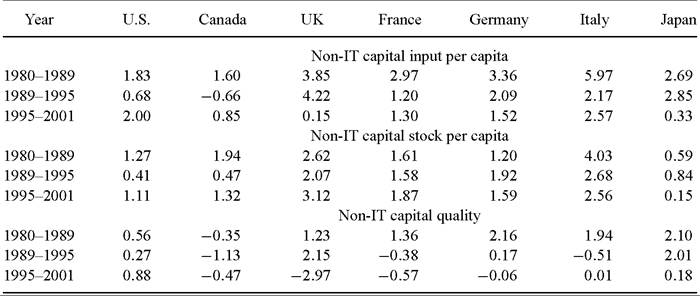
IT capital quality reflects differences in the composition of IT capital input, relative to IT capital stock. A rising level of capital quality indicates a shift toward short-lived assets, such as computers and software. This shift is particularly dramatic for the United States, Canada and Japan, while the composition of IT capital stock changed relatively less for the United Kingdom, France, Germany, and Italy. Patterns for non-IT capital input, capital stock, and capital quality in Table 15 largely reflect those for capital as a whole, presented in Table 13.
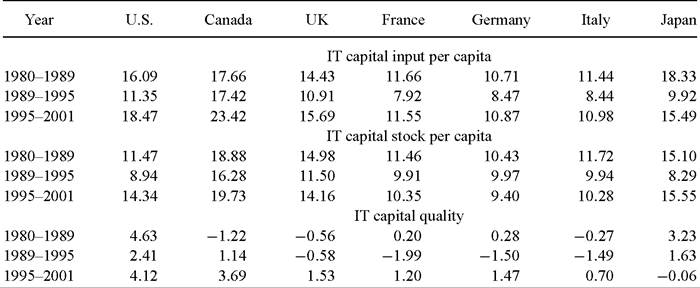
I present growth rates for IT capital input per capita, capital stock per capita, and capital quality in Table 17. The G7 nations have exhibited double-digit growth in IT capital input per capita since 1995. Canada was the international leader during this period with the United States close behind. Japan was the leader in growth of IT capital input during the 1980s, another period of double-digit growth in the G7. However, Japanese IT growth slowed substantially during 1989-1995 and Canada gained the lead.
Patterns of growth for IT capital stock per capita are similar to those for IT capital input for the four European countries. Changes in the composition of IT capital stock per capita were important sources of growth of IT capital input per capita for the United States, Canada, and Japan. IT capital stock also followed the pattern of IT capital input with substantial growth during the 1980s, followed by a pronounced lull during the period 1989-1995. After 1995 the growth rates of IT capital stock surged in all the G7 countries, except Germany, but exceeded the rates of the 1980s only for the United States and Japan.
Finally, growth rates for IT capital quality reflect the rates at which shorter-lived IT assets are substituted for longer-lived assets. The United States led in the growth of capital quality throughout the period. IT capital quality growth for the United States outstripped that of the remaining G7 countries for the period 1980-2001. Patterns of growth in non-IT capital input per capita, non-IT capital stock per capita, and non-IT capital quality given in Table 18 largely reflect those for capital as a whole presented in Table 16.
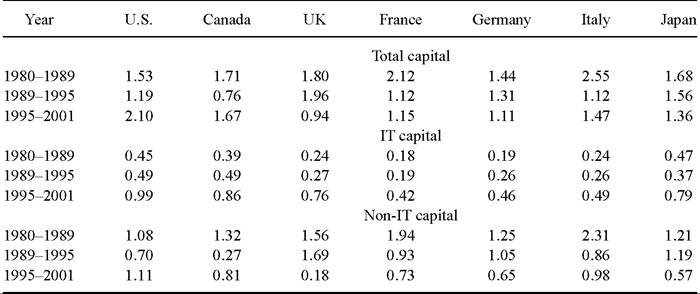
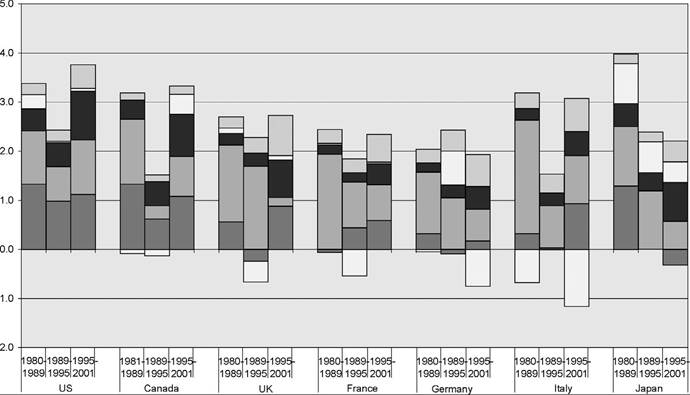
Table 21 and Figure 13 present the contribution of capital input to economic growth for the G7 nations, divided between IT and non-IT. The powerful surge of IT investment in the United States after 1995 is mirrored in similar jumps in growth rates of the contribution of IT capital through the G7. The contribution of IT capital input was similar during the 1980s and the period 1989-1995 for all the G7 nations, despite the dip in rates of economic growth after 1989. Japan is an exception to this general pattern with a contribution of IT capital comparable to that of the United States during the 1980s, followed by a decline in this contribution from 1989-1995, reflecting the sharp downturn in Japanese economic growth.
The contribution of non-IT capital input to economic growth after 1995 exceeded that for IT capital input for four of the G7 nations; the exceptions were Canada, the United Kingdom, and Japan. The United States stands out in the magnitude of the contribution of capital input after 1995. Both IT and non-IT capital input contributed to the U.S. economic resurgence of the last half of the 1990s. Despite the strong performance of IT
Table 21
Contribution of total capital, IT capital and non-IT capital to output growth
Note: Percentage. Contribution is growth rate times value share. Canada data begins in 1981.
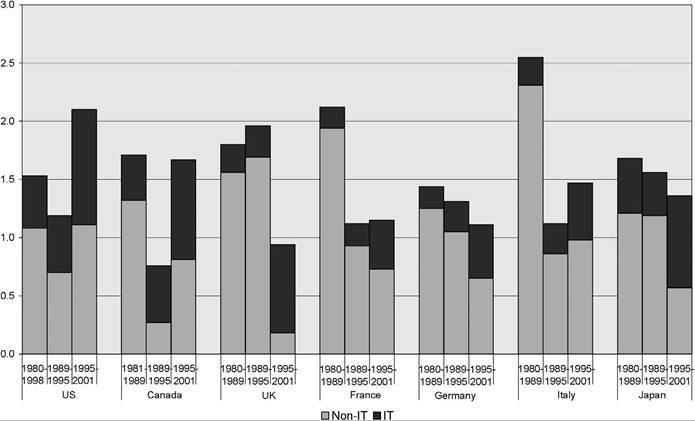
Figure 13. Capital input contribution by country.
investment in Japan after 1995, the contribution of capital input declined substantially; the pattern for the United Kingdom is similar.
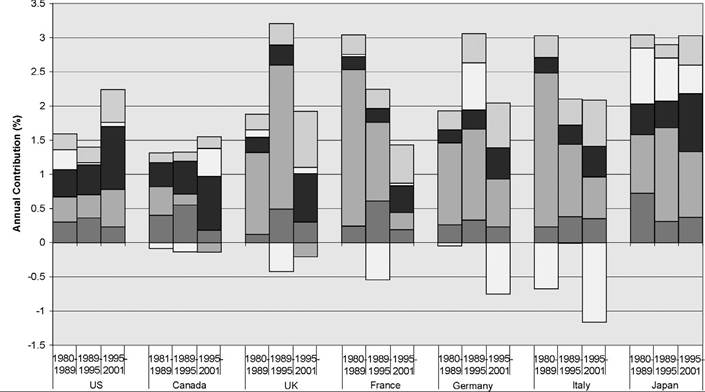
Table 22 and Figure 14 present contributions to economic growth from total factor productivity, divided between the IT-producing and non-IT-producing industries. The
Table 22
Contributions of productivity from IT and non-IT production to output growth
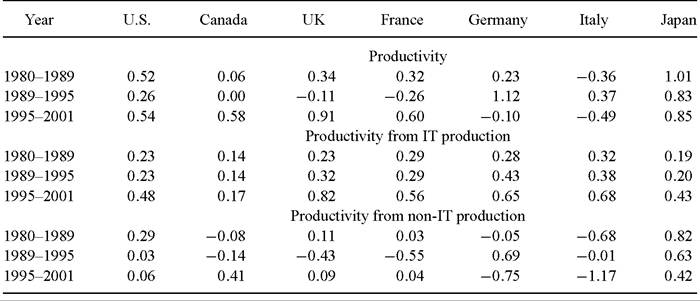
Note: Percentage. Canada data begins in 1981.
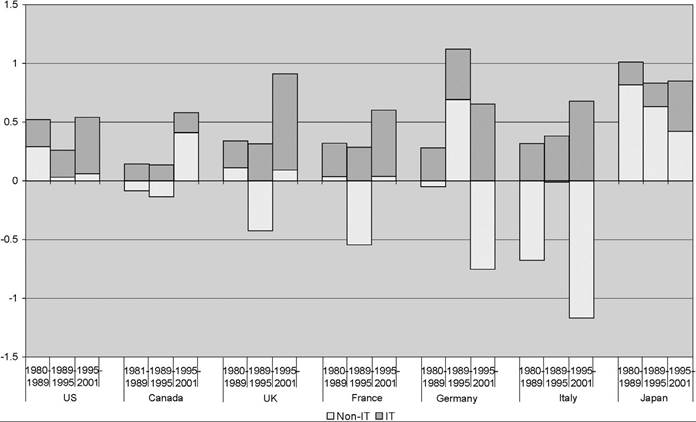
Figure 14. Sources of total factor productivity growth by country.
methodology for this division follows Triplett (1996). The contribution of IT-producing industries is positive throughout the period 1980-2001 and jumps substantially after 1995. Since the level of total factor productivity in Italy is higher in 1980 than in 2001, it is not surprising that the contribution of total factor productivity growth in the non-IT
Table 23
Sources of output growth
Note: Percentage. Contributions. Canada data begins in 1981.
industries was negative throughout the period. Total factor productivity in these industries declined after 1989 in the United Kingdom, France and Germany as well as Italy.
Table 23 and Figure 15 give a comprehensive view of the sources of economic growth for the G7. The contribution of capital input alone exceeds that of total factor productivity for most nations and most time periods. The contribution of non-IT capital input predominates over IT capital input for most countries and most time periods with Canada in 1989-2001, and the United Kingdom and Japan after 1995 as exceptions. This can be attributed to the unusual weakness in the growth of aggregate demand in these countries. The contribution of labor input varies considerably among the G7 nations with negative contributions after 1995 in Japan, during the 1980s in France, and during the period 1989-1995 in the United Kingdom and Germany.
Finally, Table 24 and Figure 16 translate sources of growth into sources of growth in average labor productivity (ALP). Average labor productivity, defined as output per hour worked, must be carefully distinguished from total factor productivity, defined as output per unit of both capital and labor inputs. Output growth is the sum of growth in
BLabor ? Non-IT Capital BIT Capital DNon-ITTotaI FactorProductivity ? IT Total FactorProductivity
Figure 15. Sources of economic growth by country.
BLaborQuality ?Non IT Capital Deepening BIT Capital Deepening DNon-ITTotaI FactorProductivity ? IT Total FactorProductivity
Figure 16. Sources of labor productivity growth by country.
Table 24
Sources of labor productivity growth
Note: Percentage. Contributions. Canada data begins in 1981.
hours worked and growth in ALP. Average labor productivity growth depends on the contribution of capital deepening, the contribution of growth in labor quality, and total factor productivity growth.
Capital deepening is the contribution of growth in capital input per hour worked and predominates over total factor productivity as a source of ALP growth for the G7 nations. IT capital deepening predominates over non-IT capital deepening in the United States throughout the period 1980-2001 and in Canada after 1989, the United Kingdom, and France after 1995. Finally, the contribution of labor quality is positive for all the G7 nations through the period.
3.4. Alternative approaches
Edward Denison’s (1967) path-breaking volume, Why Growth Rates Differ, compared differences in growth rates for national income net of capital consumption per capita for the period 1950-1962 with differences of levels in 1960 for eight European countries and the United States. The European countries were characterized by much more rapid growth and a lower level of national income per capita. However, this association did not hold for all comparisons between the individual countries and the United States. Nonetheless, Denison concluded:[488]
Aside from short-term aberrations Europe should be able to report higher growth rates, at least in national income per person employed, for a long time. Americans should expect this and not be disturbed by it.
Maddison (1987, 1991) constructed estimates of aggregate output, input, and total factor productivity growth for France, Germany, Japan, The Netherlands, and the United Kingdomforthe period 1870-1987. Maddison (1995) extended estimates for the United States, the United Kingdom, and Japan backward to 1820 and forward to 1992. He defined output as gross of capital consumption throughout the period and constructed constant quality indices of labor input for the period 1913-1984, but not for 1870-1913.
Maddison employed capital stock as a measure of the input of capital, ignoring the changes in the composition of capital stock that are such an important source of growth for the G7 nations. This omission is especially critical in assessing the impact of investment in information technology. Finally, he reduced the growth rate of the price index for investment by one percent per year for all countries and all time periods to correct for biases like those identified by Wyckoff (1995).
3.4.1. Comparisons without growth accounts
Kuznets (1971) provided elaborate comparisons of growth rates for 14 industrialized countries. Unlike Denison (1967), he did not provide level comparisons. Maddison (1982) filled this lacuna by comparing levels of national product for 16 countries. These comparisons used estimates of purchasing power parities by Irving Kravis, Alan Heston, and Robert Summers (1978).[489]
Maddison (1995) extended his long-term estimates of the growth of national product and population to 56 countries, covering the period 1820-1992. Maddison (2001) updated these estimates to 1998 in his magisterial volume, The World Economy: A Millennial Perspective. He provided estimates for 134 countries, as well as seven regions of the world - Western Europe, Western Offshoots (Australia, Canada, New Zealand, and the United States), Eastern Europe, Former USSR, Latin America, Asia, and Africa.
Purchasing power parities have been updated by successive versions of the Penn World Table. A complete list of these tables through Mark 5 is given by Summers and Heston (1991). The current version of the Penn World Table is available on the Center for International Comparisons website at the University of Pennsylvania (CICUP). This covers 168 countries for the period 1950-2000 and represents one of the most significant achievements in economic measurement of the post-war period.[490]
3.4.2. Convergence
Data presented by Kuznets (1971), Maddison, and successive versions of the Penn World Table have made it possible to reconsider the issue of convergence raised by Denison (1967). Moses Abramovitz (1986) was the first to take up the challenge by analyzing convergence of output per capita among Maddison’s 16 countries. He found that convergence characterized the post-war period, while there was no tendency toward convergence before 1914 and during the inter-war period. Baumol (1986) formalized these results by running a regression of growth rate of GDP per capita over the period 1870-1979 on the 1870 level of GDP per capita.[491]
In a highly innovative paper on “Crazy explanations for the productivity slowdown” Paul Romer (1987) derived Baumol’s “growth regression” from Solow’s (1970) growth model with a Cobb-Douglas production function. Romer’s empirical contribution was to extend the growth regressions from Maddison’s (1982) 16 advanced countries to the 115 countries in the Penn World Table (Mark 3). Romer’s key finding was an estimate of the elasticity of output with respect to capital close to three-quarters. The share of capital in GNP implied by Solow’s model was less than half as great.
Gregory Mankiw, David Romer and David Weil (1992) defended the traditional framework of Kuznets (1971) and Solow (1970). The empirical part of their study is based on data for 98 countries from the Penn World Table (Mark 4). Like Paul Romer (1987), Mankiw, David Romer, and Weil derived a growth regression from the Solow (1970) model; however, they augmented this by allowing for investment in human capital.
The results of Mankiw, David Romer and Weil (1992) provided empirical support for the augmented Solow model. There was clear evidence of the convergence predicted by the model; in addition, the estimated elasticity of output with respect to capital was in line with the share of capital in the value of output. The rate of convergence of output per capita was too slow to be consistent with the 1970 version of the Solow model, but supported the augmented version.
3.4.3. Modeling productivity differences
Finally, Islam (1995) exploited an important feature of the Penn World Table overlooked in prior studies. This panel data set contains benchmark comparisons of levels of the national product at five-year intervals, beginning in 1960. This made it possible to test an assumption maintained in growth regressions. These regressions had assumed identical levels of productivity for all countries included in the Penn World Table.
Substantial differences in levels of total factor productivity among countries have been documented by Denison (1967), by my papers with Christensen and Cummings (1981), Dougherty (1996,1997), and Yip (2000) and in Section 2 above. By introducing econometric methods forpanel data Islam (1995) was able to allow forthese differences. He corroborated the finding of Mankiw, David Romer and Weil (1992) that the elasticity of output with respect to capital input coincided with the share of capital in the value of output.
In addition, Islam (1995) found that the rate of convergence of output per capita among countries in the Penn World Table substantiated the unaugmented version of the Solow (1970) growth model. In short, “crazy explanations” for the productivity slowdown, like those propounded by Paul Romer (1987,1994), were unnecessary. Moreover, the model did not require augmentation by endogenous investment in human capital, as proposed by Mankiw, David Romer and Weil (1992).
Islam concluded that differences in technology among countries must be included in econometric models of growth rates. This requires econometric techniques for panel data, like those originated by Gary Chamberlain (1982), rather than the regression methods of Baumol, Paul Romer, and Mankiw, David Romer and Weil. Panel data techniques have now superseded regression methods in modeling differences in output per capita.
3.5. Conclusions
I conclude that a powerful surge in investment in information technology and equipment after 1995 characterizes all of the G7 economies. This accounts for a large portion of the resurgence in U.S. economic growth, but contributes substantially to economic growth in the remaining G7 economies as well. Another significant source of the G7 growth resurgence after 1995 is a jump in total factor productivity growth in IT-producing industries.
For Japan the dramatic upward leap in the impact of IT investment after 1995 was insufficient to overcome downward pressures from deficient growth of aggregate demand. This manifests itself in declining contributions of non-IT capital and labor inputs. Similar downturns are visible in non-IT capital input in France, Germany, and especially the United Kingdom after 1995.
These findings are based on new data and new methodology for analyzing the sources of economic growth. Internationally harmonized prices for information technology equipment and software are essential for capturing differences among the G7 nations. Constant quality indices of capital and labor inputs are necessary to incorporate the impacts of investments in information technology and human capital.
Exploiting the new data and methodology, I have been able to show that investment in tangible assets is the most important source of economic growth in the G7 nations. The contribution of capital input exceeds that of total factor productivity for all countries for all periods. The relative importance of total factor productivity growth is far less than suggested by the traditional methodology of Kuznets (1971) and Solow (1970), which is now obsolete.
The conclusion from Islam’s (1995) research is that the Solow (1970) model is appropriate for modeling the endogenous accumulation of tangible assets. It is unnecessary to endogenize human capital accumulation as well. The transition path to balanced growth equilibrium after a change in policies that affects investment in tangible assets requires decades, while the transition after a change affecting investment in human capital requires as much as a century.
4. Economics on internet time
The steadily rising importance of information technology has created new research opportunities in all areas of economics. Economic historians, led by Chandler (2000) and Moses Abramovitz and Paul David (1999, 2001),[492] have placed the information age in historical context. Abramovitz and David present sources of U.S. economic growth for the nineteenth and twentieth centuries. Their estimates, beginning in 1966, are based on the official productivity statistics published by the Bureau of Labor Statistics (1994).
The Solow (1987) Paradox, that we see computers everywhere but in the productivity statistics,[493] has been displaced by the economics of the information age. Computers have now left an indelible imprint on the productivity statistics. The remaining issue is whether the breathtaking speed of technological change in semiconductors differentiates this resurgence from previous periods of rapid growth?
Capital and labor markets have been severely impacted by information technology. Enormous uncertainty surrounds the relationship between equity valuations and future growth prospects of the American economy.[494] One theory attributes rising valuations of equities since the growth acceleration began in 1995 to the accumulation of intangible assets, such as intellectual property and organizational capital. An alternative theory treats the high valuations of technology stocks as a bubble that burst during the year 2000.
The behavior of labor markets also poses important puzzles. Widening wage differentials between workers with more and less education has been attributed to computerization of the workplace. A possible explanation could be that high-skilled workers are complementary to IT, while low-skilled workers are substitutable. An alternative explanation is that technical change associated with IT is skill-biased and increases the wages of high-skilled workers relative to low-skilled workers.[495]
Finally, information technology is altering product markets and business organizations, as attested by the large and growing business literature,[496] but a fully satisfactory model of the semiconductor industry remains to be developed.[497] Such a model would derive the demand for semiconductors from investment in information technology in response to rapidly falling IT prices. An important objective is to determine the product cycle for successive generations of new semiconductors endogenously.
The semiconductor industry and the information technology industries are global in their scope with an elaborate international division of labor.[498] This poses important questions about the American growth resurgence. Where is the evidence of a new economy in other leading industrialized countries? I have shown in Section 3 that the most important explanation is the relative paucity of constant quality price indexes for semiconductors and information technology in national accounting systems outside the United States.
The stagflation of the 1970s greatly undermined the Keynesian Revolution, leading to a New Classical Counter-revolution led by Lucas (1981) that has transformed macroeconomics. The unanticipated American growth revival of the 1990s has similar potential for altering economic perspectives. In fact, this is already foreshadowed in a steady stream of excellent books on the economics of information technology.[499] We are the fortunate beneficiaries of a new agenda for economic research that will refresh our thinking and revitalize our discipline.