0. Introduction
The world economy has experienced positive growth for an extended period of time. Figure 1 plots average world per capita income from 1500 to today, using data from Maddison’s classic study of long run trends in the world economy.
The most salient feature of the growth process is its nonlinear nature. For most of the past five hundred years, the world economy settled in a path of stagnation with little growth. But sometime around the early nineteenth century the world economy entered a path of sustained and even accelerating growth. While per capita income grew only by eighteen percent from 1500 to 1820, it has then grown by more than seven hundred and fifty percent from 1820 to today. And this growth has been far from steady. It averaged 0.53 percent from 1820 to 1870, and more than doubled to 1.30 from 1870 to 1913. Growth declined to 0.91 percent during the turbulent period that goes from 1913 to 1950, and then exploded to an unprecedented 2.93 percent from 1950 to 1973. Since then growth has markedly declined to 1.33 percent, even though this period still constitutes the second best growth performance in known human history.This economic growth has not been distributed equally across the different regions of the world economy. Figure 2 shows per capita income growth for the different regions of the world economy in various time periods. Differences in regional growth experiences are quite remarkable.[276] Growth took off in Western Europe and its offshoots in the early nineteenth century and never stopped again. But other regions took longer to participate in the growth of the world economy. Perhaps the most dramatic case is that of Asia, which basically did not grow until 1950 just to become then the fastest growing region in the world. Another extreme case is that of Africa, which still today is unable to enjoy growth rates that would be considered modest in other regions.
Another salient feature of the growth process is therefore its uneven geographical distribution: in each period there are some regions that have been able to grow and prosper, while others have been left behind.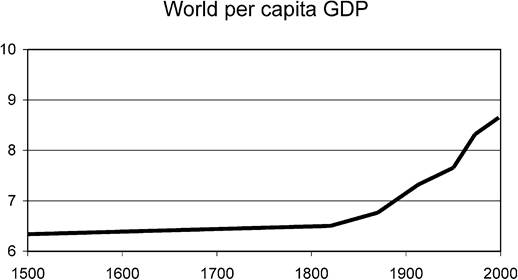
Figure 1. World per capita GDP. Notes. This figure shows the dynamics of world per capita GDP for the selected years 1500, 1820, 1870, 1913, 1950, 1973 and 1998 (in log of 1990 US$). Data are from Angus Maddison, “The World Economy - A Millennial Perspective”, Table 3-1b, p. 126.
World economic growth has been accompanied by more than proportional growth in world trade. Figure 3 shows the evolution of world trade as a share of world production since 1870. The picture is quite clear: from 1870 to 1998 growth in world trade has quadrupled growth in world income. There also appears to be a strong positive correlation between growth in per capita income and growth in trade. Figure 4 plots the growth rates of these two variables against each other using pooled data from various regions and periods. The simple correlation between these variables is 0.64, and the regression results indicate that regions and periods with X percent higher than average trade growth tend to have per capita income growth which is 0.3X higher than average. It almost goes without saying that this statistical association between income and trade does not imply causation in any direction. But it strongly suggests that these variables are somehow related, and that there might be substantial payoffs to working with theories that jointly determine them.[277]
Despite this apparent relationship between income and trade, a substantial part of growth theory is built on the assumption that countries live in autarky and that there is no trade among them.[278] This is obviously a dubious assumption. But is it also a “crucial” one? And if so, what alternative assumptions would be reasonably realistic? At an abstract level, these are the questions that I attempt to answer here.
A recurring theme throughout this chapter is that the growth experiences of the different world regions arePer capita GDP Growth
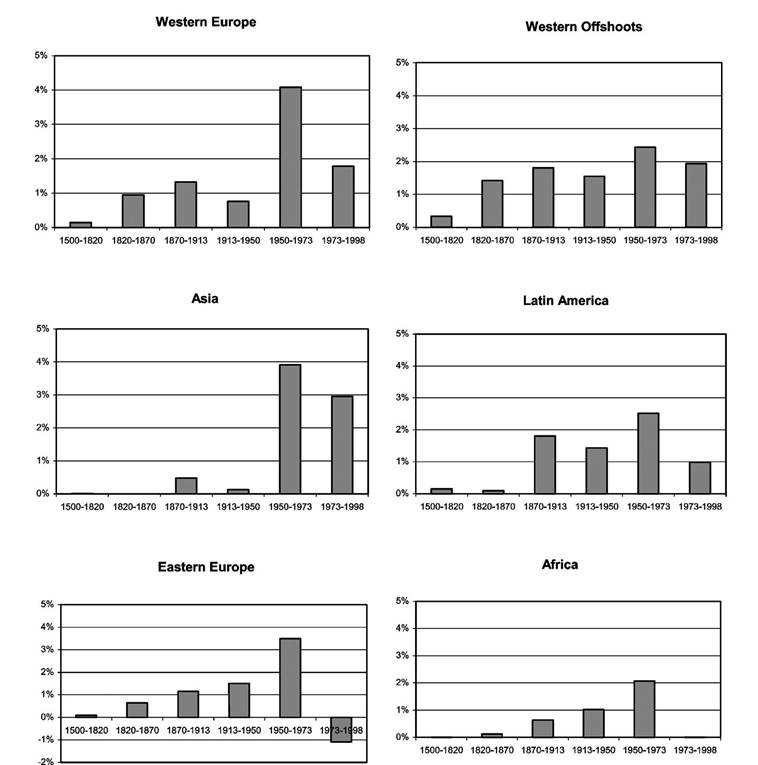
Figure 2. Per capita GDP growth. Notes. This figure shows average annual growth rates by major world regions for selected periods. Data are derived from Angus Maddison, “The World Economy - A Millennial Perspective”, Table 3-1b, p. 126. (Western Europe contains Austria, Belgium, Denmark, Finland, France, Germany, Italy, Netherlands, Norway, Sweden, Switzerland, UK, Portugal, Spain, Greece and 13 small countries; Western Offshoots are United States, Canada, Australia and New Zealand; Asia is China, India, Japan, Korea, Indonesia, Indochina, Iran, Turkey and Other East and West Asian countries; Latin America includes Brazil, Mexico, Peru, and others; Eastern Europe contains Albania, Bulgaria, Hungary, Poland, Romania and territories of former Czechoslovakia and Yugoslavia; Africa is Egypt and others.)
World Exports as Share of World GDP
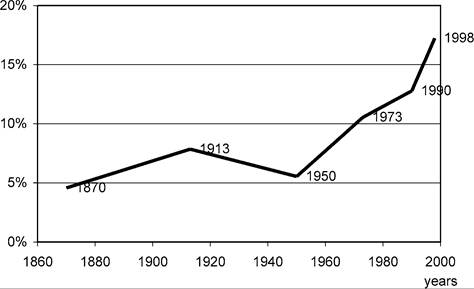
Figure 3. World exports as share of world GDP. Notes. The figure shows volume of world exports over world GDP (in constant US$) for selected dates. Data are from Tables 3-1b, A1-b, A2-b, A3-b, A4-b, pp. 126, 184, 194, 214 and 223 in Angus Maddison, “The World Economy - A Millennial Perspective”.
Growth of Income and Trade
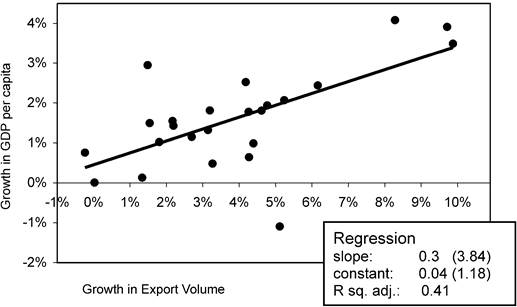
Figure 4. Growth of income and trade. Notes. This figure plots annualized rate of trade growth against annualized rate of per capita GDP growth for major world regions and selected periods. The regions are Western Europe, Western Offshoots, Eastern Europe and former USSR, Latin America, Asia and Africa. Periods are 1870-1913, 1913-1950, 1950-1973 and 1973-1998. Each data point stands for one region during one period.
The solid line represents the prediction of a linear regression. The estimated regression are reported in the box, t-statistics are in brackets. Data are from Angus Maddison, “The World Economy - A Millennial Perspective”. Data for GDP growth are obtained from Table 3-1b, p. 126, and Table B-10, p. 241 (to include Japan). Data for export growth are derived from Table F-3, p. 362, and Tables A1-b, A2-b, A3-b and A4-b, pp. 184, 194, 214 and 223, respectively.intimately linked and cannot be analyzed in isolation. We therefore need a global view of economic growth that looks at the different regions of the world as parts of a single whole. Formally, this means that we should develop and systematically study world equilibrium models. These models and their predictions constitute the specific focus of this chapter.[279]
Rather than providing an all-encompassing survey of the field, my goal in writing this chapter has been to develop a unified and yet tractable framework to discuss key insights of the fields of international trade and economic growth. In particular, I examine a sequence of world equilibrium models that share a common description of technology and preferences but differ on their assumptions about trade frictions. By comparing the predictions of these models against each other, it is possible to identify a variety of channels through which trade affects the evolution of world income and its geographical distribution. By comparing their predictions against the data, it is also possible to construct coherent explanations of income differences and long run trends in economic growth. When viewed as a group, these models show that much is known about the relationship between income and trade. Despite this, I still feel we are only exploring the tip of the iceberg. The research program sketched here is ambitious, fun and it could eventually lead to a much deeper understanding of the forces that drive modern capitalist economies.
The rest of this chapter contains four sections. The first one describes growth in the integrated economy. This is an imaginary world where trade costs are negligible and geography does not matter. Section 2 introduces two trade frictions: the immobility of production factors and the absence of international financial markets. Section 3 adds
a third trade friction: costs of transporting goods. The fourth and final section briefly concludes by taking stock what we have learned and pointing out potential avenues for further research.
1.