Model prediction
6.1. Model forecasting
Given a nation’s initial values of Hi60 and Bi (60), our transition Equation (4.4) gives us a predicted value of B at the end of our sample in 1995.
Figure 2 displays the predicted values of Bi (95) conditional on Hi60 and Bi (60). One can see the logistic 5 form, consistent with a logistic model of technology diffusion, of our predicted values from our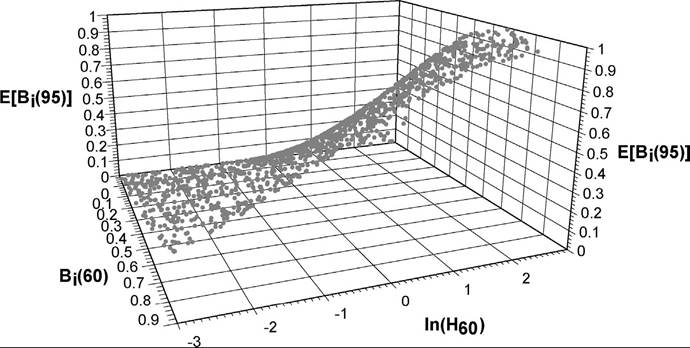
Figure 2. Predicted values of B∙(1995). Predicted values of B∙(95) are based on initial backwardness in TFP, Bi (60), and the log of initial stock of human capital. Bi(t) represents the ratio of TFP in country i to TFP in the leader country (United States) at time t. The sample encompasses the entire range of values for backwardness and human capital.
estimation above. Countries which have both low initial total factor productivity relative to the leader and low levels of human capital are in the low-growth portion of the plane: their predicted 1995 total factor productivity levels relative to the leader lie close to, or even below, their 1960 values. There is then a rapid acceleration in the middle range, tapering off as nations approach the total factor productivity levels of the leader.
We show both the actual realizations and the predictions of our model in Figure 3. Expected values of Bi (95) for the nations in our sample based on Equation (4.4) are plotted against their realized values in 1995. The model does a fairly good job of predicting relative future productivity levels. As a measure of our goodness of fit, we calculated the coefficient of determination of the model. The ratio of residual sum-of-squared errors to the variation in the sample was only 0.115, which would correspond to an R-squared of 88.5 percent.
However, there does appear to be some systematic errors in our forecasts. In particular, we seem to be systematically overestimating relative total factor productivity growth for the least backward, highest initial productivity countries like the Asian Tigers, so that the residuals for these countries are nearly all negative. This result, which suggests an even more pronounced s curve, is puzzling, but appears to leave room for future refinements in our theory.
6.3. Negative catch-up countries
A more qualitative metric of the quality of fit of our model is how well it makes the discrete prediction of whether countries will be on a positive catch-up path or not. The
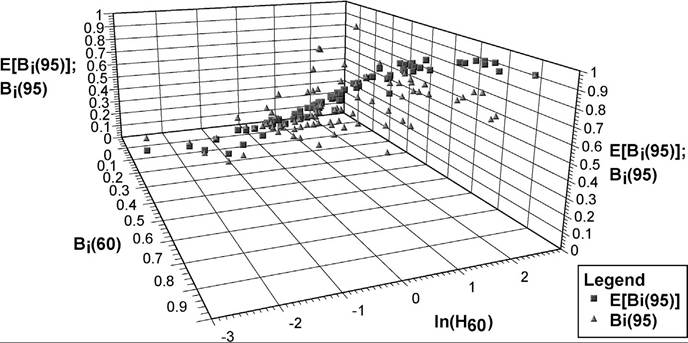
Figure 3. Predicted and actual values of Bi (1995). Predicted values of Bi (95) are based on initial backwardness in TFP, Bi (60), andthe log ofinitial stockofhuman capital. Bi (t) represents the ratio ofTFP in country i to TFP in the leader country (United States) at time t. The sample includes observed data points only.
theory above suggests that below a certain threshold level of human capital, relative to the leader nation, a country could find its total factor productivity growth sufficiently slow that it would not exhibit convergence in total factor productivity, but would instead fall farther and farther behind the leader nation over time. In particular, we can re-write the “catch-up condition” in Equation (4.7) as

where hmt represents the log of human capital in the leader nation at time t. Countries that find themselves with human capital stocks below H*t will experience total factor productivity growth at a slower pace than the leader country.
Table 5 shows the point estimates for g, c, and s based on our estimation results for Models 1 through 4 in Tables 2 and 3.
As we discussed above, we cannot calculate a critical human capital stock for Model 1 in Table 2 because of our negative point estimate for g. Consequently, we concentrate on the point estimates obtained in Model 2 of Table 2, where the specification excludes a constant term independent of human capital. As we show below, our estimates of the critical human capital stocks are similar for all of our models.With the United States as our leader in total factor productivity, the point estimates obtained with Model 2 indicate that countries with average schooling in the population over the age of 25 below 1.78 years will display slower total factor productivity growth than the leader nation. We note that the critical human capital stocks were relatively insensitive to model specification or the use of initial or average human capital levels.
Table 5
Point estimates
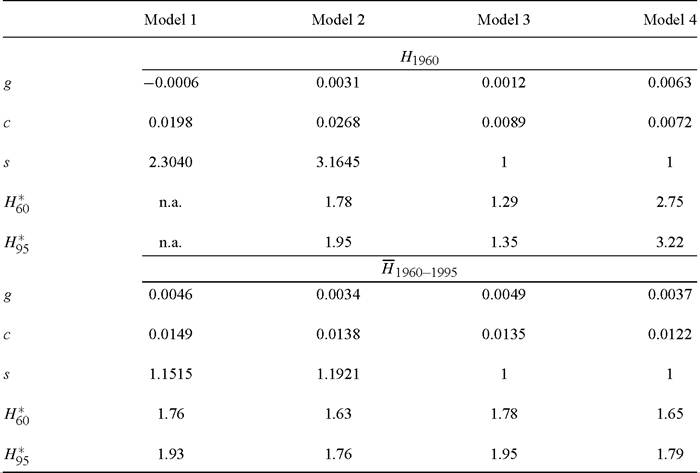
Note: g, c, and 5 are obtained from the point estimates presented in Tables 2 and 3. H6o and H95 represent the minimal initial estimated stock of human capital needed for positive predicted growth relative to the leader nation.
Similarly, we can also calculate the average years of schooling in the population needed to experience faster total factor productivity growth than the United States in 1995. Because of the increase in average years of schooling in the United States, the point estimates for H*95 are uniformly larger than those for H*60. Again using our point estimates from Model 2, we estimate the critical level of average years of schooling in the population to be 1.95. This increase in the threshold level of human capital is due to the fact that with a larger stock of human capital, the leader nation will be innovating at a faster pace. Consequently, other nations will need to exhibit a faster pace of catch-up to experience faster total factor productivity growth than the leader.
We use these estimated critical human capital stocks to conduct 2 explorations in the data. First, we can identify nations in our sample that would be predicted to exhibit slower growth in total factor productivity than the United States in 1960. This would include all nations with human capital levels in 1960 below 1.78 years of schooling. Our results are shown in Table 2. Based on our point estimates, we identify 27 nations as being below the critical human capital stock level in 1965. These nations are listed in Table 6, along with their average initial human capital stock levels.
Table 6
Nations with slow TFP growth (1960)
| Country | h∣960 | (TFP growth*-) - (TFP growthUSA) |
| Nepal | 0.07 | -0.0072 |
| Mali | 0.17 | -0.0199 |
| Niger | 0.20 | -0.0297 |
| Mozambique | 0.26 | -0.0307 |
| Togo | 0.32 | -0.0172 |
| Central African Republic | 0.39 | -0.0295 |
| Iran | 0.63 | -0.0050 |
| Pakistan | 0.63 | 0.0063 |
| Ghana | 0.69 | -0.0067 |
| Bangladesh | 0.79 | -0.0084 |
| Algeria | 0.97 | -0.0067 |
| Syria | 0.99 | 0.0034 |
| Uganda | 1.10 | -0.0090 |
| Indonesia | 1.11 | 0.0095 |
| Papua New Guinea | 1.13 | -0.0057 |
| Kenya | 1.20 | -0.0061 |
| Cameroon | 1.37 | -0.0169 |
| Jordan | 1.40 | -0.0082 |
| Guatemala | 1.43 | -0.0067 |
| India | 1.45 | 0.0013 |
| Botswana | 1.46 | 0.0168 |
| Zimbabwe | 1.54 | -0.0002 |
| Senegal | 1.60 | -0.0198 |
| Zambia | 1.60 | -0.0238 |
| Honduras | 1.69 | -0.0122 |
| Malawi | 1.70 | -0.0070 |
| El Salvador | 1.70 | -0.0116 |
Note: The nations listed are those with 1960 human capital levels below 1.78, the minimum needed for TFP catchup according to Model 2 in Table 2.
The second column examines the growth performance of these nations over the subsequent 35 years in our sample. While it is not a formal test of our model, it is rather striking that 22 of the 27 nations predicted to exhibit slower total factor productivity growth than the United States actually did so over the course of our sample. This is markedly different than the overall sample share, where 49 of the 84 countries exhibited faster total factor productivity growth than the United States. Consequently, the subsequent performance of these nations appears to support the possibility of a logistic form of technology diffusion.
Our second data exploration concerns the question of whether there are any nations that are still below the critical human capital stock, so that they are expected to have slower total factor productivity growth than the United States in the future. We investigate this question using our 1995 data. As mentioned above, the critical human capital
Table 7
Nations with slow TFP growth (1995)
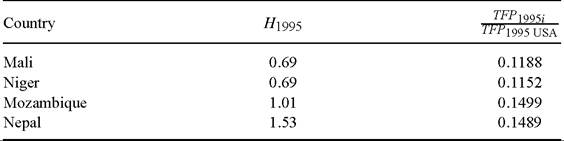
Note: the nations listed are those with 1995 human capital levels below 1.95, the minimum needed for TFP catchup according to Model 2 in Table 2. For the full 84 country sample, T^f1995i = 0.4377.
tfp1995 USA
stock using any model specification is estimated to have increased slightly between 1960 and 1995, from 1.78 average years of schooling to 1.95. Nevertheless, the good news is that because many developing nations have made substantial efforts to increase primary education rates in their populations, there are few countries who failed to meet this criterion in 1995.
The four nations that fell below the critical human capital level in 1995 are listed in Table 7. They are Mali, Niger, Mozambique and Nepal. While the success of the rest of the world in acquiring sufficient human capital to be on positive catch-up path in total factor productivity is reassuring, the situation faced by these four nations is still alarming. As shown in Table 7, none of these nations has a total factor productivity level exceeding 15 percent of that in the United States. In contrast, the average ratio of the total factor productivity of a nation in our sample to that of the United States is approximately 44 percent. Our model therefore predicts that these nations will remain notably poor in the absence some sort of policy intervention.
7.