Variations on the Nelson-Phelps model
We will examine the implications of two types processes often studied in the context of disaggregated models of technology diffusion [Banks (1994)]. We can express the original Nelson-Phelps model of technology diffusion as follows:
AAA = g(Hi(t)} + e(Hi(t)} AAA - 1 (2.1)
Ai(t) g t()’^ V i() Ai(t)
[1] Note however that in transition, the higher is initial A / (O), the smaller is the technology gap to the leader and therefore the slower is the growth.
This negative dependence on initial conditions is similar to standard convergence results in the neoclassical growth model, but the logic of catch-up is different.
Equation (2.6) implies that in the case of the logistic diffusion model, the steady state growth relationship will depend on the relative magnitude of the catch-up rate and the difference in the growth rate due to innovation, gm - gi. If the catch-up rate exceeds the differential growth rate solely due to educational differences between the leader and follower, that is if c(Hi) + g(Hi) — g(Hm) > 0, then the leader will have a locomotive effect and pull the followers along. In such a case growth rates will converge. However, if the education level of a follower is so low that c(Hi) + g(Hi) — g(Hm) < 0, then the follower will not be able to keep up, growth rates will diverge, and the income ratio of the follower to the leader will go to zero.
This highlights the critical role of the type of technology diffusion process and its interaction with education in fostering economic growth: a country with a low level of education may still keep within the gravitational pull of the technology leader, provided that the level of education is high enough to permit sufficient diffusion.
If technology diffusion is of the logistic type, countries with educational levels that are too low will get left behind and we may observe the phenomenon of “convergence clubs”. Escaping from the lower “club” is nevertheless possible through investments in human capital, as discussed by Basu and Weil (1998).8 The implications of logistic versus exponential technology diffusion for economic growth can therefore be quite divergent.Note that we can append the Nelson-Phelps framework, either in the logistic or the confined exponential form, to the Romer (1990) model by adding the catch-up term the research sector producing the blueprints A. The marginal product of H in the research sector will now reflect an effect from the catch-up term, and increase the allocation of H towards the research sector away from production or leisure. If, as in Romer, we assume that H is constant while knowledge, A, is accumulated, and also assume that goods use labor but not H, we may focus on the allocation of H to imitation through catch-up or to innovation. Adopting a linear specification with g(Hi) = gHi, c(Hi) = cHi, the marginal product of H in innovation is given by gAi (t) while in imitation, for the con- C nι-∣z-l the Asia crisis of 1997. Nevertheless, the set of countries exhibiting high total factor productivity growth seems intuitive as well.
A simple scatter plot of initial human capital levels and subsequent total factor productivity growth over the estimation period is shown in Figure 1. The raw correlation between these two variables is clearly positive, suggesting that nations with larger initial human capital stocks tend to exhibit higher total factor productivity growth holding all else constant. There are a number of interesting outliers. The Asian tiger nations are noteworthy as nations that exhibited fast total factor productivity growth and began the estimation period with relatively stocks of initial human capital.[553] [554] On the other hand,
Table 1
Total factor productivity estimates (1960-1995)
| Country | logTFP1960 | logTFP1995 | Average annual log growth of TFP (1960-1995) |
| Mozambique | 0.5010 | -0.0353 | -0.0153 |
| Niger | 0.2045 | -0.2983 | -0.0144 |
| Central African Rep. | 0.4180 | -0.0791 | -0.0142 |
| Nicaragua | 0.4487 | 0.0546 | -0.0113 |
| Zambia | -0.2912 | -0.5857 | -0.0084 |
| Mali | -0.1092 | -0.2677 | -0.0045 |
| Senegal | 0.3209 | 0.1634 | -0.0045 |
| Venezuela | 1.0141 | 0.9306 | -0.0024 |
| Togo | -0.1249 | -0.1917 | -0.0019 |
| Cameroon | 0.3181 | 0.2649 | -0.0015 |
| Tanzania | -1.0572 | -1.0181 | 0.0011 |
| Bolivia | 0.3817 | 0.4642 | 0.0024 |
| Honduras | 0.1513 | 0.2597 | 0.0031 |
| El Salvador | 0.7495 | 0.8820 | 0.0038 |
| Guyana | 0.0168 | 0.1989 | 0.0052 |
| Peru | 0.4039 | 0.6054 | 0.0058 |
| Argentina | 0.9538 | 1.1675 | 0.0061 |
| Uganda | 0.0519 | 0.2721 | 0.0063 |
| South Africa | 0.8463 | 1.0689 | 0.0064 |
| Jamaica | 0.2297 | 0.4554 | 0.0064 |
| Philippines | 0.2176 | 0.4506 | 0.0067 |
| Costa Rica | 0.6131 | 0.8480 | 0.0067 |
| Bangladesh | -0.0997 | 0.1442 | 0.0070 |
| Jordan | 0.4289 | 0.6773 | 0.0071 |
| New Zealand | 1.1840 | 1.4505 | 0.0076 |
| Uruguay | 0.8978 | 1.1733 | 0.0079 |
| Nepal | -0.3250 | -0.0416 | 0.0081 |
| Malawi | -0.7672 | -0.4742 | 0.0084 |
| Algeria | 0.3615 | 0.6622 | 0.0086 |
| Ghana | -0.2121 | 0.0893 | 0.0086 |
| Guatemala | 0.5197 | 0.8215 | 0.0086 |
| Switzerland | 1.2467 | 1.5526 | 0.0087 |
| Kenya | -0.2842 | 0.0390 | 0.0092 |
| Mexico | 0.6282 | 0.9549 | 0.0093 |
| Papua New Guinea | 0.3175 | 0.6532 | 0.0096 |
| Iran | 0.3787 | 0.7390 | 0.0103 |
| Lesotho | -0.4715 | -0.1054 | 0.0105 |
| Trinidad and Tobago | 0.8535 | 1.2695 | 0.0119 |
| Fiji | 0.3940 | 0.8118 | 0.0119 |
| Ecuador | 0.1191 | 0.5526 | 0.0124 |
| Sweden | 1.0855 | 1.5350 | 0.0128 |
| Dominican Rep. | 0.2220 | 0.6859 | 0.0133 |
| United Kingdom | 1.1090 | 1.5778 | 0.0134 |
| Canada | 1.1711 | 1.6541 | 0.0138 |
Table 1
(Continued')
| Country | logTFP1960 | logTFP1995 | Average annual log growth of TFP (1960-1995) |
| Australia | 1.1472 | 1.6339 | 0.0139 |
| Denmark | 1.1227 | 1.6215 | 0.0143 |
| Paraguay | 0.4728 | 0.9894 | 0.0148 |
| Turkey | 0.4371 | 0.9546 | 0.0148 |
| Colombia | 0.4648 | 0.9855 | 0.0149 |
| Netherlands | 1.0327 | 1.5617 | 0.0151 |
| Zimbabwe | -0.2344 | 0.2948 | 0.0151 |
| United States | 1.3257 | bgcolor=white>1.86260.0153 | |
| Sri Lanka | 0.0648 | 0.6074 | 0.0155 |
| Finland | 0.8676 | 1.4237 | 0.0159 |
| Iceland | 0.9602 | 1.5301 | 0.0163 |
| Chile | 0.6381 | 1.2141 | 0.0165 |
| India | -0.2360 | 0.3458 | 0.0166 |
| Panama | 0.2486 | 0.8324 | 0.0167 |
| France | 0.9176 | 1.5088 | 0.0169 |
| Ireland | 0.8202 | 1.6031 | 0.0182 |
| Belgium | 0.9147 | 1.5555 | 0.0183 |
| Syria | 0.1391 | 0.7957 | 0.0188 |
| Brazil | 0.2618 | 0.9204 | 0.0188 |
| Greece | 0.5097 | 1.1877 | 0.0194 |
| Austria | 0.8583 | 1.5445 | 0.0196 |
| Norway | 0.8808 | 1.5879 | 0.0202 |
| Italy | 0.8291 | 1.5379 | 0.0202 |
| Israel | 0.7494 | 1.4757 | 0.0163 |
| Pakistan | -0.4390 | 0.3175 | 0.0216 |
| Spain | 0.6153 | 1.4203 | 0.0230 |
| Mauritius | 0.6394 | 1.4829 | 0.0241 |
| Portugal | 0.4739 | 1.3254 | 0.0243 |
| Indonesia | -0.1621 | 0.7056 | 0.0248 |
| Barbados | 0.5475 | 1.4540 | 0.0259 |
| Malaysia | 0.2549 | 1.1852 | 0.0266 |
| Romania | -0.3987 | 0.5327 | 0.0266 |
| Japan | 0.5632 | 1.5851 | 0.0292 |
| Botswana | -0.1326 | 0.9935 | 0.0322 |
| Cyprus | 0.3582 | 1.5217 | 0.0332 |
| Thailand | -0.3058 | 0.9102 | 0.0347 |
| Hong Kong | 0.4578 | 1.8604 | 0.0401 |
| Rep. of Korea | -0.0429 | 1.3646 | 0.0402 |
| Singapore | 0.1202 | 1.6285 | 0.0431 |
| Rep. of China, Taiwan | 0.1046 | 1.6140 | 0.0431 |
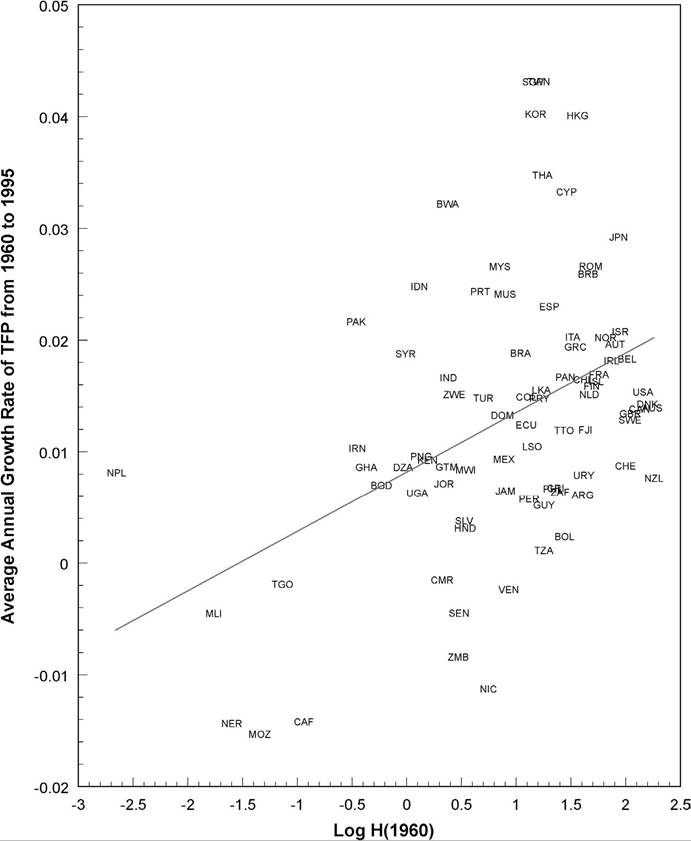
Figure 1. TFP growth vs initial human capital.
there are a number of countries that exhibited total factor productivity declines that began the period with exceptionally low levels of initial human capital, including Mali, Niger, Togo, Mozambique, and the Central African Republic.
5.2. Model specification
As discussed above, the following non-linear cross-sectional specification nests the exponential and logistic functional forms of technology diffusion

where Aai represents the average annual growth rate in TFP of country i, hi represents the log of country i's stock of human capital, Ai represents the level of country i's stock of TFP, Am represents the level of TFP of the leader nation, and εi is an i.i.d. disturbance term. The coefficients to be estimated represent b, g + c, — c, and s respectively.
We are agnostic as to whether it is appropriate to include the constant term b. This term could be interpreted as exogenous technological progress that is independent of human capital and technology diffusion. It is difficult to envision any type of technological progress that would be common across our sample and completely independent of the levels of national human capital. In the case where “accidental technological progress” truly does take place, it is far more likely that it would appear in our error term as it would be confined to specific nations within our sample.
Nevertheless, we report our estimation results both without and with the constant terms included as a measure of their robustness.Our model nests two alternative hypotheses. First, we have our Nelson-Phelps type model of technology diffusion, dependent on human capital and technological backwardness, that is of the confined exponential type. As we noted above, this model would correspond to the above specification with s equal to —1. Second, we have our logistic specification for the technology diffusion process, which would correspond to s being equal to 1. We therefore estimate the above nested model to let the data determine the appropriate value of s.
Because our model is non-linear, we cannot use the differenced panel estimators for cross-country growth regressions that have become popular in the literature [e.g. Caselli, Esquivel and Lefort (1996), Easterly, Loayza and Montiel (1997), and Benhabib and Spiegel (2000)]. Instead, we estimate the nested specification above in a cross-sectional sample of long-term growth using maximum likelihood. In order to minimize problems with endogeneity, we use initial values for human capital stocks and initial total factor productivity. As we are comparing these initial values to the nations' subsequent growth experiences over the next 35 years, endogeneity issues are unlikely to be a problem.
We also conduct a number of robustness checks. First, there is a concern about the quality of initial human capital values as a proxy of the human capital stock available over the estimation period. Recall that our specification implies that human capital is a measure of a nation's capacity to conduct innovation activity (accounted by the first term in the specification), and technology adoption from abroad (captured by the second term in the specification). However, many of the nations in our sample exhibited dramatic growth in their human capital stocks over this period, as measured by average years of schooling. A number of nations, including Nepal, Togo, Iran, Ghana, Syria, and the Central African Republic, actually had more than a five-fold increase in their average years of schooling in the population over the age of 25.
This implies that the initial stocks of human capital in 1960 may poorly represent the stocks of human capital available to a nation later on in the sample period. We therefore also report results using average human capital levels over the estimation period.[555] However, this measure is likely to suffer more from endogeneity issues than initial human capital levels, as a nation’s financial ability to increase the average human capital levels of its citizens is likely to be increasing in its rate of output and total factor productivity growth. Fortunately, as we demonstrate below, our results are fairly robust to either measure of the stock of human capital.Second, since we are estimating a cross-section, we are unable to condition on country-specific fixed effects. In response, we further examine the robustness of our results to the introduction of a number of conditioning variables. Using data obtained from Sachs and Warner (1997), we introduce a number of geo-political characteristics, including a Sub-Saharan Africa dummy, a dummy for countries that are not landlocked, a dummy for tropical countries, a dummy for initial life expectancy, a dummy for eth- nolinguistic fractionalization, and a dummy for openness over the estimation period.
5.3. Results
5.3.1. Base specification
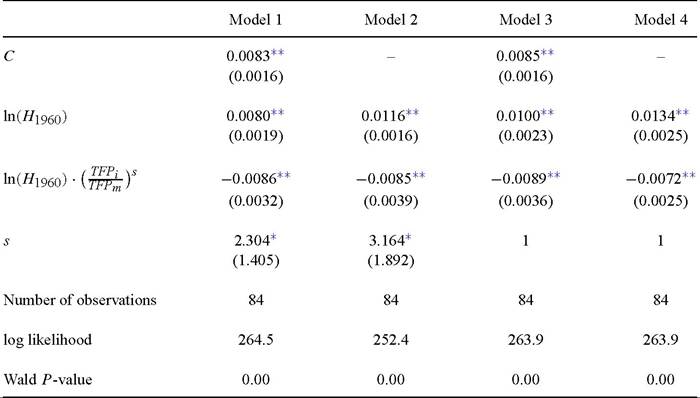
Our results with initial stocks of human capital are shown in Table 2. Our base specification is reported in Model 1. It can be seen that the coefficient on human capital, which represents (g + c/s) in the specification above, enters significantly with a positive coefficient in log levels at a 5 percent confidence level, consistent with the notion of human capital as a facilitator of own innovation predicted by the theory. The next term represents the coefficient on the catch-up term, -(c/s) in the above specification. This term enters as predicted with a negative and statistically significant sign at a 5 percent confidence level. Finally, our point estimate of s is equal to 2.304.
This number is not significantly different from 1, but is significantly greater than 0 at a ten percent confidence level. These results therefore favor the logistic specification, suggesting that there is some initial human capital level below which a country would fall farther and farther behind the leader national in total factor productivity over time. We investigate this possibility in more detail below.One disappointing result in our base specification is that our point estimate for human capital lies below that of the catch-up term in absolute value. This implies that our point estimate for g is negative, which is implausible. However, this point estimate is insignificantly different from 0 and does include positive values for any standard
Table 2
Regression results: log H196Q
Note: Estimation by maximum likelihood with standard errors is presented in parentheses. **Statistical significance at the 5% confidence level.
*Statistical significance at the 10% confidence level.
confidence level. Nevertheless, the negative point estimate does become a problem for our data exploration. In particular, using the negative point estimate for g precludes the existence of a positive critical human capital stock below which catch up in total factor productivity cannot occur.
As discussed above, the problem with the specification of Model 1 is that our theory does not call for a constant term independent of human capital to account for total factor productivity growth. Consequently, Model 2 repeats our base specification with the constant term excluded. It can be seen that our qualitative results are robust to the exclusion of a constant term. Human capital in log levels again enters significantly with a positive coefficient at a 5 percent confidence level, while the catch-up term is again significantly negative at a 5 percent confidence level, as predicted by the theory. Our point estimate of s is a little higher, at 3.164, but as before we cannot reject the hypothesis that s is equal to 1 at standard confidence levels, although we again reject the hypothesis that s is less than or equal to 0 at a 10 percent confidence level. Moreover, it can be seen that our point estimate for g is positive with this specification, allowing us to calculate a critical human capital stock below which catch-up in growth rates will not occur.
Models 3 and 4 repeat our estimation with and without a constant term, with s constrained to equal 1. This results in a linear specification and provides a robustness check of the coefficients obtained in our non-linear specification. It can be seen that our point and standard error estimates are very close to those obtained with unconstrained. Both with and without a constant term, human capital enters significantly with a positive coefficient in log levels at a 5 percent confidence level. Moreover, the catch-up term coefficient is again negative and significant at a 5 percent confidence level, as predicted. These results suggest that our findings are not dependent on the non-linear estimation of to obtain coefficient estimates consistent with the notion of human capital playing a positive role in facilitating both innovation and catch-up.
5.3.2. Average human capital levels
Our first set of robustness checks repeats our estimation using average levels of human capital over the estimation period rather than initial human capital values.[556] As discussed above, we do this to address the concern that some nations’ stocks of human capital changed dramatically over the estimation period, and therefore that initial human capital values may be relatively noisy indicators of the average levels of human capital over the estimation period that determined their TFP growth.
The results incorporating this change are shown in Table 3. It can be seen that our qualitative results are fairly robust. Average human capital levels enter positively and significantly, as predicted, at a 5 percent confidence level, as do the coefficient estimates for the catch-up term. The magnitudes of these coefficients are similar to those obtained with initial human capital stocks, but they are both somewhat larger in absolute value. This increase is interesting because average measured human capital levels are larger than initial human capital levels, as all nations experienced some increase in average years of schooling over the estimation period.
Our estimates of s in Models 1 and 2 are very close to 1, which would again favor our logistic specification, but the large standard errors associated with our estimates of leave them insignificantly different from 0 at standard confidence levels.
5.3.3. Conditioning on country characteristics
Because we are estimating a cross-section, we obviously are precluded from using panel estimators, such as country fixed and random effects, to control for differences in country characteristics outside of our theory that may independently influence total factor productivity growth. To account for these other possible influences, we introduce a number of conditioning variables into our specification from the Sachs and Warner (1997) data set.[557] The conditioning variables introduced are Sub-Sahara, a dummy indicating Sub-Saharan African nations, Landlocked, a dummy indicating a nation lacking navigable access to the sea, Tropics, a variable measuring the share of land area subject to
Table 3 _
Regression results: log H1960—1995
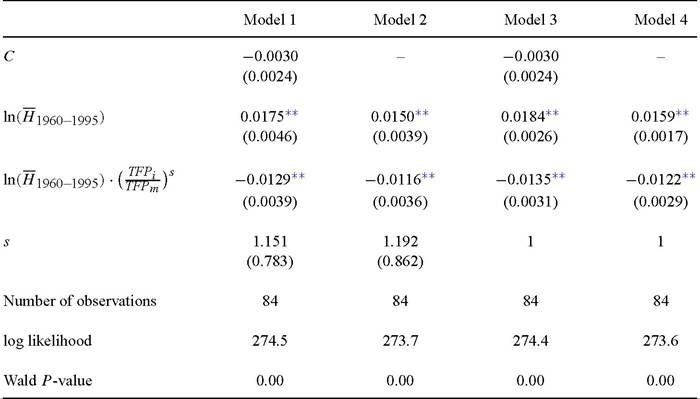
Note: Estimation by maximum likelihood with standard errors is presented in parentheses. **Statistical significance at the 5% confidence level.
a tropical climate, Life, the log of life expectancy at birth measured between 1965 and 1970, Ethling, a measure of ethnolinguistic fractionalization, and Openness, an indicator of the degree to which domestic policy favors free trade.
We first present our results with all of the conditioning variables included, and then sequentially drop the Sub-Sahara and Openness variables. Our results are shown in Table 4. Note that the inclusion of these conditioning variables reduces our sample size from 84 to 75 countries. Models 1 and 2 report our results for our base specifications with all of the conditioning variables included. It can be seen that human capital in log levels is not positive at a statistically significant level in either specification. This result is attributable more to a substantial increase in our standard error estimate rather than a change in the point estimate of the coefficient, which does not change much in value. On the other hand, it appears that the catch-up term is robust to the inclusion of these conditioning variables, as it enters significantly with a negative coefficient at a 5 percent confidence level, as predicted. Finally, our point estimates of 5 are still close to 1. We cannot reject that 5 is negative at standard confidence levels when our intercept term is included, but we can with it excluded (Model 2).[558]
_ Table 4
Regression results: log H1960-1995 and geo-political variables
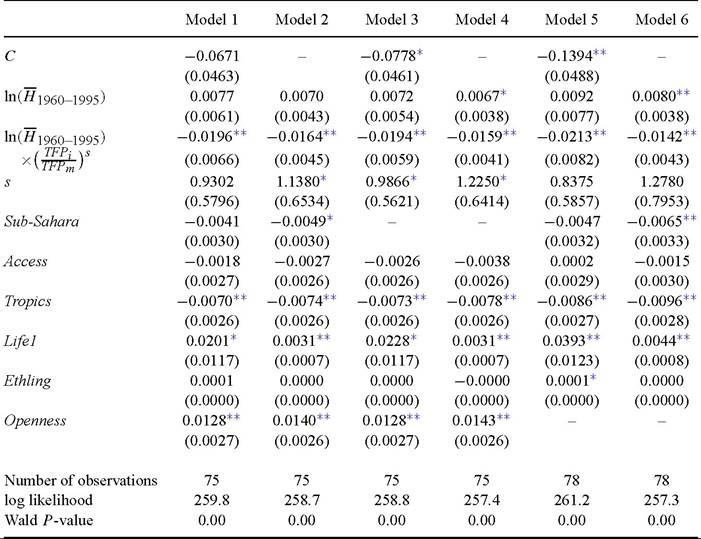
Note: Estimation by maximum likelihood with standard errors is presented in parentheses. **Statistical significance atthe 5% confidence level.
* Statistical significance atthe 10% confidence level. See text for definitions of the conditioning variables.
Models 3 and 4 omit the Sub-Sahara dummy. It can be seen that human capital in log levels is still insignificant when the constant term is included, but is now significant at a 10 percent confidence level when the constant term is excluded. The catch-up term is still significantly negative at a 5 percent confidence level, as predicted. Our point estimates for s are still close to 1, with s entering significantly with a greater than zero coefficient at a 10 percent confidence level with and without the inclusion of a constant term.
Finally, Models 5 and 6 omit the Openness variable. Human capital in log levels is insignificant with the constant term included, but is positive and significant, as predicted,
the conditioning variables excluded. We obtained similar results to those in the larger sample. In particular, we obtained a positive and significant coefficient on human capital in log levels. This indicates that the differences in results reported here are attributable to the inclusion of the conditioning variables. with the exclusion of the constant term at a 10 percent confidence level. The catch-up term is still significantly negative at a 5 percent confidence level, as predicted. Our point estimates for 5 are again close to 1, although 5 is insignificantly different from zero both with and without the inclusion of a constant term in our specification.
In summary, it appears that the catch-up term is strongly robust to the inclusion of the conditioning variables, while the estimates of 5 are still close to one, but of mixed significance. It would therefore be fair to characterize these coefficient estimates to be fairly robust to the inclusion of the conditioning variables.[559] However, human capital in log levels was somewhat less robust. This result may not be surprising for a number of reasons: First, the conditioning variables, such as initial life expectancy and subsequent openness, are likely to be correlated with initial human capital levels. Indeed, initial life expectancy may be considered to be an alternative indicator of investment in human capital for many developing countries. Second, Benhabib and Spiegel (1994) found that initial human capital, which determines the rate of own-country innovation, was unimportant for a sub-sample of poorer developing countries. The introduction of our conditioning may have exposed the relatively weak role that innovation plays in total factor productivity growth for the poorer nations in our sample.[560]
6.