Practical and Logical Time in High-Frequency Trading (HFT): A Re-domaining of the Trading System
Traditional economists focused on game-theoretic auctions on a logical time basis. Now that algorithmic trade is dominant, it seems strange to observe game-theoretic behaviors by focusing only on abstract ‘logical’ time.
In the current financial market, algorithmic trading has become dominant, and orders are achieved each microsecond, although the stock exchange’s server can only process them within milliseconds. High-frequency trades (HFTs) are characterized by the delay between the process speed and the order speed. If algorithmic trade and server-based exchanges are both essential, this kind of delay must be inevitable. We suggest that this should be seen as a re-domaining of the trading system, away from auctions on a logical time basis. We need algorithmic trade to progress.Section 5.4 first appeared in Aruka and Akiyama (2009) © Springer Japan 2015
Y. Aruka, Evolutionary Foundations of Economic Science, Evolutionary Economics and Social Complexity Science 1, DOI 10.1007/978-4-431-54844-7__5
5.1.1 Caveats on HFTfrom the European Securities and Markets Authority
Without any caveats on HTF, we will inevitably see deceptive behaviors. The European Securities and Markets Authority (ESMA) therefore issued a consultation paper (ESMA 2011) setting out the four major deceptive behaviors often seen:
Ping orders, making orders for small amounts to trigger reactions in other participants, bringing additional information about their positions and expectations;
Quote stuffing, making small variations in the position in the order book to create uncertainty for other participants, slow down the process and hide their own strategy;
Momentum ignition, making aggressive orders to start or exacerbate a trend, hoping others will follow and help to unwind the position;
Layering and spoofing, submitting multiple orders at different prices on one side of the order book, submitting a single order to the other side of the order book (which reflects the true intention to trade) and, once that has been executed, rapidly removing the multiple initial orders from the book.
All these strategies are well known, but were generally suppressed before HFT, because they are illegal or punishable. As long as any order can be offered and immediately canceled out within the unit time process of the exchange server, these behaviors are possible. Layering and spoofing is usually a cross-operation. In the next section, we show how it is done.
5.1.1.1 Deceptive Behaviors and Cross-Operation by an HFT
As set out in Chap. 4, the stock exchange operates a continuous double auction governed by rules and institutional settings. The advent of HFT, however, brought a new hierarchical structure, forcing a re-domaining of the market form. The market can create a so-called two-fold layer, consisting of the outer process and the inner field. In the latter, algorithm traders make their own moves within the unit process time of the server, irrespective of any regulation of the auction rules. This stage may be considered a form of unregulated double auction. The hierarchical structure created by the time delay implies that some illegal moves in the double auction system could be possible but invisible, creating a second invisible market with the HFT system.
By exploiting the time delay in the processing of matching it has become feasible to execute apparently illegal orders like cross-operations without being detected. We now illustrate a possible case using a cross-operation, where an ask and bid are fabricated far from the real level. This is only possible if the order speed outstrips that of processing, which is the case on the stock exchange.
Table 5.1 Cross-operational move by agent F
| MO for sell | Ask | Price | Bid | MO for buy |
| F3,000 | 100 | F1,000 | ||
| 99 | ||||
| 98 | ||||
| 97 | ||||
| 96 | ||||
| 95 | ||||
| 94 | ||||
| 93 | ||||
| G1,000 | 92 | |||
| H1,500 | 91 | |||
| 90 | A3,000 |
Table 5.2 Induced move by agent Z
| MO for sell | Ask | Price | Bid | MO for buy |
| F3,000 | 100 | F1,000+Z2,000 | ||
| 99 | ||||
| 98 | ||||
| 97 | ||||
| 96 | ||||
| 95 | ||||
| 94 | ||||
| 93 | ||||
| G1,000 | 92 | |||
| H1,500 | 91 | |||
| 90 | A3,000 |
5.1.1.2 Stage 1
Agent F makes a cross-operational move although the real supply and demand tends to be fixed around ¥90 to 92 (see Table 5.1).
Agent Z may be induced by agent F’s actions to have a limit order of 2,000 units at ¥ 100 (see Table 5.2).5.1.1.3 Stage 2
After agent Z’s move, agent F may immediately make the next move and ask for 2,000 units by market order. This move will drastically change the market situation, so agent Z is forced to cut his losses by submitting his ask of 2,000 units in the form of a limit order at ¥90 to improve his position balance and cancel out the ‘wrong’ order posted at ¥100 (see Table 5.3).
If agent Z confirms his successful ask at ¥90, the contract would make the initial effort to make the cross-operation futile. The price level is what was expected from the real supply and demand, and agent F is therefore keen to ensure that his next move leads to the desired result.
Table 5.3 The next moves
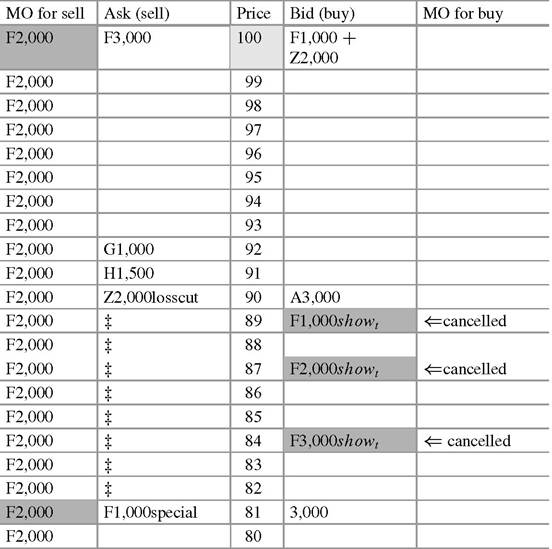
Orders by agent F are immediately canceled when agent Z cuts their losses
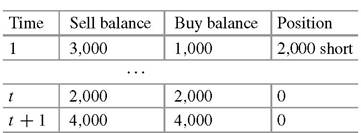
Table 5.4 The position of agent F
5.1.1.4 Stage 3
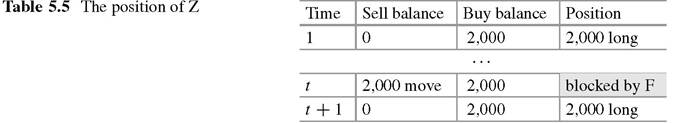
Given the actions of agent Z, agent F will at once make a countermove to deploy show bid limit orders like 1,000 units at {¥89}, 2,000 units at {¥87 }, 3,000 units at {¥84 }, or 3,000 units at {¥81}. These show bid orders, except for the last one of 3,000 units at {¥81, which will be canceled soon after a special ask of 1,000 units at {¥81}. In the final stage, agent F will confirm the end by short-selling the limit order of 1,000 units with a large price fall, to cancel out the other bids. The bigger the price fall, the greater the profit, so agent F will win the game. In this game, the first ask of 3,000 units at 100 will be purchased by the final special bid (see Table 5.3). Tables 5.4 and 5.5 illustrate the position balance of the two agents. The only requisite for success is to move as quickly as possible, which is the operating principle for HFT.
5.1.2 The Re-domaining of the Market Caused
by the HTF System
We have now seen the process of an unregulated double auction as compatible with a cross-operation by a speculator, although such an operation is an illegal action in the stock exchange. Given the delay of process speed behind order speed, a two-fold hierarchy has been created, with the familiar double auction as the outer system and an invisible mechanism embedded within it (see Fig. 5.1). The two systems interact, and work together as a new system separated from the supposed natural system of logical time processing. In the algorithmic world, what matters is the practical time required to process-match and submit orders, and the difference between the two can no longer be ignored.
Before the development of algorithmic trading, there was a clear distinction between batch and double auctions, as we discussed in Chap. 4. Reconstructing these by algorithm, a process of matching will take place in each time unit. The more precision required, the smaller the unit of time must be, but it is impossible to secure the ideal of continuous time. The double auction system in algorithmic space will therefore take a new form, shaping a two-fold hierarchy for trading. The evolution of the market will depend on the interaction between the outer and inner systems. See Fig. 5.2. The visible layer just shows a part of the evolution at the hidden layer. See Fig. 5.3.
The upper panel of Fig. 5.4 shows the difference between batch and double auctions in terms of unit time structure, and the lower panel of it shows the twofold hierarchy’s unit time structure. The comparison between the traditional and algorithmic trading systems is shown in the two arrows depicted in Fig. 5.4. Here the first pivot (unit of time) and the second pivot in the double auction can be furthermore decomposed into the number of unit time.
5.1.3 A Historical Example: A Flash Crash
In a natural system, the patterns of a movement will change dramatically with a change in its speed. Mainzer (2007) summarized this proposition by taking the instance of the pattern of a stream. The velocity of the stream’s current changes its flow pattern. As the velocity of a stream increases:
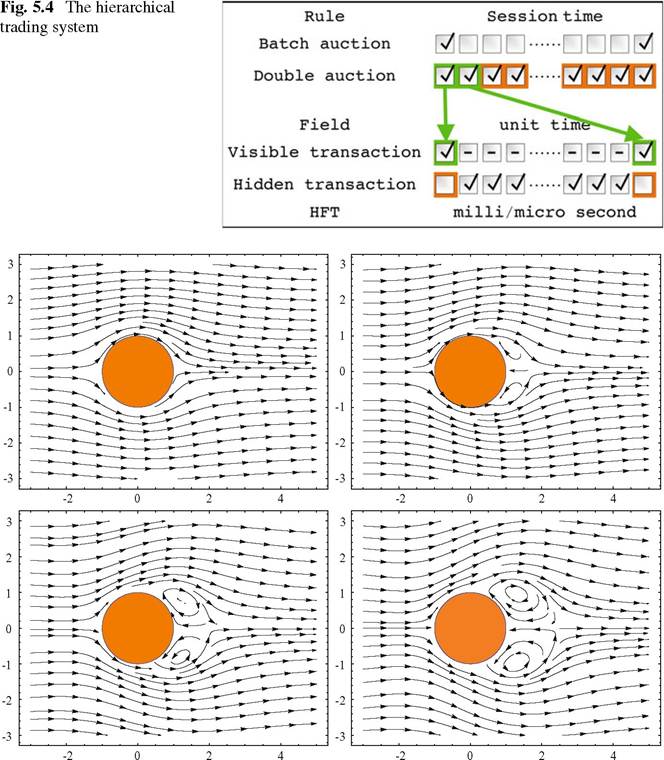
Fig. 5.5 Pattern variations: flow around a sphere at different velocities. Speed(Reynolds number) 20;100; 150;250; http://demonstrations.wolfram.com/FlowAroundASphereAtFinite- ReynoldsNumberByGalerkinMethod/
1. Its periodicity will change from regular to irregular; and
2. The pattern of the current will become increasingly complex.
The current financial system is subject to both algorithmic trading and HTF. The speed of trading is likely to cause various effects, such as the 2010 “flash crash”. Though alarming at the time, this may be a natural outcome of the various patterns emerging from a nonlinear system, and only one possible outcome of the hypervelocity and frequency of stock trading (Fig. 5.5).
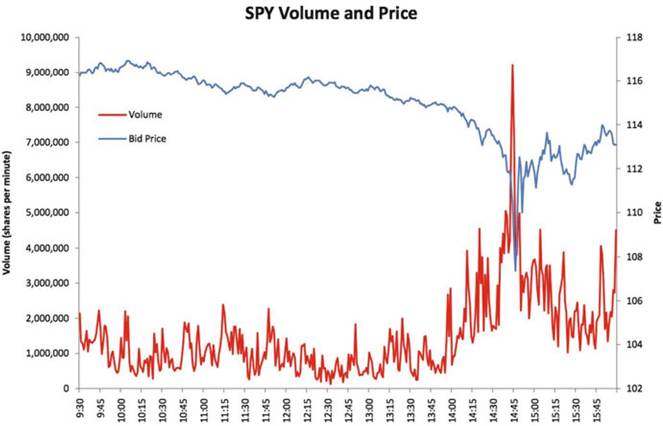
Fig. 5.6 Flash crash and high frequencies of buy. Cited from Fig. 1.2 of U.S. Commodity Futures Trading Commission, U.S. Securities & Exchange Commission (2010, p. 15)
Before considering the nonlinear properties of the system in more detail, we first give an outline of the flash crash (Fig. 5.6):
On May 6, US stock markets opened down and trended down most of the day on worries about the debt crisis in Greece. At 2:42 pm, with the Dow Jones down more than 300 points for the day, the equity market began to fall rapidly, dropping an additional 600 points in 5 minutes for an almost 1,000 point loss on the day by 2:47 pm. Twenty minutes later, by 3:07 pm, the market had regained most of the 600 point drop[56]
The financial markets had shown the following properties around the HFT system:
High frequency or high oscillation of the system will alter its phase.
High-speed matching or high-speed processing of orders will cause the system to oscillate.
Even under the same matching rule, the outcome will differ qualitatively when the matching system enters hyper-speed processing.
Based on knowledge of nonlinear sciences, we can suggest suitable regulatory ingredients. First, we need to know the essential features in a given system:
1. The institutional setting and rules
2. What kind of system is it designed to be?
3. Characteristics (important factors to be considered):
• What kind of landscape: configuration?
• Which direction?
• High frequencies
4. Systemic risk of the movement
5. Fragmentation and instability
The essential features of the economy and the market system are:
1. The free market system: system operation
2. The free market system: agent strategies
3. Characteristics
• Large number of participants
• Very high speed of processing
4. Algorithmic intelligence dominance
5. Social fragmentation and its rapid developments (Fig. 5.7)
In the financial markets, algorithmic intelligence has come to dominate:
The Carnivore, the Boston Shuffler, the Knife are some of the names of the algorithms on Wall Street that make up 70% of the operating system of stocks formerly known as your pension fund, and portfolio. What Kevin Slavin is talking about is High Frequency Trading/Black Boxes that dominate The Street. In reality these mathematic algorithms are shaping far more than Wall Street, they’re shaping our world.[57]
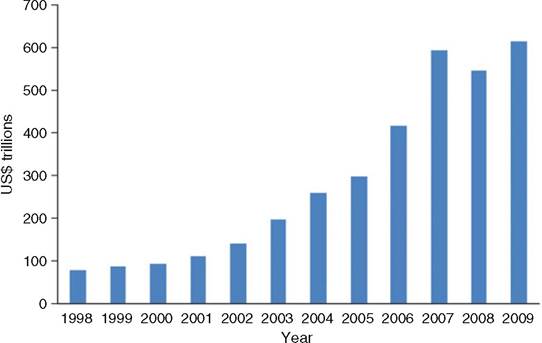
Fig. 5.7 Notional principal value of outstanding derivative contracts, as recorded at year end. These include foreign exchange, interest rates, equities, commodities and credit derivatives. Data from UK Department for Business, Innovation and Skills, International Monetary Fund and Bank of England calculations. Hundreds of trillions balance of the derivative contracts. Cited from Fig. 1 in Haldane and May (2011)
5.1.2 How a Flash Crash Happened
5.1.4.1 The Triggering Agents
There were some important causative moments leading up to the flash crash. A large number of ‘asks’ could be enough to freeze the bid orders, and lead to a ‘price plunge’ until the price contract is nearly zero, which is what happened in the May 2010 flash crash. Even if a single order was not quite large enough to deplete all the bid orders, traders can panic if the price of a security goes down rapidly. They then add more ask orders, reinforcing the situation and resulting in a flash crash (Misra and Bar-Yam 2011).
The triggered algorithmic agents were considered as these rather simple-shaped agents:
Arithmetic limit order: raise or lower 1 by 1 cent per 1/1,000 second Geometric limit order: raise or lower double per 1/1,000 second
The synchronization between them contributed to a sudden rapid fall in the stock price, achieving almost zero pricing instantly. In the current market, there is an unprecedentedly large transaction balance created by the movement of various financial commodities as well as large numbers of algorithmic agents. The flash crash followed a much larger crash, linked to the collapse of Lehman Brothers. After this flash crash in 2010, there were several others too, but these caused little external damage because large unilateral asks could be canceled out by a bid the same size. This may be feasible by a single agent who has simultaneous moves of ask and bid. The occurrence probability of shocks is often said to be similar to a large earthquake. However, small shocks have occurred thousands of times a year since May 2010, and there are likely to be many more as hyper-speed trading expands.
The financial market therefore seems to be less stable. A microsecond in the markets can be as crucial as the microsecond needed to press the nuclear missile button. Recent studies have often shown the market taking a random walk that does not necessarily follow the central limit theorem. One particular trader can deliberately change the market configuration, and cause an upward then downward surge, adding instability. A quick injection of bid action will guarantee a quick recovery. If such instability is embedded, a violent fluctuation could offer huge profits, so price plunges may be welcomed by traders.
Remark 5.1. HM The Queen asked mainstream economists why the Lehman shock had happened. A group of distinguished economists from the London School of Economics and the Royal Economic Society replied:
So where was the problem? Everyone seemed to be doing their own job properly on its own merit. And according to standard measures of success, they were often doing it well. The failure was to see how collectively this added up to a series of interconnected imbalances over which no single authority had jurisdiction. This, combined with the psychology of herding and the mantra of financial and policy gurus, led to a dangerous recipe. Individual risks may rightly have been viewed as small, but the risk to the system as a whole was vast.
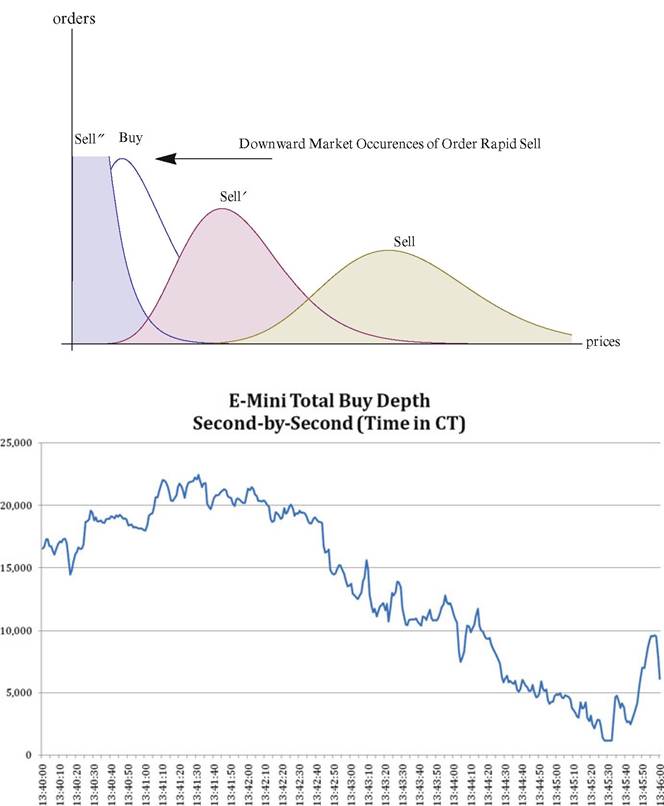
Fig. 5.8 The quick shift of high-frequency trading and the frozen series of buys. The lower panel is cited from Fig. 6 of U.S. Commodity futures Trading Commission, U.S. Securities & Exchange Commission (2010, p. 24)
So in summary, Your Majesty, the failure to foresee the timing, extent and severity of the crisis and to head it off, while it had many causes, was principally a failure of the collective imagination of many bright people, both in this country and internationally, to understand the risks to the system as a whole. (Besley and Hennessy 2009).
We now explore how this happened (Fig. 5.8).
5.2