Some Implications Derived from Statistical Tests
2.4.1 Main Findings
We can derive several implications from our statistical observations. We have found two statistically significant principal modes distinguished from a random distribution of eigenvalues.
In particular, we have found modes 1 and 2, associated with the eigenvalues λi > λ2.The first principal mode is FOOD. It turns out that mode 1 may contribute 8.5 % to the total variation in consumption. The second principal mode is FUEL, LIGHT & WATER. This contributes up to 7.1 % of the total variation in consumption. The result is similar, irrespective of the seasonal adjustment method used. We thus conclude that the FOOD-dominant and FUEL-dominant modes are the driving forces for the pattern of consumption.
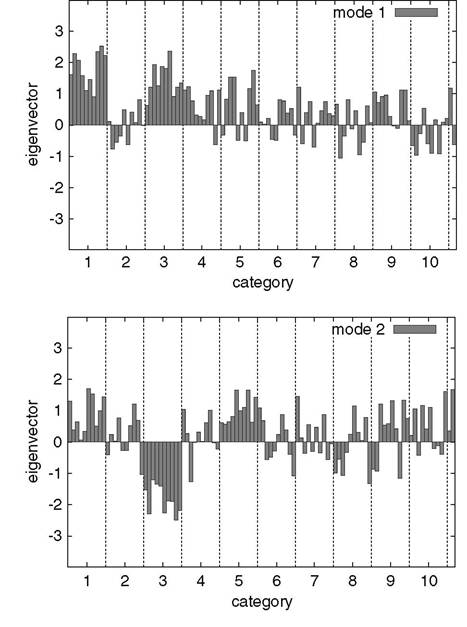
We then turn to the sign of the components. The signs of the FOOD and FUEL components are positive in mode 1, but opposite in mode 2, as seen in Fig. 2.11.
The result of mode 1 seems obvious, if we interpret the FOOD mode in the context of Engel’s coefficient connections. IfwecookFOODitems, we will also use FUEL. In mode 2, however, it is hard to find an obvious interpretation. CLOTHING has negative signs in all the different income classes. In mode 2, then, the FUEL consumption is opposite to that of FOOD as well as CLOTHING. We therefore suggest that mode 2 might be close to the consumption activity of requiring more electricity, for example, by using a personal computer. In the event, whatever interpretation is given, we have shown that about 15 % of the total variation in consumption is generated by an organized co-movement in a particular way, whether natural or cultural. We cannot, however, know whether the remaining distribution is genuinely random in view of the random matrix theory.
To detect any correlation induced by hidden factors, we can investigate a possible relationship.
We look for mode 3(λi > λ2 > λ3). A mode with eigenvalues below 0.1 may be regarded as completely random. However, if mode 3 has a larger standard deviation than the random variable, this could be from another factor. Alternatively, we could add three random variables. A tentative principal analysis in the expanded data showed little difference from the previous analyses, although another calculation indicated that a mode around the added variables showed some substantial changes in standard deviation. This may imply a visible correlation with business fluctuation, although this remains unverified.Fig. 2.13 Contributions due to the extra working hours/temperatures
2.5.2 Further Findings
We made another attempt to detect hidden factors affecting consumer demands, choosing two factors, Extra Working Hours and TEMPERATURE. Extra working hours may be sensitive to business fluctuations. Our results were:
1. After we added the time series of extra working hours to the original data, we calculated the eigenvector distributions. The extra working hours as an additional 11th element marked a positive high value, particularly in mode 1, but also in mode 2.
2. We added the anomaly time series of monthly average temperatures in Tokyo Metropolitan City, and found that the pattern was unchanged for both modes, although the components of mode 2, in particular, were magnified by temperature.
Figure 2.13 shows, on the horizontal axis, the column before last that corresponds to Extra Working Hours, and the last that corresponds to Temperatures1 [37] The first principal eigenvector retains the positive correlation over all components. Once the time series of Extra Working Hours was added, FOOD, FUEL and Extra Working Hours made a large contribution to the first principal eigenvector. We may therefore regard Extra Working Hours as an important parameter for business fluctuations, and mode 1 probably depends on business fluctuations. In mode 2, FUEL and CLOTHING are closely correlated with TEMPERATURE, so the consumption pattern of mode 2 may be most sensitive to TEMPERATURE. Most of the items of expenditure have strong seasonal dependence, as expected, except for Housing, Medical and Transport. Removing seasonal components is therefore critical to elucidate possible correlations in expenditure by Japanese consumers.