The existing evidence on volatility and growth
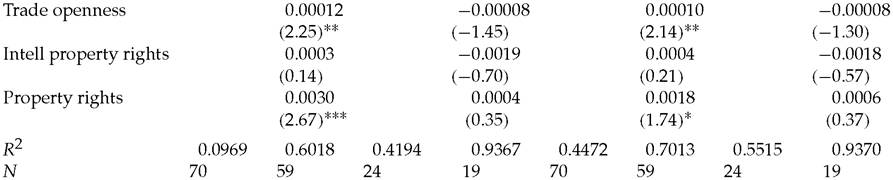
The work of Bruno (1993) on inflation and growth, and later Gavin and Hausmann (1996), and the Inter-American Development Bank report on Volatility in Latin America in the mid-1990s, provides strong cross-country evidence of the detrimental effects of volatility on long-run growth, particularly in countries or the subset of countries with low levels of financial development as measured by the ratio of bank credit to GDP (see Figure 1.2).
The most cited work on the subject is probably the AER paper by Ramey and Ramey (1995), henceforth RR. RR consider crosssectional data from 92 countries, and regress average growth over aggregate volatility. Annual growth is computed as the log difference of per capita income obtained from the Penn World Tables
Table 1.1 RameyandRameyrevisited
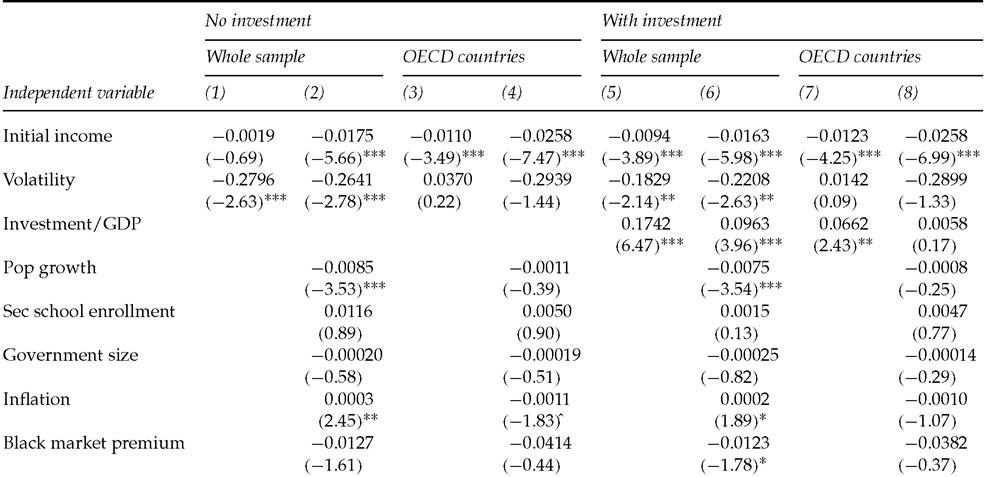
Note: Dependent variable is average growth over the 1960-95 period. All regressors are averages over the 1960-95 period, except for intellectual and property rights which are for 1970-95 and 1970-90 respectively. Initial income and secondary school enrollment are taken for 1960. Constant term not shown. T-statistics in parenthesis. ***, **, *,^significant at the 1%, 5%, 10%, and 11% respectively.
Source: AABM (2004), table 1.
Fig. 1.2 Volatility and growth of real GDP per capita.
Source: Gavin and Hausmann (1996), figure 2.
(PWT) mark 6.1. Aggregate volatility is measured by the countryspecific standard deviation of annual growth over the 1960-92 period. In addition RR construct an estimate of the part of the volatility that is due to exogenous shocks, by using a filter to take out the endogenous movements in GDP. Their first finding is that there is a negative correlation between the standard deviation of per capita annual growth rates and the average growth rate. Second, this correlation becomes negligible once the cross-country regression is restricted to OECD countries. Third, they find that the negative correlation between volatility and growth persists when one controls for the ratio of average investment over GDP. These findings, summarized in Table 1.1, are clearly at odds with the theories, based in a world with no credit constraints, that we developed earlier.
In the next chapter we will argue that the RR findings can be easily accounted for by simply introducing credit constraints in the opportunity cost model in the previous section.