The information age
1.1. Introduction
The resurgence of the American economy since 1995 has outrun all but the most optimistic expectations. Economic forecasting models have been seriously off track and growth projections have been revised repeatedly to reflect a more sanguine outlook.[426] It is not surprising that the unusual combination of more rapid growth and slower inflation touched off a strenuous debate about whether improvements in America’s economic performance could be sustained.
The starting point for the economic debate is the thesis that the 1990s are a mirror image of the 1970s, when an unfavorable series of “supply shocks” led to stagflation - slower growth and higher inflation.[427] In this view, the development of information technology (IT) is one of a series of positive, but temporary, shocks. The competing perspective is that IT has produced a fundamental change in the U.S. economy, leading to a permanent improvement in growth prospects.[428] The resolution of this debate in favor of a permanent improvement has been the “killer application” of a new framework for productivity measurement summarized in Paul Schreyer’s (2001) OECD Manual.
A consensus has emerged that the development and deployment of information technology is the foundation of the American growth resurgence. A mantra of the “new economy” - faster, better, cheaper - captures the speed of technological change and product improvement in semiconductors and the precipitous and continuing fall in semiconductor prices. The price decline has been transmitted to the prices of products that rely heavily on semiconductor technology, like computers and telecommunications equipment. This technology has also helped to reduce the cost of aircraft, automobiles, scientific instruments, and a host of other products.
Swiftly falling IT prices provide powerful economic incentives for the substitution of IT equipment for other forms of capital and for labor services.
The rate of the IT price decline is a key component of the cost of capital, required for assessing the impacts of rapidly growing stocks of computers, communications equipment, and software. Constant quality price indexes are essential for identifying the change in price for a given level of performance. Accurate and timely computer prices have been part of the U.S. National Income and Product Accounts (NIPA) since 1985. Unfortunately, important information gaps remain, especially on trends in prices for closely related investments, such as software and communications equipment.Capital input has been the most important source of U.S. economic growth throughout the postwar period. More rapid substitution toward information technology has given much additional weight to components of capital input with higher marginal products. The vaulting contribution of capital input since 1995 has boosted growth by close to a percentage point. The contribution of investment in IT accounts for more than half of this increase. Computers have been the predominant impetus to faster growth, but communications equipment and software have made important contributions as well.
The accelerated information technology price decline signals faster productivity growth in IT-producing industries. In fact, these industries have been a rapidly rising source of aggregate productivity growth throughout the 1990s. The IT-producing industries generate less than five percent of gross domestic income, but have accounted for nearly half the surge in productivity growth since 1995. However, it is important to emphasize that faster productivity growth is not limited to these industries.
The dramatic effects of information technology on capital and labor markets have already generated a substantial and growing economic literature, but many important issues remain to be resolved. For capital markets the relationship between equity valuations and growth prospects merits much further study. For labor markets more research is needed on investment in information technology and substitution among different types of labor.
1.2. Faster, better, cheaper
Modern information technology begins with the invention of the transistor, a semiconductor device that acts as an electrical switch and encodes information in binary form. A binary digit or bit takes the values zero and one, corresponding to the off and on positions of a switch. The first transistor, made of the semiconductor germanium, was constructed at Bell Labs in 1947 and won the Nobel Prize in Physics in 1956 for the inventors - John Bardeen, Walter Brattain, and William Shockley.[429]
The next major milestone in information technology was the co-invention of the integrated circuit by Jack Kilby of Texas Instruments in 1958 and Robert Noyce of Fairchild Semiconductor in 1959. An integrated circuit consists of many, even millions, of transistors that store and manipulate data in binary form. Integrated circuits were originally developed for data storage and retrieval and semiconductor storage devices became known as memory chips.[430]
The first patent for the integrated circuit was granted to Noyce. This resulted in a decade of litigation over the intellectual property rights. The litigation and its outcome demonstrate the critical importance of intellectual property in the development of information technology. Kilby was awarded the Nobel Prize in Physics in 2000 for discovery of the integrated circuit; regrettably, Noyce died in 1990.[431]
1.2.1. Moore’s Law
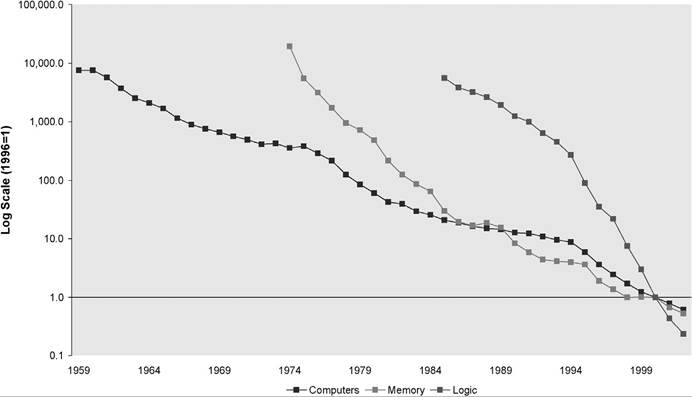
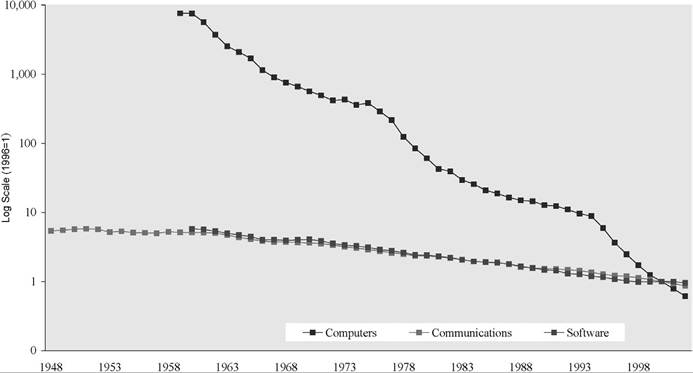
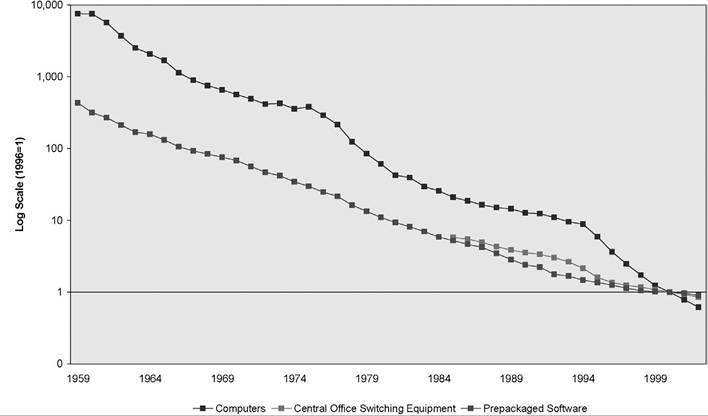
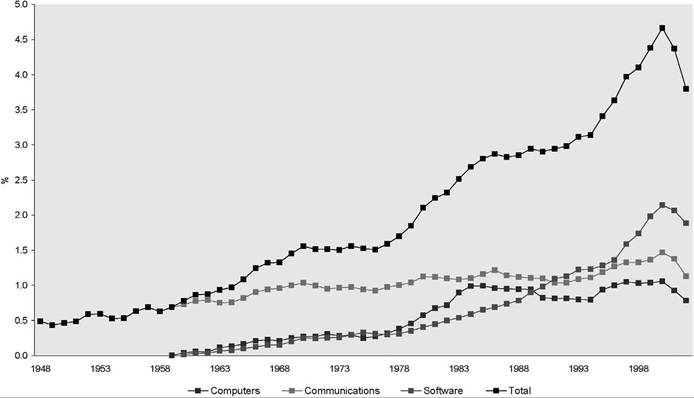
In 1965 Gordon Moore, then Research Director at Fairchild Semiconductor, made a prescient observation, later known as Moore’s LawJ Plotting data on memory chips, he observed that each new chip contained roughly twice as many transistors as the previous chip and was released within 18-24 months of its predecessor. This implied exponential growth of chip capacity at 35-45 percent per year! Moore’s prediction, made in the infancy of the semiconductor industry, has tracked chip capacity for thirty-five years. He recently extrapolated this trend for at least another decade.[432] [433] In 1968 Moore and Noyce founded Intel Corporation to speed the commercialization of memory chips.[434] Integrated circuits gave rise to microprocessors with functions that can be programmed by software, known as logic chips. The rapidly rising trends in the capacity of microprocessors and storage devices illustrate the exponential growth predicted by Moore’s Law. The first logic chip in 1971 had 2,300 transistors, while the Pentium 4 released on November 20, 2000, had 42 million! Over this twenty-nine year period the number of transistors increased by thirty-four percent per year. The rate of productivity growth for the U.S. economy during this period was slower by two orders of magnitude. 1.2.2. Semiconductor prices Moore’s Law captures the fact that successive generations of semiconductors are faster and better. The economics of semiconductors begins with the closely related observation that semiconductors have become cheaper at a truly staggering rate! Figure 1 gives semiconductor price indexes constructed by Bruce Grimm (1998) of the Bureau of Economic Analysis (BEA) and employed in the U.S. National Income and Product Accounts since 1996. These are divided between memory chips and logic chips. The underlying detail includes seven types of memory chips and two types of logic chips. Between 1974 and 1996 prices of memory chips decreased by a factor of 27,270 times or at 40.9 percent per year, while the implicit deflator for the gross domestic product (GDP) increased by almost 2.7 times or 4.6 percent per year! Prices of logic chips, available for the shorter period 1985 to 1996, decreased by a factor of 1,938 or 54.1 percent per year, while the GDP deflator increased by 1.3 times or 2.6 percent per year! Semiconductor price declines closely parallel Moore’s Law on the growth of chip capacity, setting semiconductors apart from other products. Figure 1. Relative prices of computers and semiconductors, 1959-2002. Figure 1 also reveals a sharp acceleration in the decline of semiconductor prices in 1994 and 1995. The microprocessor price decline leaped to more than ninety percent per year as the semiconductor industry shifted from a three-year product cycle to a greatly accelerated two-year cycle. This is reflected in the 2003 Edition of the International Technology Road Map for Semiconductors,[435] prepared by a consortium of industry associations. Ana Aizcorbe, Stephen Oliner and Daniel Sichel (2003) have identified and analyzed break points in prices of microprocessors and storage devices. 1.2.3. Constant Quality Price Indexes The behavior of semiconductor prices is a severe test for the methods used in the official price statistics. The challenge is to separate observed price changes between changes in semiconductor performance and changes in price that hold performance constant. Achieving this objective has required a detailed understanding of the technology, the development of sophisticated measurement techniques, and the introduction of novel methods for assembling the requisite information. Ellen Dulberger (1993) introduced a “matched model” index for semiconductor prices. A matched model index combines price relatives for products with the same performance at different points of time. Dulberger presented constant quality price indexes based on index number formulas, including the Fisher (1922) ideal index used in the in the U.S. national accounts.[436] The Fisher index is the geometric average of the familiar Laspeyres and Paasche indexes. 10 Erwin Diewert (1976) defined a superlative index number as an index that exactly replicates aflexible representation of the underlying technology (or preferences). A flexible representation provides a second-order approximation to an arbitrary technology (or preference system). A.A. Konus and S.S. Byushgens (1926) first showed that the Fisher ideal index is superlative in this sense. Grimm (1998) combined matched model techniques with hedonic methods, based on an econometric model of semiconductor prices at different points of time. A hedonic model gives the price of a semiconductor product as a function of the characteristics that determine performance, such as speed of processing and storage capacity. A constant quality price index isolates the price change by holding these characteristics of semiconductors fixed.[437] Beginning in 1997, the Bureau of Labor Statistics (BLS) incorporated a matched model price index for semiconductors into the Producer Price Index (PPI) and since then the national accounts have relied on data from the PPI. Reflecting long-standing BLS policy, historical data were not revised backward. Semiconductor prices reported in the PPI prior to 1997 do not hold quality constant, failing to capture the rapid semiconductor price decline and the acceleration in 1995. 1.2.4. Computers The introduction of the Personal Computer (PC) by IBM in 1981 was a watershed event in the deployment of information technology. The sale of Intel’s 8086-8088 microprocessor to IBM in 1978 for incorporation into the PC was a major business breakthrough for Intel.[438] In 1981 IBM licensed the MS-DOS operating system from the Microsoft Corporation, founded by Bill Gates and Paul Allen in 1975. The PC established an Intel/Microsoft relationship that has continued up to the present. In 1985 Microsoft released the first version of Windows, its signature operating system for the PC, giving rise to the Wintel (Windows-Intel) nomenclature for this ongoing collaboration. Mainframe computers, as well as PCs, have come to rely heavily on logic chips for central processing and memory chips for main memory. However, semiconductors account for less than half of computer costs and computer prices have fallen much less rapidly than semiconductor prices. Precise measures of computer prices that hold product quality constant were introduced into the NIPA in 1985 and the PPI during the 1990s. The national accounts now rely on PPI data, but historical data on computers from the PPI, like the PPI data on semiconductors, do not hold quality constant. Gregory Chow (1967) pioneered the use of hedonic techniques for constructing a constant quality index of computer prices in research conducted at IBM. Chow documented price declines at more than twenty percent per year during 1960-1965, providing an initial glimpse of the remarkable behavior of computer prices. In 1985 the Bureau of Economic Analysis incorporated constant quality price indexes for computers and peripheral equipment constructed by IBM into the NIPA. Jack Triplett’s (1986) discussion of the economic interpretation of these indexes brought the rapid decline of computer prices to the attention of a very broad audience. The BEA-IBM constant quality price index for computers provoked a heated exchange between BEA and Edward Denison (1989), one of the founders of national accounting methodology in the 1950s and head of the national accounts at BEA from 1979 to 1982. Denison sharply attacked the BEA-IBM methodology and argued vigorously against the introduction of constant quality price indexes into the national accounts.[439] Allan Young (1989), then Director of BEA, reiterated BEA’s rationale for introducing constant quality price indexes. Dulberger (1989) presented a more detailed report on her research on the prices of computer processors for the BEA-IBM project. Speed of processing and main memory played central roles in her model. Triplett (1989, 2003) has provided exhaustive surveys of research on hedonic price indexes for computers. Gordon (1989, 1990) gave an alternative model of computer prices and identified computers and communications equipment, along with commercial aircraft, as assets with the highest rates of price decline. Figure 2 gives BEA’s constant quality index of prices of computers and peripheral equipment and its components, including mainframes, PC’s, storage devices, other peripheral equipment, and terminals [Bureau of Economic Analysis (1995)]. The decline in computer prices follows the behavior of semiconductor prices presented in Figure 1, but in much attenuated form. The 1995 acceleration in the computer price decline parallels the acceleration in the semiconductor price decline that resulted from the changeover from a three-year product cycle to a two-year cycle in 1995. 1.2.5. Communications equipment and software Communications technology is crucial for the rapid development and diffusion of the Internet, perhaps the most striking manifestation of information technology in the American economy.[440] Kenneth Flamm (1989) was the first to compare the behavior of computer prices and the prices of communications equipment. He concluded that the Figure 2. Relative prices of computers, communications, and software, 1948-2002. Note: All price indexes are divided by the output price index. communications equipment prices fell only a little more slowly than computer prices. Gordon (1990) compared Flamm’s results with the official price indexes, revealing substantial bias in the official indexes. Communications equipment is an important market for semiconductors, but constant quality price indexes cover only a portion of this equipment. Switching and terminal equipment rely heavily on semiconductor technology, so that product development reflects improvements in semiconductors. Grimm’s (1997) constant quality price index for digital telephone switching equipment, given in Figure 3, was incorporated into the national accounts in 1996. The output of communications services in the NIPA also incorporates a constant quality price index for cellular phones. Much communications investment takes the form of the transmission gear, connecting data, voice, and video terminals to switching equipment. Technologies such as fiber optics, microwave broadcasting, and communications satellites have progressed at rates that outrun even the dramatic pace of semiconductor development. An example is dense wavelength division multiplexing (DWDM), a technology that sends multiple signals over an optical fiber simultaneously. Installation of DWDM equipment, beginning in 1997, has doubled the transmission capacity of fiber optic cables every 6-12 months.[441] Mark Doms (2004) has provided comprehensive price indexes for terminals, switching gear, and transmission equipment. These have been incorporated into the Federal Reserve’s Index of Industrial Production, as described by Carol Corrado (2003), but are Figure 3. Relative prices of computers, central office switching equipment, and prepackaged software, 1959-2002. Note: All price indexes are divided by the output price index. Figure 4. Output shares of information technology by type, 1948-2002. Note: Share of current dollar gross domestic product. not yet included in the U.S. National Income and Product Accounts. The analysis of the impact of information technology on the U.S. economy described below is based on the national accounts and remains incomplete. Both software and hardware are essential for information technology and this is reflected in the large volume of software expenditures. The eleventh comprehensive revision of the national accounts, released by BEA on October 27, 1999, re-classified computer software as investment [Bureau of Economic Analysis (1999)].[442] Before this important advance, business expenditures on software were treated as current outlays, while personal and government expenditures were treated as purchases of nondurable goods. Software investment is growing rapidly and is now much more important than investment in computer hardware. Parker and Grimm (2000) describe the new estimates of investment in software. BEA distinguishes among three types of software - prepackaged, custom, and own-account software. Prepackaged software is sold or licensed in standardized form and is delivered in packages or electronic files downloaded from the Internet. Custom software is tailored to the specific application of the user and is delivered along with analysis, design, and programming services required for customization. Own-account software consists of software created for a specific application. However, only price indexes for prepackaged software hold performance constant. Parker and Grimm (2000) present a constant quality price index for prepackaged software, given in Figure 3. This combines a hedonic model of prices for business applications software and a matched model index for spreadsheet and word processing programs developed by Oliner and Sichel (1994). Prepackaged software prices decline at more than ten percent per year over the period 1962-1998. Since 1998 the BEA has relied on a matched model price index for all prepackaged software from the PPI; prior to 1998 the PPI data do not hold quality constant. BEA’s prices for own-account and custom software are based on programmer wage rates. This implicitly assumes no change in the productivity of computer programmers, even with growing investment in hardware and software to support the creation of new software. Custom and own-account software prices are a weighted average of prepackaged software prices and programmer wage rates with arbitrary weights of 75 percent for programmer wage rates and 25 percent for prepackaged software. These price indexes do not hold the software performance constant and present a distorted picture of software prices, as well as software output and investment. 1.2.6. Research opportunities The official price indexes for computers and semiconductors provide the paradigm for economic measurement. These indexes capture the steady decline in IT prices and the recent acceleration in this decline. The official price indexes for central office switching equipment and prepackaged software also hold quality constant. BEA and BLS, the leading statistical agencies in price research, have carried out much of the best work in this area. However, a critical role has been played by price research at IBM, long the dominant firm in information technology.[443] It is important to emphasize that information technology is not limited to applications of semiconductors. Switching and terminal equipment for voice, data, and video communications have come to rely on semiconductor technology and the empirical evidence on prices of this equipment reflects this fact. Transmission gear employs technologies with rates of progress that far outstrip those of semiconductors. This important gap in our official price statistics has been filled by constant quality price indexes for all types of communications equipment constructed by Doms (2004), but these indexes have not been incorporated into the national accounts. Investment in software is more important than investment in hardware. This was essentially invisible until BEA introduced new measures of prepackaged, custom, and own-account software investment into the national accounts in 1999. This is a crucial step in understanding the role of information technology in the American economy. Unfortunately, software prices are a statistical blind spot with only prices of prepackaged software adequately represented in the official system of price statistics. The daunting challenge that lies ahead is to construct constant quality price indexes for custom and own-account software. 1.3. Impact of information technology In Section 2 I consider the “killer application” of the new framework for productivity measurement - the impact of information technology on economic growth. Despite differences in methodology and data sources, a consensus has emerged that the remarkable behavior of IT prices provides the key to the surge in U.S. economic growth after 1995. The relentless decline in the prices of information technology equipment and software has steadily enhanced the role of IT investment. Productivity growth in IT-producing industries has risen in importance and a productivity revival is underway in the rest of the economy. A substantial acceleration in the IT price decline occurred in 1995, triggered by a much sharper acceleration in the price decline of semiconductors, the key component of modern information technology. Although the decline in semiconductor prices has been projected to continue for at least another decade, the recent acceleration may be temporary. This can be traced to a shift in the product cycle for semiconductors from three years to two years as a consequence of intensifying competition in markets for semiconductor products. In Section 3 I show that the surge of IT investment in the United States after 1995 has counterparts in all other industrialized countries. It is essential to use comparable data and methodology in order to provide rigorous international comparisons. A crucial role is played by measurements of IT prices. The U.S. national accounts have incorporated measures of IT prices that hold performance constant since 1985. Schreyer (2000) has extended these measures to other industrialized countries by constructing “internationally harmonized prices”.[444] 18 I show that the acceleration in the IT price decline in 1995 triggered a burst of IT investment in all of the G7 nations - Canada, France, Germany, Italy, Japan, the United Kingdom, as well as the United States. These countries also experienced a rise in productivity growth in the IT-producing industries. However, differences in the relative importance of these industries have generated wide disparities in the impact of IT on economic growth. The role of the IT-producing industries is greatest in the United States, which leads the G7 in output per capita. Section 4 concludes. 2.