The logical structure of econometrics
What is, then, the logical structure of econometric theory (et)? Which is its basic theory-element, specializations, domain of intended applications, T-theoretical terms?
The domain of intended applications of et is vast, as many economic random phenomena have been successfully subjected to econometric analysis.
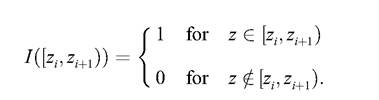
I shall leave as an open problem the task of classifying these phenomena. My task in this final section is merely that of identifying the logical structure of the basic theory-element of et. Nevertheless, we may say something relevant about the general nature of a non-ET-theoretic structure Bs describing a particular real-concrete DGP σ. Taking as a point of departure empirical data D = (x1..., xn) about σ, the econometrician draws an histogram and a cumulative histogram which describe a particular effect of the random causal forces operating in σ. Out of the information provided by such histograms, it calculates numerical characteristics that describe the location, dispersion and shape of the histogram. These are the mean, the median, the mode, the variance, the standard deviation, higher central moments, and the skewness and kurtosis coefficients. Nevertheless, as Spanos (1986: 27) points out, “although the histogram can be a very useful way to summarise and study the observed data it is not a very convenient descriptor of data”. Moreover,analytically the histogram is a cumbersome step function of the form 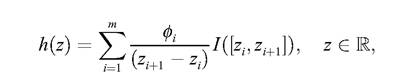 where [zi, zi + 1) represents the ith half-closed interval and /(■) is the indicator function
Hence, the histogram is not an ideal descriptor especially in relation to the modeling facet of observed data (Ibid.).
Even though it is easy to obtain a continuous curve tracing the frequency polygon, the canonical way of representing the data is a Pearson frequency curve, which is a family based on the differential equation
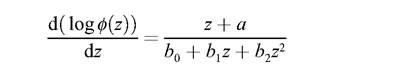
(for more details see Spanos 1986: 28). The non-ET-theoretic structure Bs 2 Mpp describing the intended application in case is a Pearson curve that fits the data in a degree acceptable to the community of econometricians. Pearson curves are analogous, for instance, to the ellipses describing the planetary orbits as described by Johannes Kepler. Just as these orbits are described without presupposing dynamic notions, Pearson curves are introduced without presupposing in their determination any probability measure. A Pearson curve describes a particular factual behavior of a population S. Hence Bs seems to be of the form (S, f *), where f * is a frequency curve which is a non-stochastic function of the observed data, based entirely on the data at hand (in D).
The scientific aim of the econometrician is to ‘explain’ Bs = (S, f *) by means of probability theory, showing that Bs is but one possible realization of the random processes taking place in σ. The point is to find the probability space in which Bs belongs. This is done by postulating a probability model together with a sampling model, derived from a statistical model, describing the relationship between the probability model and the observable data. “The statistical model should represent a good approximation to the real phenomenon to be explained in a way that takes into account the nature of the available data” (Spanos 1986: 341). Using the data the parameters of the statistical model are determined and so are, in this way, the density functions of the probability model. Clearly, these functions allow, by integration, the determination of the probability measures of the underlying probability spaces as well. In particular, f * must turn out to be a special case of the true density function in the probability space. Hence, it seems that we can synthesize the previous discussion by means of a compact definition.
12.9.1 Definition
A is an econometric structure iff there exist S, f *, Φ and X such that 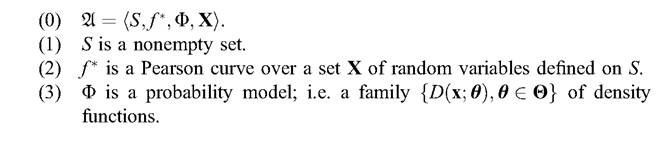
Axiom 12.9.1 (4) is the fundamental law of et. The general form of its empirical claim is that the Pearson curves obtained out of a particular random phenomenon σ can be matched by a density function of a random variable defined over an appropriate probability space.