BACKGROUND
Inward US FDI Stock and Flow
Inward foreign direct investment is an essential component of the US economy, contributing to production, exports and high-paying jobs for the country’s workers.
As the world’s largest economy, the United States is well positioned to participate in the increasingly competitive international environment for FDI that has emerged as both advanced and developing economies have recognized the value of such investment. The US hosts the largest stock of IFDI among the world’s economies, and continues to be at the top as a destination for inward FDI flows.The country’s IFDI stock grew from US$ 83 billion in 1980 to US$ 540 billion in 1990 (www. unctad.org/fdistatistics) to US$ 2,783 billion in 2000, and reached $3,509 billion in 2011 (Table 1). It exceeds by far the inward FDI stock of other large developed economies such as the United Kingdom (US$ 1,199 billion), Germany (US$ 714 billion) and the largest emerging market economy, China (US$ 712 billion) (Table 1).
The US continues to be the leading destination for FDI flows, with inflows reaching US$ 227 billion in 2011; in comparison, FDI flows that year to China were US$ 123 billion, to the United Kingdom, US$ 54 billion, and to Germany, US$ 40 billion (Table 2). Between 2000 and 2011, the US received the largest FDI inflows of any economy in the world. Between 2008 and 2009, during the recent financial and economic crisis, inflows decreased by 50%, from US$ 306 billion to US$ 153 billion, but grew again to US$ 197 billion in 2010 and further to US$ 227 billion in 2011.
Table 1. United States: Inward FDI stock, 2000-2011 (US$ billion)
| Economy | 2000 | 2001 | 2002 | 2003 | 2004 | 2005 | 2006 | 2007 | 2008 | 2009 | 2010 | 2011 |
| United States | 2,783 | 2,560 | 2,022 | 2,455 | 2,717 | 2,818 | 3,293 | 3,551 | 2,486 | 3,027 | 3,451 | 3,509 |
| Comparator Economies | ||||||||||||
| United Kingdom | 439 | 507 | 523 | 606 | 702 | 841 | 1,139 | 1,243 | 981 | 1,056 | 1,086 | 1199 |
| Germany | 272 | 272 | 298 | 395 | 512 | 476 | 591 | 695 | 668 | 677 | 674 | 714 |
| China | 193 | 203 | 217 | 228 | 245 | 272 | 293 | 327 | 378 | 473 | 579 | 711 |
| Russia | 32 | 53 | 71 | 97 | 122 | 180 | 266 | 491 | 216 | 382 | 423 | 457 |
| Japan | 50 | 50 | 78 | 90 | 97 | 101 | 108 | 133 | 203 | 200 | 215 | 226 |
Source: UNCTAD's FDI/TNCdatabase, available at: www.unctad.org/fdistatistics.
Table 2. United States: Inward FDIflows, 2000-2011 (US$ billion)
| Economy | 2000 | 2001 | 2002 | 2003 | 2004 | 2005 | 2006 | bgcolor=white>20072008 | 2009 | 2010 | 2011 | |
| United States | 314 | 159 | 75 | 53 | 136 | 105 | 237 | 216 | 306 | 153 | 198 | 227 |
| Comparator Economies | ||||||||||||
| China | 41 | 47 | 53 | 54 | 61 | 72 | 73 | 84 | 108 | 95 | 115 | 124 |
| United Kingdom | 119 | 53 | 24 | 17 | 56 | 176 | 156 | 196 | 91 | 71 | 51 | 54 |
| Germany | 198 | 26 | 54 | 32 | -10 | 47 | 56 | 80 | 4 | 38 | 47 | 40 |
| Russia | 3 | 3 | 3 | 8 | 15 | 13 | 30 | 55 | 75 | 36 | 41 | 53 |
| Japan | 8 | 6 | 9 | 6 | 8 | 3 | -7 | 23 | 24 | 12 | -1 | -2 |
Source: UNCTAD's FDI/TNCdatabase, available at: www.unctad.org/fdistatistics.
The flow of international capital supported the US economy in the 1980s and has been a key factor expanding economy.
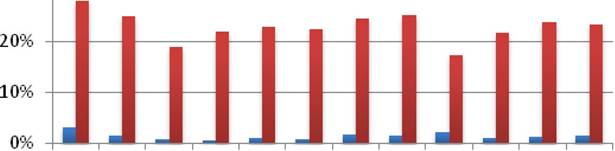
During the 1990s, the US experienced extraordinary inflow of FDI corresponding with exceptionally high output growth (Goss, Wingender and Torau, 2007).The inward US FDI stock as a percentage of GDP climbed up to 6% during 1980’s and up to 10% during 1990’s reaching a peak of 27% in 2000 and 25% in 2007. US FDI stock shows cyclical character and declined significantly after 2002 and 2008 as a result of economic recessions (Figure 1). This relatively high percentage of the FDI stock in GDP indicates important role of the inward FDI in the US economy (Kornecki, 2010).
Inward US FDI Employment
The FDI stock and the FDI-related employment are widely used as a measure of inward FDI effectiveness (Bode and Nunnenkamp, 2007). The most of the foreign direct investment flows in the United States between 2000 -2011 entered the manufacturing industry. The FDI inflow in manufacturing industry reached on average, during analyzed period of time 36% of the total foreign flows, followed by finance 16%, wholesale trade 10%, depository institution 6% (Figure 2). More detailed employment data are included in Tables 3, 4 and 5.
Each state has adopted a unique strategy to attract FDI as they compete for foreign investors. The leading states in foreign direct investment
Figure 1. Inward FDI stock and flow as a percentage of GDP, 2000-2011 Source: UNCTAD’s FDI/TNC database, available at: www.unctad.org/fdistatistics.
30%
2000 2001 2002 2003 2004 2005 2006 2007 2008 2009 2010 2011
■ U.S. Inward FDI flows as% of GDP ■ U.S. Inward FDI stock as % of GDP
Figure 2. Sectoral distribution of US inward FDIflows in % (2000-2011, average)
Source: United States Department of Commerce, Bureau of Economic Analysis, FDI database, available at www.bea.gov/ international
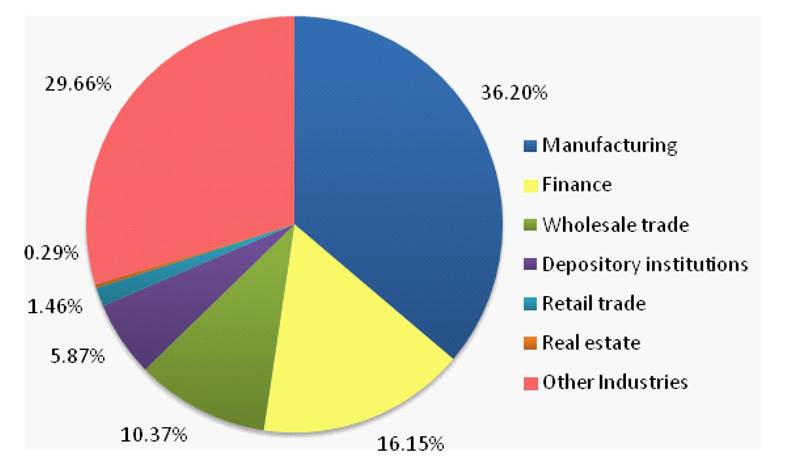
Table 3.
Sectoral distribution of US inward FDI flows, 2000-2011 (thousands of employees)| All Industries Total | 5,974 |
| Manufacturing | 2,277 |
| Retail trade | 665 |
| Wholesale trade | 591 |
| Finance and insurance | 340 |
| Information | 339 |
| Professional, scientific, and technical services | 217 |
| Real estate and rental and leasing | 44 |
| Other industries | 1,502 |
Source: United States Department of Commerce, Bureau of
Economic Analysis, FDI database, available at www.bea.gov/ international
employment, in manufacturing, are: California, Texas, Ohio, Pennsylvania, Illinois, North Carolina, New York, New Jersey. The southern US states has become more aggressive in recruiting foreign investment by providing incentives to attract investments and communicating the unique advantages they offer to foreign companies. Many southern states have been successful in improving their economies and providing new employment opportunities by offering the incentives attracting foreign capital (Borstorff, Collum and Newton, 2007).
Many foreign investors choose the southern part of the US as a desirable location for their FDI. Southern states invite large industrial employers in order to continue the evolution from an agricultural economy to a manufacturing economy. Tennessee, Alabama, Georgia, Kentucky, South Carolina and Texas have welcomed foreign automakers with numerous incentives. Currently, more than 300 foreign-based manufacturers from more than 30 nations operate in Alabama. Out of these foreign-based companies, three are major automobile manufacturers; Honda, Hyundai, and Mercedes (Borstorff, Collum and Newton, 2007).
The Financial Structure of the US Capital Inflows
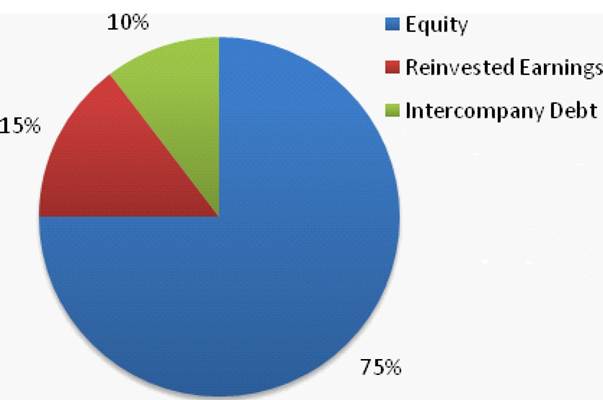
Among the components of inward US FDI flows between 2000 and 2011 (equity investment, reinvested earnings, intra-company loans), equity
Table 4.
United States inward FDI employment by sectors, 2000-2010 (thousands of employees)| Sector | 2000 | 2001 | 2002 | 2003 | 2004 | 2005 | 2006 | 2007 | 2008 | 2009 | 2010 |
| All Industries Total | 6,525 | 6,268 | 5,925 | 5,713 | 5,617 | 5,666 | 5,803 | 6,089 | 6,325 | 5,979 | 5,802 |
| Manufacturing | 2,705 | 2,531 | 2,372 | 2,242 | 2,133 | 2,115 | 2,166 | 2,215 | 2,294 | 2,162 | 2,110 |
| Retail trade | 667 | 755 | 678 | 674 | 695 | 643 | 633 | bgcolor=white>562658 | 677 | 670 | |
| Wholesale trade | 564 | 588 | 547 | 556 | 579 | 591 | 629 | 678 | 626 | 576 | 564 |
| Finance and insurance | 300 | 323 | 284 | 275 | 267 | 265 | 286 | 431 | 491 | 408 | 407 |
| Information | 410 | 311 | 314 | 317 | 290 | 313 | 331 | 339 | 377 | 369 | 363 |
| Professional, scientific, and technical services | 154 | 194 | 171 | 180 | 193 | 213 | 219 | 259 | 265 | 271 | 263 |
| Real estate and rental and leasing | 47 | 44 | 36 | 39 | 59 | 53 | 46 | 40 | 40 | 40 | 41 |
| Other industries | 1,679 | 1,522 | 1,524 | 1,430 | 1,401 | 1,474 | 1,493 | 1,564 | 1,573 | 1,477 | 1,387 |
Source: United States Department of Commerce, Bureau of Economic Analysis, FDI database, available at www.bea.gov/international
Table 5.
Inward US FDI employment by sectors, 2000-2010 (as % of total FDI employment)| 2000 | 2001 | 2002 | 2003 | 2004 | 2005 | 2006 | 2007 | 2008 | 2009 | 2010 | |
| All Industries Total | 100% | 100% | 100% | 100% | 100% | 100% | 100% | 100% | 100% | 100% | 100% |
| Manufacturing | 41.5% | 40.4% | 40.0% | 39.2% | 38.0% | 37.3% | 37.3% | 36.4% | 36.3% | 36.2% | 36.4% |
| Retail trade | 10.2% | 12.0% | 11.4% | 11.8% | 12.4% | 11.3% | 10.9% | 9.2% | 10.4% | 11.3% | 11.5% |
| Wholesale trade | 8.6% | 9.4% | 9.2% | 9.7% | 10.3% | 10.4% | 10.8% | 11.1% | 9.9% | 9.6% | 9.7% |
| Finance and insurance | 4.6% | 5.2% | 4.8% | 4.8% | 4.8% | 4.7% | 4.9% | 7.1% | 7.8% | 6.8% | 7.0% |
| Information | 6.3% | 5.0% | 5.3% | 5.5% | 5.2% | 5.5% | 5.7% | 5.6% | 6.0% | 6.2% | 6.3% |
| Professional, scientific, and technical services | 2.4% | 3.1% | 2.9% | 3.2% | 3.4% | 3.8% | 3.8% | 4.3% | 4.2% | 4.5% | 4.5% |
| Real estate and rental and leasing | 0.7% | 0.7% | 0.6% | 0.7% | 1.1% | 0.9% | 0.8% | 0.7% | 0.6% | 0.7% | 0.7% |
| Other industries | 25.7% | 24.3% | 25.7% | 25.0% | 24.9% | 26.0% | 25.7% | 25.7% | 24.9% | 24.7% | 23.9% |
Source: United States Department of Commerce, Bureau of Economic Analysis, FDI database, available at www.bea.gov/international
investment is the one that is related most directly to long-term international investment strategies and constitute 75% of capital inflows (Figure 4).
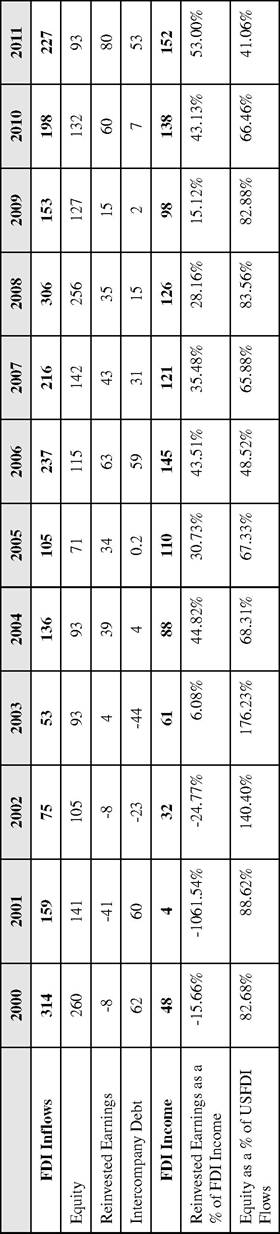
Based on Table 6, foreign direct investment financial flows were US$ 227 billion in 2011, up from US$ 198 billion in 2010 and consisted of US$ 93 billion in net equity investment, US$ 80 billion in reinvested earnings, and US$ 53 billion in net intercompany debt investment inflows. Net equity investment was the largest component in 2011, but it was lower than in 2010 (US$132 billion) and it was at its lowest level since 2005 (US$ 71 billion). Reinvested earnings increased in comparison with 2010 from US$ 60 billion to US$ 80 billion in 2011. Borrowing transactions between US affiliates and foreign parent groups increased the direct investment position by $53 billion in 2011 from $7 billion in 2010. The 2011 intercompany debt investment increase was the largest since 2006 (US$ 59 billion) (Barefoot & Ibarra, 2011).
Figure 3. FDI employment in manufacturing by the states (in thousands), 1980 - 2009
Source: Bureau of Economic Analysis, Comprehensive Financial and Operating Data Archive by Industry of Affiliate, (http:// www.bea.gov/international/di1fdiop.htm) (Tables F7 & G7)
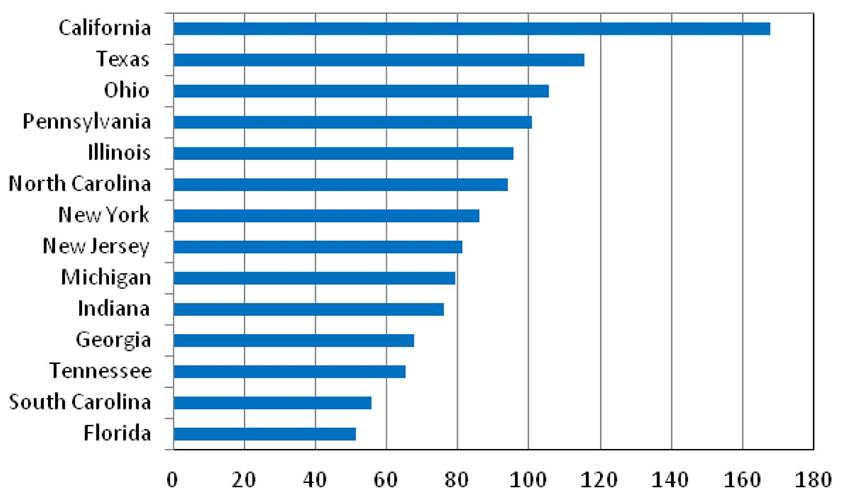
Figure 4. The structure of US FDI inflows by financial components in % (2000-2011, average)
Source: United States Department of Commerce, Bureau of Economic Analysis, FDI database, available at www.bea.gov/ international
In 2010 and 2011 inward US FDI reinvested earnings (negative in2002) increased respectively to 43% and 53% of generated FDI income coming back to pre- crises level (43% in 2006). Equity as a percentage of US FDI flows shows declining tendency since 2009 (Table 6).
Principal Foreign Affiliates in the United States
The list of principal foreign affiliates in the United States, ranked by revenue for 2010, was largely dominated by affiliates of European Multinational Enterprises (MNEs) (Table 7).
Shell Oil, the US affiliate of Royal Dutch Shell (Netherlands) topped the list, followed by BP America, an affiliate of British Petroleum (BP) (United Kingdom). Foreign affiliates in manufacturing featured prominently on the list. Included in the top twenty foreign affiliates by revenue were the affiliates of five automobile manufacturing firms: Toyota Motor, Honda Motor, and Nissan Motor from Japan, as well as Daimler and Volkswagen from Germany; US affiliates of foreign MNEs in electronic manufacturing, with established names like Siemens (Germany), Sony (Japan) and Samsung (Republic of Korea) were also among the top twenty, ranking 10th, 15th and 8th, respectively.
In the midst of the global recession, US FDI inflows and especially mergers and acquisitions (M&As) were particularly affected. Despite the reduction in FDI inflows, the US remains the largest host economy for FDI, and European MNEs and their affiliates continue to dominate FDI in that country. The bulk of M&A purchases by foreign firms during this time took place in financial services and largely involved commercial banks attempting to restructure balance sheets and mitigate losses. A number of greenfield investments were cancelled or postponed. The largest greenfield FDI projects between 2008 and 2010 were in energy and manufacturing. The dramatic surge in large greenfield investments in 2010 in manufacturing
Source: United States Department of Commerce, Bureau of Economic Analysis, FDI database, available at www.bea.gov/international
Table 7. Principal foreign affiliates in the United States (ranked by revenue, 2010)
| Rank 2010 | Rank 2000 | Foreign Investor | Home Economy | Name of Affiliate | Industry | Revenue (US $ Billion) |
| 1 | 6 | Royal Dutch Shell | Netherlands | Shell Oil | Oil | 285.1 |
| 2 | 7 | BP | U. K. | BP America | Oil | 246.1 |
| 3 | 8 | Toyota Motor | Japan | Toyota Motor North America | Automobile | 204.2 |
| 4 | 20 | AXA Group | France | AXA Group | Insurance | 175.3 |
| 5 | 9 | ING Group | Netherlands | ING America Insurance Holdings | Diversified finance | 163.2 |
| 6 | 36 | Volkswagen | Germany | Volkswagen of America | Automobile | 146.2 |
| 7 | 38 | Daimler AG | Germany | Daimler (US) | Automobile | 109.7 |
| 8 | 890 | Samsung | Korea | Samsung Electronics | Semiconductors and products | 108.9 |
| 9 | 1 | HSBC Holdings | U.K. | HSBC Bank USA | Banking | 103.7 |
| 10 | 50 | Siemens | Germany | Siemens | Electrical eng.& electronics | 103.6 |
| 11 | 45 | Nestle | Switzerland | Nestle USA | Food, nutrition, health, cosmetics | 99.1 |
| 12 | 68 | Honda Motor | Japan | Honda North America | Automobile | 92.4 |
| 13 | 172 | Deutsche Telekom | Germany | T Mobile | Telecom services | 89.8 |
| 14 | 96 | Nissan Motor | Japan | Nissan Motor (US) | Automobile | 80.9 |
| 15 | 182 | Sony | Japan | Sony Corporation of America | Consumer electronics, entertainment | 77.7 |
Source: Information compiled by the Organization for International Investment & RSM McGladrey, available from: http://www.ofii.org/ resources.
and energy included investments valued at more than US$ 1.1 billion each by Iberdrola (Spain), Solar Millennium (Germany), Blue Chip Energy Gmbh. (Austria), and the Gestamp Group (Spain). The largest greenfield FDI project of 2010 was in the manufacturing sector, by Samsung of the Republic of Korea, with an investment of US$ 3.6 billion (Kornecki, 2013).
In 2008 and 2009, several foreign pharmaceutical companies undertook large multi-billion M&A deals in the United States. Swiss Roche Holding AG targeted Genentech Inc. (valued at US$ 46.7 billion), and InBevNV from Belgium targeted Anheuser-Busch in a deal valued at US$ 52.2 billion. During this period, the bulk of M&As by foreign MNEs in the United States occurred in the financial sector and, in particular, involved commercial banks, as part of the efforts to rerestructure balance sheets and prevent further systemic risk and liquidity crises set in motion by the multi-billion dollar fall of Lehman, prefaced just months earlier by that of Bear Stearns. In 2009, M&As involving U S commercial banks continued, mainly by MNEs from home countries that had been relatively immune to the liquidity crisis, such as Canada and Singapore (Kornecki, 2013)
The largest cross-border acquisitions in 2011 were by Sanofi-Aventis (SA), a French biological products company, valued at US$ 21.2 billion, and one by BHP Billiton Ltd., a crude petroleum and
Figure 5. M&A and Greenfield projects comparison, 2003-2011 (USD billions)
Source: United States Department of Commerce, Bureau of Economic Analysis, FDI database, available at: www.bea.gov/ international
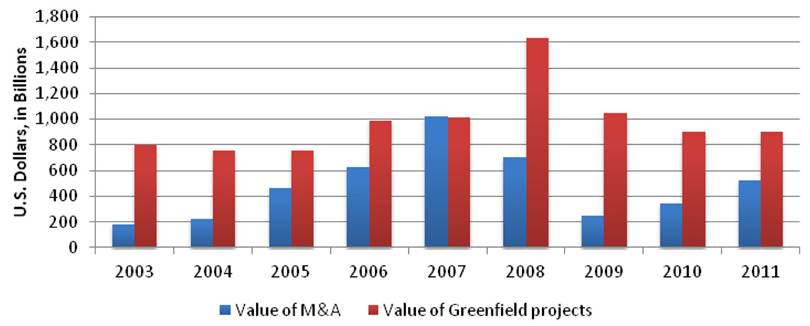
natural gas company from Australia, valued at US$ 11.8 billion. In 2010, the largest cross-border acquisition in the United States was that by the German pharmaceutical company Merck KGaA (the world’s largest maker of liquid crystal), of the US biotechnology equipment manufacturer Millipore Corp, valued at US$ 6.2 billion. The oil and gas industry continued to account for a significant portion of cross-border M&As in the United States in 2010 and 2011. M&A transac-
Table 8. Top ten M&A companies in the US (2011 million US$)
| Year | Acquiring Company | Home Economy | Target Company | Target Industry | Shares Acquired (%) | Value (US$ Million) |
| 2011 | Sanofi-Aventis SA | France | Genzyme Corp | Biological products | 100 | 21,230 |
| 2011 | BHP Billiton Ltd | Australia | Petrohawk Energy Corp | Crude petroleum and natural gas | 100 | 11,766 |
| 2011 | Mitsubishi UFJ Finl Grp Inc | Japan | Morgan Stanley | Offices of bank holding companies | 100 | 7,800 |
| 2011 | Ensco PLC | United Kingdom | Pride International Inc | Drilling oil and gas wells | 100 | 7,306 |
| 2011 | Teva Pharmaceutical Industries | Israel | Cephalon Inc | Pharmaceutical preparations | 100 | 6,311 |
| 2011 | Toronto-Dominion Bank | Canada | Chrysler Financial Corp | Personal credit institutions | 100 | 6,300 |
| 2011 | BHP Billiton Ltd | Australia | Chesapeake Energy Corp. | Crude petroleum and natural gas | 100 | 4,750 |
| 2011 | Bank of Montreal | Canada | Marshall & Ilsley Corp. | National commercial banks | 100 | 4,095 |
| 2011 | ABB Ltd | Switzerland | Baldor Electric Co | Motors and generators | 90 | 3,895 |
| 2011 | Unilever PLC | United Kingdom | Alberto-Culver Co | Perfumes, cosmetics | 100 | 3,842 |
Source: Thomson ONE Banker, Thomson Reuters (2011)
tions like Goldcorp’s US$ 3.3 billion acquisition of Andean Resources Ltd. in 2010 formed part of a critically important growth strategy for metals and mining companies benefiting from higher metal prices (Kornecki, 2013).