MAIN FOCUS OF THE ARTICLE
This empirical research investigates state based factors affecting the inward FDI employment among fifty states of the United States, uses annual data for the period of time from 1997 to 2007 and identifies several state-specific determinants of FDI employment.
It assumes that the major factors influencing inward US FDI employment in the US economy are: real wages, infrastructure, unionization level, educational attainment, FDI stock, manufacturing density, gross state product growth rate, real per capita taxes and share of scientists and engineers. Our findings indicate the importance of selected variables in evaluating the effects of FDI flow on state employment.Literature Review and Hypotheses
The empirical literature related to the state based determinant of FDI employment in the US is limited. In evaluating the effects of FDI on the local economies, economists focus primarily on the performance of foreign-owned subsidiaries operating in the US It is already known that the establishment of a new foreign subsidiary or the expansion of an already existing one leads to higher employment and wages (Axarloglou, 2005). Reserchers identified link between job growth in the US economy during a period of increasing foreign direct investment flow. The economic impact on US employment due to FDI is evident, as are linkages among the various benefits due to the inward flow of FDI (Craig, 2008).
According to Axarloglou & Pournarakis in the last two decades, various US states offered strong economic incentives in an effort to attract FDI inflows, with the hope that FDI would stimulate local economies (Axarloglou & Pournarakis, 2005). Axarloglou, Casey and Han analyzed the effects of FDI inflows in local economies across US states. The empirical results point out that the US economy benefits from FDI inflows in manufacturing both in terms of employment and real wages.
Overall, FDI inflows have a positive and in several cases statistically significant impact on local employment and wages. However, these effects vary across US states. In some states, such as California, Michigan, Ohio and Pennsylvania, FDI inflows appear to expand both employment and wages while in others, like Florida, Georgia and Virginia appear to depress both employment and wages. Finally, in several US states, such as in Connecticut, Delaware, Kentucky, and Louisiana, FDI inflows have mixed effects on local labor markets, with predominantly negative effects on local employment and expanding effects on local wages. There is evidence that these results are due to the industry composition of FDI inflows across states. FDI inflows in Printing and Publishing, Fabricated Metals, Industrial Machinery and Transportation Equipment have positive employment and wages effects, while FDI inflows in Furniture and Leather have negative effects (Axarloglou, Casey & Han, 2006).The studies by Borstorff, Collum and Newton relate to FDI in the southern US, specifically automobile FDI in Alabama and describe statespecific features of southern states in recruiting foreign investment bringing the employment opportunities (Borstorff, Collum & Newton, 2007). Ajaga and Nunnen a analysis complements the regression analysis of Mullen and Williams and the Markov chain approach of Bode and Nunnen- kamp and presents strong evidence of favorable FDI effects on output and employment at the level of US states (Ajaga & Nunnen, 2008).
Alfaro examined the effect of foreign direct investment on growth in the primary, manufacturing, and services sectors. Foreign direct investments in the primary sector, however, tend to have a negative effect on growth, while investment in manufacturing a positive one. Evidence from the service sector is ambiguous (Alfaro, 2003). Blomstrom, Fors and Lipsey compared the relation between foreign affiliate production and parent employment in US manufacturing multinationals with that in Swedish firms.
US multinationals allocated some of their more labor-intensive operations in developing countries, reducing the labor intensity in their home production. Swedish multinationals produce relatively little in developing countries and most of it in high-income countries, such as the United States and Europe associated with more employment, particularly blue-collar employment, in the parent companies (Blomstrom, Fors and Lipsey, 1997). Bode and Nunnenkamp investigated the effects of inward FDI on per-capita income and growth of the US states since the mid-1970s. This study analyzed the long-run relationships between inward FDI and economic outcomes in terms of value added and employment at the level of US states (Bode & Nunnenkamp, 2007). The study found that employment-intensive FDI, concentrated in richer states, has been conducive to income growth, while capital-intensive FDI, concentrated in poorer states, has not.Methodology
Data Sources and Variables
In order to test the implications of our models, we collected a panel of aggregate data on foreign direct investment on all US states, excluding the District of Columbia. The entire data set includes 50 states for which foreign direct investment and all other relevant variables are reported over the 1997-2007 period.
In the United States, the Bureau of Economic Analysis (BEA) (BEA, 2013a), a section of the US Department of Commerce, is responsible for collecting economic data related to FDI flows. Monitoring this data is very helpful in trying to determine the impact of FDI on the overall economy, but is especially helpful in evaluating states and industry segments. The data on stock of FDI are from the US Department of Commerce, Bureau of Economic Analysis (BEA) (BEA 2013a),
The real per capita disposable income is measured as the nominal per capita disposable income deflated by the GDP deflator in constant (2000) US dollars. The real per capita taxes is measured by dividing the real state tax revenue by the state population.
The nominal tax revenue for states are from various issues of the Annual Survey of State Government Finances (CENSUS 2013) published by the US Department of Commerce. The nominal tax revenue was deflated by the GDP deflator to derive the real state tax revenue. The data on state population are from the US Census Bureau (CENSUS 2013). The real per capita expenditure on education is measured by dividing the real state education expenditure by the state population. The nominal education expenditure for states are from various issues of the Annual Survey of State Government Finances (Census 2013) published by the US Department of Commerce. The nominal education expenditure was deflated by the GDP deflator to derive the real state education expenditure.The share of scientists and engineers in the workforce, a proxy for labor quality, is collected from the National Science Foundation, Division of Science Resources Statistics, Science and Engineering Indicators 2010 (NSF 2013) The data on FDI related employment are collected from the Bureau of Economic Analysis while the data on state employment are collected from the US Department of Labor, Bureau of Labor Statistics (NSF, 2013). The information on real research and development expenditure is collected from the National Science Foundation, Division of Science Resources Statistics, Science and Engineering Indicators 2010 (NSF, 2013)
The data on the average wage and total state employment are collected from the US Department of Labor, Bureau of Labor Statistics. Following Coughlin, Terza, and Arromdee (1991), the manufacturing density variable is measured as the manufacturing employment per square mile of state land excluding federal land. The data on manufacturing employment are collected from the US Department of Labor, Bureau of Labor Statistics (BLS, 2013)). The information on union membership is collected from http://www. unionstats.com/(Unionstats, 2013) maintained by Barry Hirsch (Georgia State University) and David Macpherson (Trinity University).
The data on state unemployment rate are collected from the US Department of Labor, Bureau of Labor Statistics (BLS, 2013).Model Specification
Drawing on the existing empirical literature in this area, we specify the following model:
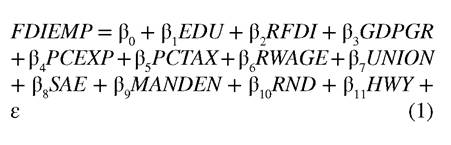
where:
FDIEMP: FDI Related Employment EDU: Educational Attainment RFDI: Real FDI Stock
GSPGR: Real GSP Growth Rate PCEXP: Real Per Capita Exports PCTAX: Real Per Capita Taxes RWAGE: Real Wage
UNION: Union Membership (Share of Workers who are Members of Labor Unions)
SAE: Share of Scientists and Engineers in the Labor Force
MANDEN: Manufacturing Density
RND: Real Research and Development Expenditure
HWY: Highway Mileage
FDIEMPit represents FDI related employment in state i in year t; EDUit is the real per capita expenditure on education in state i in year t; RF- DIit represents real FDI Stock in state i in year t; GSPGRit stands for real gross state product growth rate in state i in year t; PCEXPit is real per capita exports in state i in year t; PCTAXit symbolizes real per capita taxes in state i in year t; RWAGEit is real wage in state i in year t; UNIONit represents share of workers who are members of Labor Unions in state i in year t; SAEit stands for share of scientists and engineers in the labor force in state i in year t; MANDENit represents manufacturing density in state i in year t; RNDit relates to real research and development expenditure in state i in year t; HWYit stands for highway mileage in state i in year t.
Our first variable, the real per capita expenditure on education is expected to have a positive effect on foreign direct investment employment. Therefore, we would expect that β1 > 0. Our second variable, the real FDI stock is expected to have a positive effect on FDI employment.
Therefore, we would expect that β2 > 0. Our third variable the real gross state product growth rate is expected to have positive effect on FDI employment. Therefore, we would expect that β3 > 0. The fourth variable the real per capita exports is expected to be positive. The fifth variable the real per capita state taxes usually deter FDI flows and, therefore, is expected to be negatively related to foreign direct investment employment; thus, we would expect that β5 < 0. The sixth variable, real state per capita wages is a measure of market demand in a state and is expected to be positively related to foreign direct investment employment. Therefore, a priori, we would expect that β6 > 0. The next variable, unionization of the workforce is expected to be related positively to foreign direct investment employment. Thus we would expect that β7 >0.The eight variables, the share of scientists and engineers in the workforce, a proxy for labor quality is expected to have a positive effect on foreign direct investment employment. Therefore, we would expect that β8 > 0. The manufacturing density is expected to be related positively to foreign direct investment employment. Therefore, we would expect that β9 > 0. As Coughlin, Terza, and Arromdee (1991) and Head, Ries and Swenson (1995, 1999) point out, manufacturing density could also be used as a proxy for agglomeration economies. States with higher densities of manufacturing activity is expected to attract more foreign direct investment because the foreign investors might be serving existing manufacturers. Our tenth variable, the real research and development expenditure is expected to have a positive effect on foreign direct investment employment. Therefore, we would expect that β10 > 0. Highway mileage is a indicator of infrastructure is expected to be positively correlated with foreign direct investment employment. Therefore, we would expect that β11 > 0.
Empirical Results
The results of our empirical analysis are presented in Table 9., in addition to the eleven independent variables included in Equation (1). All the variables presented in Table 9 are expressed in logarithm and the coefficient of each variable can be interpreted as elasticities. The results of the study imply that FDI employment in the US is strongly influenced by the state spending on education. The coefficient of this variable is positive and statistically significant at the 1% level of significance.
The real stock of FDI has a positive and statistically significant effect on FDI related employment. The results of the study suggest that FDI employment is strongly correlated with the real FDI stock in the US This could be due to the fact that the states with high level of FDI employment also have larger FDI stock. Real per capita exports have the positive sign and are statistically significant at the 1% level. Most of the time higher FDI stock and employment result in higher state exports.
Real GSP growth rate has the unexpected negative sign and it is statistically significant at the 1% level. It can be explained by the fact, that many foreign investors choose the southern part of the US as a desirable location for their FDI. The southern US states has become more aggressive in recruiting foreign investment by providing incentives to attract investments and communicating the unique advantages they offer to foreign companies. The real per capita taxes has the expected negative sign and it is statistically significant at 1% level. This finding is also consistent with the findings of previous studies. Real wages have the positive sign and it is statistically significant at 1% level. It is known that foreign companies investing in US not only provide jobs, but relatively high-paying jobs what constitutes important determinant of FDI employment. Unionization variable has an expected positive sign and it is statistically significant at the 1% level of significance. Sur-
Table 9. Determinants of FDI related employment in the United States, 1990-2007. Panel least squares estimates, dependent variable: FDI related employment.
| Variable | Coefficient | t-Statistic |
| Constant | -248.2263*** | -13.34 |
| Education | 1.6966*** | 9.08 |
| Real FDI stock | 1.8515*** | 9.04 |
| Real GSP Growth Rate | -3.2924*** | -16.23 |
| Real Per Capita Exports | 0.0603*** | 5.11 |
| Real Per Capita Taxes | -0.0600*** | -10.37 |
| Real Wages | 15.5267*** | 14.13 |
| Unionization | 2.5801*** | 7.79 |
| Scientists and Engineers | -0.1157 | -0.68 |
| Manufacturing Density | 0.0003 | 0.03 |
| Real Research and Development Expenditure | 0.0000 | 0.24 |
| Highway Mileage | 9.9975*** | 7.13 |
| Adjusted R2 | 0.8662 | |
| Number of Periods | 18 | |
| Number of Cross-Sections | 50 | |
| Number of Observations | 900 |
Note: *** indicates the statistical significant at the 1% level.
prisingly, the share of scientists and engineers in the workforce has an unexpected negative sign. It can be related to the fact that the labor force is relatively more productive and skilled in urban than in rural areas. Manufacturing density variable has the expected positive sign. This variable is also expected to capture the agglomeration economies and we can guess that the more dense the manufacturing activity is in a given state, the more likely higher foreign direct investment employment will be. However, current results reveal that the Southeast region in the US stems from relatively high manufacturing density. Highway Mileage represents infrastructure level in the state and it is definitely positively correlated with the FDI employment at the 1% level of significance.
More on the topic MAIN FOCUS OF THE ARTICLE:
- THERE IS NO such thing in England and Wales as a criminal justice system; only a series of government departments and public agencies that contribute to a process of justice in response to a variety of criminal events.
- MIT’s Offer
- Introduction
- Forecasting Failure
- Introduction
- Introduction
- Dynamics and the Business Cycle
- B The Hypothesis in Science Education
- Clearly, there is no shortage of theories as to the causes, processes, outcomes and management of conflict.
- The Diverse Market of Legal Aid in Today’s