Chapter 69 Analysis of the Analytical Balance Sheet of Central Bank of Republic of Turkey During 2000 - 2009 Period in Terms of Crises
Yildiz Ozkok
Hasan Kalyoncu University, Turkey
ABSTRACT
Today, Central Banks’ primary target is to maintain the price stability. In that context, through their monetary policy, they intervene in the money market with different tools.
The Analytical Balance Sheet was created upon summing up and offsetting Balance Sheet of the Central Bank of Republic of Turkey (CBRT) in order to represent specific monetary aggregates. By means of that, CBRT aims to make the balance sheet more understandable and simple. In this chapter, firstly the sub items of the Analytical Balance Sheet are explained; secondly, the economic crises of Turkey during 2000-2009 is mentioned; finally, effects of these crises on the CBRT’s Analytical Balance Sheet, changes in monetary aggregates which are Currency Issued, Reserve Money, Monetary Base, and Central Bank’s Money, and in this context structure of the monetary policy of the CBRT in this period is analyzed.INTRODUCTION
A commercial bank or a private company’s financial statements are important business tools which allow understanding the details about the performance of it. However, the main goal of a central bank is to maintain the price stability not a profit maximization, therefore to interpret accounting records of a central bank is much more complex (Hawkins, 2002: 71).
The balance sheet of a central bank is an important source of information that is shaped by the interaction of monetary policy and the financial system of this country, and also it is crucial for other units of the economy when making decisions (Parasiz, 2000). A central bank is responsible for managing monetary policy. A central bank sets targets which are relevant the assets and the liabilities of its own balance sheet and then tries to achieve goals by using the instruments in its hands and by taking into account cyclical developments in economy.
That is called monetary policy. Instruments used by a central bank are the emission, reserve requirement ratio, liquidity ratio, open market operations etc. These affect both a central bank’s balance sheet and the economic activities. Accordingly, the best analysis of the central bank’s monetary policy that is used by the central bank to reach economic targets can be made by observing its balance sheet (Acar, 1999). However, it is very difficult to follow and make comments about central banks’ monetary policies and interventions through its balance sheet. So, the Analytical Balance Sheet was created upon summing up and offsetting balance sheet of the Central Bank of Republic of Turkey (CBRT) in order to represent specific monetary aggregates. It makes the balance sheet more understandable and simple. Moreover, the CBRT’s foreign exchange and Turkish Lira (TL) movements can be seen in a clear manner in its analytical balance sheet (Ardic, 2004: 209). The assets of the Analytical Balance Sheet exhibit how to provide liquidity of economy, while the liabilities show the form of finance of liquidity which is needed in the economy.DOI: 10.4018/978-1-4666-6268-1.ch069
.
Turkey had 3 economic crises during 20002009 period. These are “November of 2000” that was banking crisis, “February 2001” which was currency crisis and lastly “2008” that was global economic crisis. It is important how to read CBRT’s Analytical Balance Sheet in terms of these three crises.
In this paper, first of all the CBRT’s Analytical Balance Sheet will be explained and then the economic crises of Turkey during 2000-2009 period will be mentioned, briefly. After that, effects of these crises on the Analytical Balance Sheet, changes in monetary aggregates and in this context structure of the monetary policy of the CBRT in this period will be examined. These monetary aggregates are Currency Issued (CI), Reserve Money (RM), Monetary Base (MB), and Central Bank’s Money (CBM). The main purpose of this study is to analyse both foreign exchange & TL movements and monetary aggregates in the Analytical Balance Sheet, actions and reactions of the CBRT to these economic crises and its monetary policy strategies during 2000-2009 period.
ANALYTICAL BALANCE SHEET OF THE CBRT
Assets
The CBRT must control the size and the composition of its balance sheet in order to enforce effective monetary policy. In this regard, the CBRT prepares Analytical Balance Sheet, which makes it more simple and straightforward. Analytical Balance Sheet consists of assets and liabilities.
Assets side of the CBRT determines the value of money. If the CBRT wants to affect interest rates and financial magnitudes in the market, the size of its balance sheet should be large enough in proportion to the size of the economy (Fazio, 1991: 127). The Central Bank firstly finds the assets and then it would create the source which finances this assets side (Ardic, 2004, 197). The Assets consist of two main items: The Foreign Assets and the Domestic Assets.
The Foreign Assets (FA) includes foreign currency, gold, foreign credit, temporary debtors and affiliates of the CBRT (Istanbul Univ., 2003: 48). Foreign exchange inflows and foreign exchange purchases due to the use of foreign credit lead to an increase in foreign assets (CBRT, 2009). Accumulation of FA of the CBRT can be evaluated as a function of country’s gain of foreign exchange (Iskenderoglu, 1993: 42).
The second part of assets is Domestic Assets (DA). The DA involves Cash Operations, Foreign Exchange Revaluation Account and IMF Emergency Assistance Account.
Cash Operations include Treasury Debt, Credit to Banking Sector, Credit to Savings Deposit Insurance Fund (SDIF) and Other Items. Formerly the Treasury could use short-term advances in order to eliminate the state revenue-expense imbalances from the CBRT. In line with the changes in EU norms and international Central Banking practices, a new Central Banking law was enacted on May 5, 2001. The main aim of these amendments was to strengthen the Central Bank’s operational independence. In order to sustain independence, the law established that the Bank should not grant advances or extend credit to the Treasury or public establishments and institutions.
It was also legislated that the Bank should not purchase debt instruments issued by the Treasury or by public establishments and institutions in the primary market (CBRT, 2001: 113). The second subitem is Foreign Exchange Revaluation Account which contains the re-evaluation profit or loss of the FA and liabilities when TL depreciates or appreciates against foreign currencies (Istanbul University, 2003: 49). If foreign assets are bigger than foreign liabilities when the foreign currency rises, Revaluation Account decreases, otherwise it increases. In fact, the size of this account is an indicator of the risk of the balance sheet. Growth of the account is a factor restricting the ability of the CBRT to make cash transactions. The third and the last item is IMF Emergency Assistance Account which is reserve position of the Treasury from the IMF.Liabilities
Liability side of the Analytical Balance Sheet shows the CBRT’s total liabilities to the banking and non-banking sector. Foreign exchange and TL are two types of funding source of the CBRT. The first one is the total foreign liabilities and the second one is the Central Bank’s Money (CBM).
The Total Foreign Liabilities, which are the financing sources of the CBRT in terms of foreign exchange, include the foreign exchange liabilities to both abroad and domestic side. Liabilities to Non-residents and Liabilities to Residents are two sub-items of Total Foreign Liabilities. The major part of the Liabilities to Non-residents item is the Foreign Exchange Deposit Accounts which belong to the Turkish citizens living abroad. The Liabilities to Residents part includes Foreign Exchange Deposits of Non-Banking Sector and the Foreign exchange Deposits of B anking Sector. The first one mainly reflects the Treasury’s foreign currency deposits. The latter one is the amount of foreign currency, which the CBRT will pay the banks on the maturity date of the reserve requirement and free deposits as well as swaps.
The CBM is the total TL liabilities of the Central Bank to all units of economy.
The CBM is the largest monetary aggregate created by the CBRT. It is the sum of RM, OMO and TL Deposits of Public Sector (Yardimci, 2006: 164).RM is an important monetary aggregate because of its power to affect other monetary aggregates. The first sub-item of the RM is “Currency Issued (Emission)” (CI) which is used for demonstration ofthe difference between banknotes that are put into circulation and withdrawn from circulation (Altunoglu, 2009: 1). The second one is “Deposits of the Banking Sector” which contains the Required Reserves and the Free Deposits. The Required Reserves item is the amount of required reserves of banks in the CBRT. The most significant function of Required Reserves is to be a tool of controlling the money supply. Central Bank can affect the excess reserves of the banks and the expansion of their deposit money by changing required reserve ratios (Parasiz, 2000: 307). By the way, other sub-items of RM are the “Extra Budgetary Fund” and “Deposits of the Non-Banking Sector.”
Other Central Bank Money includes OMO and TL Deposits of Public Sector. In the broadest sense; OMO is buying and selling of the financial instruments by the Central Bank in the primary market or secondary market. OMOs can be classified as repurchase agreements, reverse repurchase agreements, outright purchases and outright sales. These actions expand or contract total reserves of the banking system and so it affects the money supply in the economy. That is to say, the Central Bank uses OMOs as a monetary policy tool to influence the money supply (Akcay, 1997). For example, if monetary authority aims to withdraw currency from circulation or decrease the excess reserve in the banking system, it engages in open market sales and for an expansionary monetary policy it buys bonds from economic agents. When the Central Bank supplies liquidity to the market as a creditor, this item will be minus; when it absorbs the fund from the market as a debtor, this item will change in the positive direction.
Moreover, TL Deposits of Public Sector, which are the second item of Other Central Bank’s Money, contain total deposits of the public sector, especially the Treasury.A BRIEF OVERVIEW OF THE CRISES DURING 2000-2009 PERIOD
The November 2000 Crisis
In December 1999, the Turkish government launched an exchange-rate-based stabilization program with the support of the Bretton Woods Institutions in order to bring down inflation and check what looked like an unsustainable process of public debt accumulation. The program appeared to be on course in the subsequent nine months, enjoying wide public confidence and support as well as gaining praise from IMF officials (Akyuz and Boratav). The interest rates, wage rates and prices were released to float in this program, while the foreign exchange was foreseen to be increased in a fixed rate. In the first half of2000, the program yielded positive results. Inflation fell to the lowest level since the 1980s, the economy experienced a recovery, interest rates declined and structural reforms were applied (Karacor, 387). However, the fast decline in interest rates was a dangerous development in terms of policy of fighting against inflation. The CBRT’s inflation program began to suffer, despite the fact that the Treasury’s debt burden decreased. It started running into problems in Autumn 2000.
The crisis in the November of2000is a banking crisis. The lag between the targeted inflation and the expected inflation was huge. Banks which have open positions faced with liquidity problems and began to sell bonds, then interest rates rose. Consequently, the banks trying to close their positions raised the foreign exchange demand in the market (Coskun & Balatan, 2009: 22-23). The public and the private banks tried to have foreign borrowing (euro) in a flurry and interest rates continued to increase. This rise in interest rates put into trouble some banks. Banks faced huge losses because they were forced to fund the Treasury bills which were in their hands. Because, the CBRT could not fund the markets due to the its monetary policy, the crisis deepened. This situation increased foreign investors’ foreign exchange demand; they sold the Treasury bills in their hands and went out from the market. Lastly, the liquidity crisis had occurred. Although the first resistance of the CBRT not to exceed its Net Domestic Asset (NDA) target, eventually it had to provide liquidity to the market through the OMOs (Gaygili, 2007: 150). Accordingly, the Net Domestic Assets (NDA) of the policy was abandoned.
In the CBRT’s NDA policy, it had a performance criterion of 1.200 trillion TL. Accordingly, the Central Bank could give the amount of TL creating in return of foreign currency inflows to the market and it could supply the additional liquidity only in this way. As noted above, at the beginning of the crisis, the Central Bank locked on the NDA target, resisted to provide additional liquidity injection to the market. Subsequently, it exceeded the target as mentioned above and provided additional liquidity injection. However, it was too late for the CBRT’s this intervention (Egilmez, 2006).
February 2001 Crisis
The banking crisis in November of 2000 turned into foreign exchange crises in February of 2001 and it became a twin-crisis.
The sharp increase in the current account deficit mainly caused the currency crisis in February of 2001. The reasons for these crises in 2000 and 2001 were an overvalued TL, high current account deficit which was over critical limit, the financial sector which was lack of capital, the open position (the bank - the real sector - the public side), public banks’ duty losses and as a result of them the rise in the profit and interest rate risk of the financial sector (Karacor, 388).
The IMF program was terminated in February 2001 as the internal debt market collapsed. In February 21, the CBRT did not lend money to the banks who failed to pay their debt at the appropriate time, so this attitude created a negative impact on the economy. In this regard, the overnight interest rates skyrocketed to 5000%. Greatly weakened banking system was faced with a collapse due to the interruption of the interbank payments system. As a result of increasing economic risks, floating exchange rate regime was began to implement instead of fixed exchange rate regime in February of 2001. 1 U.S. dollar rocketed from 685,000 TL to 1,270,000 TL on February 21 (Alic et al, 2009: 12). In the floating exchange rate system, foreign exchange rate is determined by the economic actors in the market and is permitted to fluctuate according to changing economic conditions (Mankiw, 2010: 381). As a result of the crisis, the stock market, employment, production and TL went into a downward spiral and the gross domestic product shrunk by 7.4% over the crisis year, the worst performance since World War II.
The CBRT’s foreign assets rose after 2001 because of important change in the exchange rate regime in 2001. Following the crisis, the banking sector and financial sector had been restructured in Turkey. In addition, the structure of the CBRT by law had been changed after the crisis (Yaku- poglu, 2011b: 21).
Global Crisis of 2008
2008 crisis was quite different than the previous ones for Turkey because it was a result of world matters. The most important reason for this economic crisis is shifting of capital in recent years from production to finance which is called financialization of capitalism. (Foster, 2008: 45). In other words, it is the change of the center of the gravity of the economy from production (even from growing service sector) to finance and also the real economy had been the victim of financialization. In that respect, global capital, squeezed in the monetary area instead of production, mainly caused the global crisis.
The Federal Reserve reduced the short-term interest rate to 1% at the end of2002 and the banks gave widespread mortgage credits to consumers. That lies at the roof of the global crisis of 2008 (Alic et al., 2009: 14). In 2006, the crisis started in the form of repayment problems in the American mortgage market. These problems negatively impacted the world economies and it had turned into a global liquidity and credit crisis around the world in 2007 and 2008, due to the fact that the American economy is biggest economy in the world. The trustworthiness in the markets was damaged. Moreover, in 2008 with the bankruptcy of gigantic financial companies there was seen a sharp decline in stock market and increase in foreign exchange rates.
In September of2008, all countries, particularly developed countries, relax their monetary policies and started to apply expansionary fiscal policy to reduce the contraction in the economy. At the end of 2008, industrial production, employment and foreign trade narrowed in almost all the economies in the world (Yukseler, 2009: 5).
The global crisis has affected Turkey on the real sector side, unlike in the U.S.. This crisis has not affected Turkey from the asset market and financial side especially due to the fact that the domestic financial markets of Turkey were relatively less developed and complex derivative
financial products which were expanding in global markets especially in the last two decades were not trading in Turkey.
There was a sharp contraction in external demand and domestic demand in Turkey. The slowdown in Turkey’s economy reduced tax revenues, lowered the rate of capacity utilization, escalated unemployment. Only banks have been protected by the crisis. Banks who were experienced from the crises in 1994 and 2001 have been well supervision and control and also have had Capital Adequacy Ratio of about 18% which was higher than international standards (Erturk, 2010: 416-417).
ANALYSIS OF THE ANALYTICAL BALANCE SHEET OF CBRT DURING 2000 - 2009 PERIOD
Assets
The way of the CBRT’s effectiveness on interest rates and monetary and financial magnitudes in the market is dependent on the size of its balance sheet. It should be large enough in proportion to the size of economy (Fazio, 1991: 127). By the means of this, the Central Bank can apply its monetary policy by using its assets and liabilities.
The size of the Analytical Balance Sheet grew 255% in 2001, year on year (Table 1), because of both increase in the FA due to the devaluation in 2001 and the sudden rise in the DA. At the end of 2000s, the increase in international liquidity have resulted in a rise in short term foreign capital coming to Turkey, so it has led to increases in the Central Bank’s Foreign Assets (Yakupoglu, 2011b: 43). On the other hand, the reason of the rise in DA is the sharp increase of around 33 billion TL in the Government Domestic Debt Instruments (prior to November 5, 2001).
In 2008, the size of the balance sheet rose by 6.4%, but it shrunk by 3% in 2009 because while the FA ascended in the second half of 2008 due
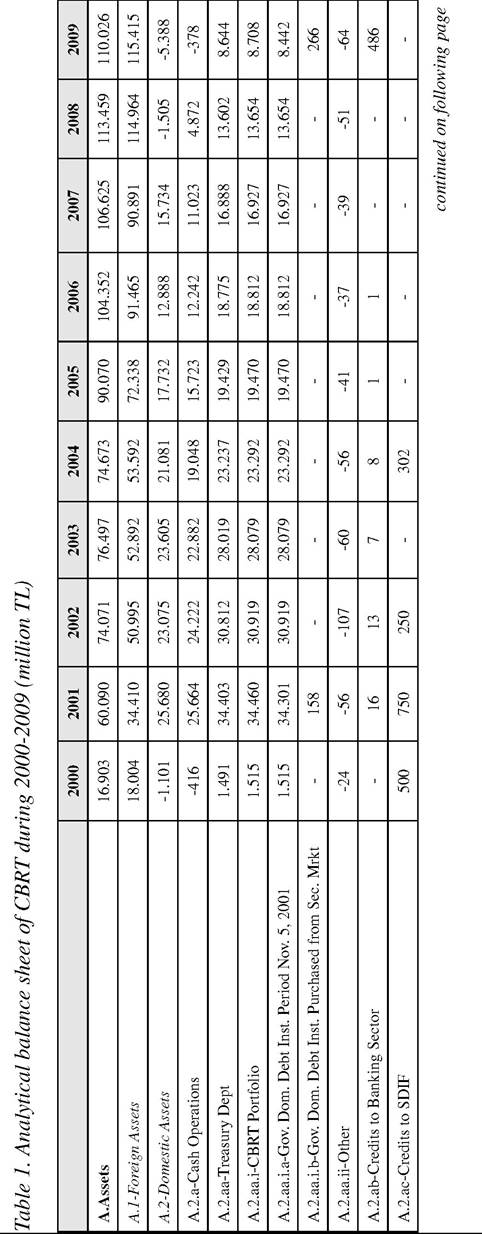
Table 1. Continued
| 2000 | 2001 | 2002 | 2003 | 2004 | 2005 | 2006 | 2007 | 2008 | 2009 | |
| A.2.ad-Other Items | -2.407 | -9.505 | -6.853 | -5.144 | -4.498 | -3.708 | -6.533 | -5.865 | -8.730 | -9.508 |
| A.2.b-FX Revaluation Account | -875 | -175 | -1.147 | 723 | 2.033 | 2.010 | 646 | 4.711 | -6.377 | -5.010 |
| A.2.c-IMF Emergency Assistance (Treasury) | 191 | 191 | - | - | - | - | - | - | - | - |
| P-Liability | 16.903 | 60.090 | 74.071 | 76.497 | 74.673 | 90.070 | 104.353 | 106.625 | 113.459 | 110.026 |
| P.l-Total Foreign Liabilities | 15.924 | 50.221 | 53.551 | 52.363 | 49.929 | 51.522 | 62.437 | 51.834 | 58.758 | 59.294 |
| P. l.a-Liabilities to Non-Residents | 10.406 | 36.733 | 37.369 | 35.648 | 30.554 | 22.858 | 24.328 | 19.913 | 22.128 | 22.917 |
| P-Lb-Liabilites to Residents | 5.518 | 13.487 | 16.182 | 16.715 | 19.375 | 28.665 | 38.109 | 31.922 | 36.630 | 36.377 |
| P. l.ba-FX Deposits of Non-Bank Sector | 1.222 | 3.139 | 5.463 | 6.518 | 6.099 | 13.874 | 18.691 | 12.248 | 14.928 | 15.904 |
| P. l.bb-FX Deposits of Banking Sector | 4.295 | 10.348 | 10.719 | 10.196 | 13.276 | 14.790 | 19.418 | 19.673 | 21.703 | 20.473 |
| P.2-Central Bank Money | 980 | 9.869 | 20.519 | 24.135 | 24.743 | 38.548 | 41.916 | 54.790 | 54.701 | 50.732 |
| P2. A-Reserve Money | 5.949 | 7.976 | 410.668 | 15.010 | 20.328 | 32.696 | 51.398 | 46.548 | 62.967 | 64.723 |
| R 2. Aa-Currency Used | 3.772 | 5.283 | 7.636 | 10.676 | 13.465 | 19.612 | 26.815 | 27.429 | 31.743 | bgcolor=white>38.340|
| P.2. Ab-Deposits of Banking Sector | 2.015 | 2.520 | 2.792 | 4.191 | 6.723 | 12.899 | 14.420 | 18.921 | 30.942 | 26.179 |
| P. 2. Aba-Required Reserves | 1.404 | 1.626 | 1.672 | 2.289 | 3.115 | - | - | - | - | - |
| P.2.Abb-Free Deposits | 611 | 894 | 1.120 | 1.903 | 3.608 | 12.899 | 14.420 | 18.921 | 30.942 | 26.179 |
| P. 2. Ac-Extrabudgetary Funds | 116 | 104 | 178 | 48 | 24 | 91 | 55 | 92 | 143 | 136 |
| P. 2. Ad-Deposits of Non-Bank Sector | 46 | 69 | 63 | 95 | 115 | 95 | 108 | 106 | 139 | 69 |
| P.2.B-Other Central Bank Money | -4.969 | 1.893 | 9.851 | 9.124 | 4.415 | 5.851 | 517 | 8.242 | -8.266 | -13.992 |
| P. 2. Ba-Open Market Operations | -5.219 | 1.244 | 9.579 | 8.260 | 3.622 | 4.983 | -1.098 | 3.911 | -10.126 | -18.917 |
| P.2.Bb-TL Deposits of Public Sector | 249 | 649 | 272 | 864 | 793 | 868 | 1.616 | 4.331 | 1.859 | 4.926 |
Source: Analytical Balance Sheet of CBRT (http://evds.tcmb.gov.tr)
to depreciation of TL, the DA was negative due to decrease of Government Domestic Debt Instruments (prior to November 5, 2001).
In compliance with the floating exchange rate regime, the foreign exchange rate would be determined by the market conditions. However, the CBRT also announced that it could intervene in the foreign exchange market “to prevent excessive volatility.” There were interventions in the foreign exchange purchase auctions were carried out to increase the foreign exchange reserves “without affecting the long-term equilibrium value of the foreign exchange rate” (CBRT, 2002, 2003). The CBRT keeps foreign exchange reserve to support monetary and foreign exchange policies, give confidence to the markets, perform government’s foreign exchange-denominated debt service to inside and outside and keep necessary foreign exchange liquidity in case of any external shock (CBRT, 2005: 4). The CBRT argued that foreign exchange buying auctions aimed to absorb the excess supply of foreign exchange due to reserve currency substitution. Excluding the 2001 crisis period, the CBRT has mainly bought foreign exchange from the market. The amount it bought 44 billion TL by auctions and 25.5 billion TL by interventions during 2000-2009 period. Thus, the Central B ank has benefited from the abundance of foreign exchange due to the international liquidity by increasing its reserves. As it can be seen from the Figure 1, after the crisis of 2001, FA began to rise and its share in the assets became almost full of the assets in 2009.
If the FA/assets ratio is big, this country has high source which is convertible into money regarding the other central banks and international markets (CBRT, 2009). According to Analytical Balance Sheet of the CBRT, while this ratio was 1.07 in 2000, it declined to 0.57 due the crisis, but later on it has risen gradually above to 1 in 2008 and in 2009 years, because as mentioned above, FA had increased after the crisis of 2001. On the other hand, despite a climb in FA of the CBRT, the ratio of FA to Turkey’s Gross Domestic Product (GDP) of Turkey moved in the range of about 10-14% during 2000-2009 period.
The ratio of FA to Total Foreign Liabilities which is called currency risk rate is the most important indicator of the strength of the Central Bank’s source which can be convertible to money in international markets and beside the other central banks (Serdengecti, 1997). According to the CBRT, a developing country who has a healthy balance sheet structure is expected to have bigger than one in developing countries because it is thought that when a country has balance of payments problems it will be more comfortable with higher FA (CBRT, 2006: 51). On the other hand, according to Akguc, the ideal value for this ratio is one. If the ratio is bigger than one, it shows that the balance sheet carries a higher risk (Akguc, 1993: 123).
Figure 1. The assets of the CBRT during 2000-2009 period (million TL)
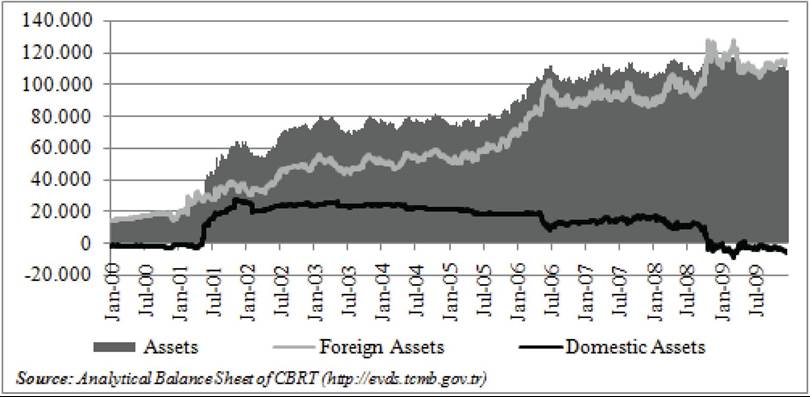
Because sudden shift in the direction of foreign exchange inflows and capital outflows, FA fell in November of 2000 and the current risk rate also declined from 1,5 to 1 due to the fact that DA did not change. During the second half of 2001, the CBRT’s foreign exchange reserves fell because it met the increasing foreign exchange demand of banks after the crisis of November of 2000 and banks’ foreign exchange deposits of banks rose after the crisis of February of2001. Thus, in 2001 the current risk rate decreased to 0.7%. After crises, in line with the Program of Transition to a Strong Economy, that increase in the FA and the foreign exchange deposits slowed down and reserves began to rise again, so the ratio began to ascend again. In the first half of 2002, it has increased due to fall in the CBRT’s liabilities because of the repayment of IMF loans in the first half of 2002 and beginning of the process of the reverse currency substitution. The currency risk rate moved in the range of 1-2 during the 2007-2009 period because FA was bigger than Total Foreign Liabilities. It ascended above 2 in 2009, which was important for increasing current account deficit of Turkey.
On the DA side, the share of DA in total assets was highest value in the period of 1980 - 1994 when a large portion of the public finance deficits were met by the CBRT sources. After 1994, the DA began to decline gradually due to the fact that the short-term advances to the Treasury for financing of public deficits began to decrease. In 2000, DA fell below zero in 2000, but after the economic crisis of February of 2001, it skyrocketed and its share in the assets also increased due to the climb in the Government Domestic Debt Instruments (Gogebakan, 2008: 10). After 2001, the Treasury’s use of short-term advances in order to eliminate the state revenue-expense imbalances from the CBRT and the CBRT’s buying of debt instruments which were issued by the Treasury or public institutions are forbidden by law, so the DA began to decline (CBRT, 2009). Thus, the DA/ Assets ratio climbed 43% in 2001, it decreased to 31% in 2002. After 2002, the DA/Assets ratio began to decrease due to the redemption of the Government Domestic Debt Instruments and the CBRT’s purchase of foreign exchange from the market. When looking at the year of 2008, the DA began to decline, because of downturn in the Government Domestic Debt Instruments and loss balance in the Foreign Exchange Revaluation Account. At the end of the year, the DA fell below zero at 1.5 billion TL in 2008 and was recorded at minus 5.4 billion TL in 2009.
Liabilities
The liabilities show the CBRT’s effectiveness on the market. Foreign exchange and TL are two types of funding source of the CBRT. The first one is the total foreign liabilities and the second one is the CBM. Increase in the Total Foreign Liabilities of the CBRT may reduce its strength to direct monetary policy (CBRT, 2009).
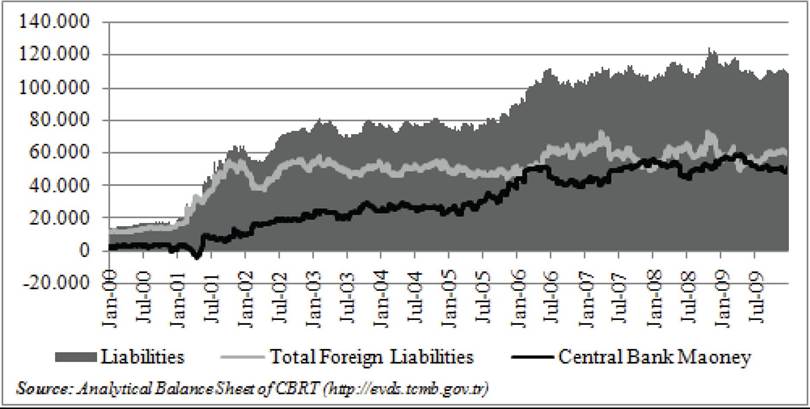
Total Foreign Liabilities skyrocketed in 2001 (Figure 2) due to the devaluation and so its monetary policy power has decreased significantly. In other words, in 2000s, Total Foreign Liabilities/ Liabilities ratio moved around 80%, but in 2001 crisis it raised to 120%. The share of TL liabilities (CBM) in total liabilities is preferred to be high for low risk.
Total Foreign Liabilities/Liabilities ratio began to fall after the crises of2000 and2001. It decreased to around 50% in 2008. On the other hand, the share of the CBM in the balance sheet grew after 2000s because the CBRT supplied liquidity via OMOs and it reached almost 50% in 2008.
Figure 2. Liabilities of the CBRT during 2000-2009 period (million TL)
Monetary Aggregates
CI, RM, MB and CBM are the monetary aggregates in Analytical Balance Sheet (Yakupoglu, 2011a: 25).
Currency Issued (CI)
CI is used for demonstration of the difference between banknotes which are put into circulation and withdrawn from circulation. The CBRT cannot finance the public sector due to its law, so it can be said that the CI is determined by economic units’ cash demand (Eroglu, 2008: 120). A Central Bank, who has achieved price stability, is expected to constitute its liabilities on the basis of its currency type. When the majority of these liabilities in a central bank’s balance sheet is CI, it is perceived as a positive sign. In short, in the developed countries whose financial structure is strong and inflation is not high, the share of the CBM in total liabilities and also the share of CI which is a sub-item of CBM in total liabilities is generally high.
Central Banks attach importance to the CI item for finance of its balance sheet. Financing of a balance sheet predominantly by the CI is a desired situation because it is directly under the control of the CBRT which reflects its effectiveness of its monetary policy on the economy (Colak, 1996: 19).
The Central Bank regulates the volume of CI in several ways. The CBRT is effective on the money demand and the CI by selling and purchasing of foreign exchange through OMOs, the auctions and direct interventions with the interest rates which are set by the CBRT. Changes in the volume of CI in an economy affect the general price level and total production in the short term depending on the speed of money circulation (CBRT, 2009). Studies show that the main determinants of the volume of CI are consumption expenditures, interest rates and inflation rates. When the movement of the volume of CI in Turkey in the last 20 years is examined, it was moving in a certain range until 2002, but after 2002 it has been skyrocketing. After 2002, consumption expenditures have been increasing in real terms and real interest rates have been declining (Altunoglu, 2009: 45).
The share of the CI in total liabilities rose until the year of2000 due to increasing foreign exchange reserves, but the ratio began to decline after the
crisis because of the currency substitution and high interest rates. In developing countries such as Turkey, the general condition of the economy causes the currency substitution. This reduces demand for domestic currency, while increases the foreign exchange demand (Erturk, 2004: 249). Accordingly, the ratio of the CI to total liabilities fell around 7-8% in 2001, while it began to ascend after the crisis due to the reverse currency substitution. It was at around 25% in 2006 and reached at the level of 35% in 2009.
Examining the developments in CI during the last two decades, the volume moved within a certain range up to 2002, but it increased very much in real terms after 2002. Moreover, up to 2000, the share of the CI in the balance sheet had increased, but it fell during the 2001 crisis due to the currency substitution and high interest rates. After 2002, this ratio has begun to rise and in 2009 reached to 40% (Figure 3). In this issue, the atmosphere of confidence and optimistic expectations was effective (Gogebakan, 2008: 13).
Reserve Money (RM)
A change in RM in the Analytical Balance Sheet is an important indicator of the CBRT’s monetary policy. An increase in RM is perceived as an expansionary monetary policy (Yardimci, 2006: 164). In that context, RM is significant monetary aggregate because an increase in RM raised other monetary aggregates more (Yakupoglu, 2011a: 25). Composition of RM is as follows:
Reserve Money = Currency Issued + Required Reserves + Free Deposits + Extrabudgetary Funds + Deposits of Non-Bank Sector
The ratio of the RM to the balance sheet descended to 13% at the end of 2001 due to shaking of the confidence in TL (Figure 4). Meanwhile the ratio began to rise again after 2002 due to the fact that the confidence in TL and TL instruments increased through the Program of Transition to a Strong Economy (CBRT 2006, 55). In the period of 2007-2009, it fluctuated within the range of 45-60% band because there was not confidence problem to TL.
Figure 3. Currency issued during 2000-2009 period
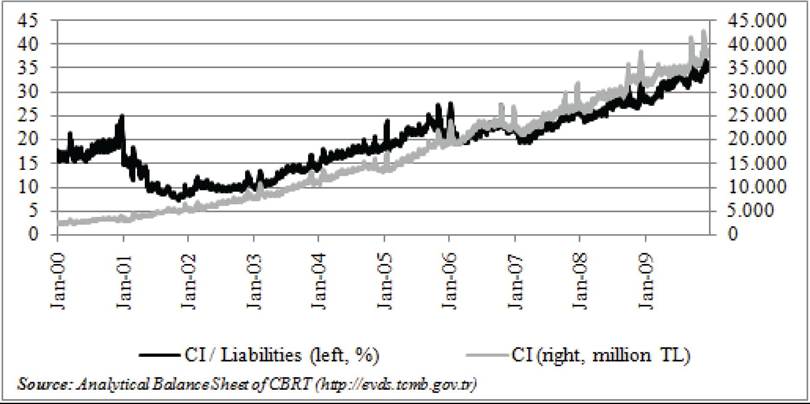
Figure 4. Reserve money during 2000-2009 period
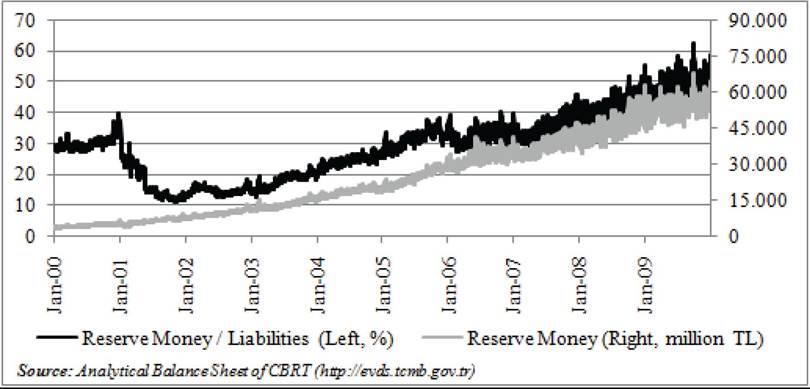
When FA is increasing; if RM remains at the same level, it means TL was taken from the market by using OMO, so OMO item will rise. The same conclusion can also occur if the Treasury raised its deposits on the Central Bank. If there is any of these two transactions, reserve money increases. This process is called sterilization (Yardimci, 2006: 165). In theory the process of sterilization is quite straightforward, but in practice it may be difficult for the monetary authority to fully offset the effects of a change in net foreign assets. In countries with less developed financial markets the ability of sterilization may be constrained by the size and depth of the domestic bond market (Obstfeld, 1982).
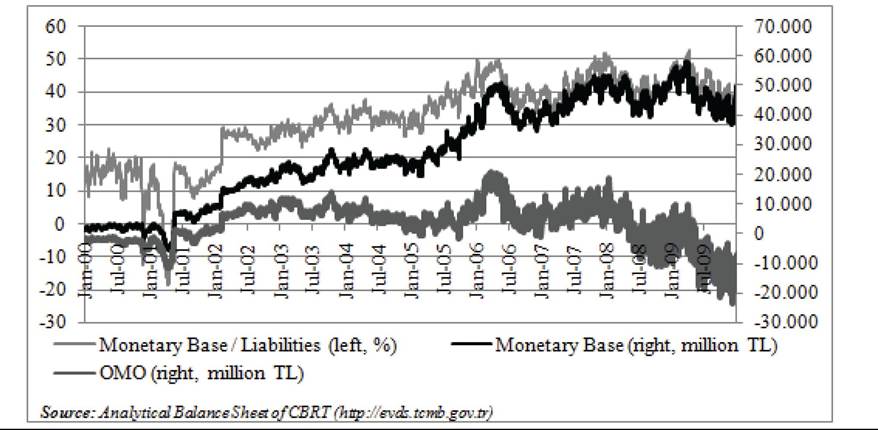
Monetary Base (MB)
Monetary Base is equal to the sum of RM and OMO which is used to control liquidity in the banking sector by the CBRT.
Monetary Base = Reserve Money + Open Market Operations
The CBRT has been controlling the liquidity of the banking system through OMOs since 1987. The CBRT uses direct purchase, direct sales, repurchase agreement and reverse repurchase agreement transactions as a vehicle in OMOs (Gunal, 2006: 366). If the CBRT supplies liquidity to the market, in other words if it is creditor, OMO changes in the negative way.
The MB moved between 0-5 billion TL in 2000s, but it had a negative value at the end of the first quarter of 2001 due to the February 2001 crisis (Figure 5). The most important reason for this, the CBRT provided liquidity to the market by OMOs. In that context, the OMOs item was negative 5-6 billion TL during the period of November-December of 2000 and it reached negative 11 billion TL in April of 2001 because, the CBRT gave liquidity to the market. Similar movements were observed in 2008 and 2009 years. OMO began to fall below zero in the first half of 2008 and then increased again above zero but fell to negative 23 billion TL in December of 2009. Meanwhile, an upward trend in MB stopped in 2006 and moved around at 40 billion TL during
2007- 2009 period.
Figure 5. Monetary base and open market operations during 2000-2009 period
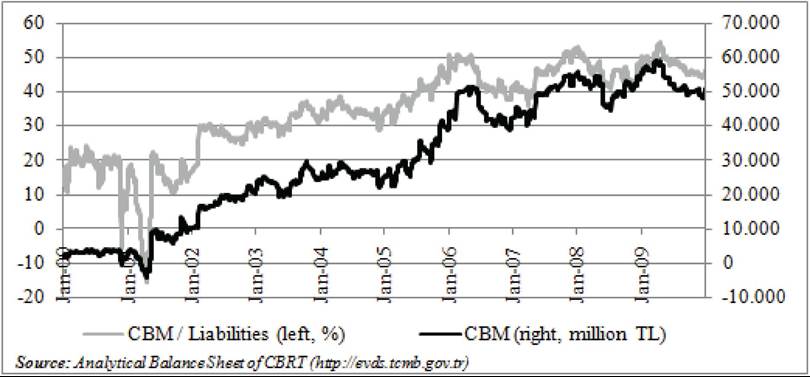
The Central Bank Money (CBM)
The CBM which is total TL liabilities of the Central Bank to all units of economy is the largest monetary aggregate created by the CBRT. The CBM is the sum of RM, OMO and TL Deposits of Public Sector (Yardimci, 2006: 164).
Central Bank Money = Monetary Base + TL Deposits of Public Sector = (Reserve Money + Open Market Operations) + TL Deposits of Public Sector
Central Banks choose and tracks a monetary aggregate in order to control the liquidity in the market. It must pay attention to two points in this selection:
1. There should be a stable relationship between the selected monetary aggregate and money supply and economic activity,
2. The selected item should be affected by all monetary instruments of the CBRT.
This selected item is often the monetary base in foreign countries. In Turkey, the Central Bank used RM until 1989 for these purposes, but after the year 1989 the CBRT has followed CBM (Keyder, 2000: 210).
There are two important points about CBM. Firstly, in foreign exchange transactions, the CBRT’s foreign exchange purchase and sale only affect the CBM. Secondly, all sub-items of the CBM have same effects on creating liquidity although they have different mechanisms. Consequently, so as to follow effects of monetary policy implementations over liquidity, the best monetary aggregate is CBM (Serdengecti, 1997: 19).
Analysis of the Analytical Balance Sheet via ratios is important in order to understand effectiveness of the CBRT’s operations over the monetary aggregates (Eroglu 2008, 110). Accordingly, in both crises, CI was the primary item that causes an increase of CBM. Especially in 2008 the share of CI in the CBM is much more than in 2001, that means this is the most important factor of increasing the ratio of the CBM to total liabilities.
CBM was just one billion TL in 2000, but it reached 10 billion TL in 2001 because of an upswing of the Other Central Bank Money in 2001 (Figure 6). Moreover, the reason for this rise is that the OMO was negative in between 2000 and May of 2001 due to the fact that the CBRT supplied liquidity to the market after crises, while the OMO item was positive after June of 2001. The CBM fluctuated within the range 20-30 billion TL during 2002-2005 period, began to rise especially after 2005 and ascended above to 50 billion TL in May 2006 due to the CBRT’s interventions. At the end of this year it fell to 40 billion TL but after that it began to increase again.
During the global crisis in 2008, the CBM remained at the same level of 55 billion TL according to previous year, because an increase in the free deposits of banking sector compensated the negative OMOs. In addition, the CBM was 50 billion TL in 2009.
The ratio of the CBM to the liabilities demonstrates whether the CBRT’s monetary policy is tight or expansionary (Eroglu, 2008, 110). At the beginning of 2000 while the CBM was 2 billion TL, this ratio was 15%; but at the end of 2001 while it was 10 billion TL, this ratio was 16%. This means, CBRT’s power of ability to intervene to the market was low in this crisis period. The CBM reached almost half of total liabilities in 2008 and in 2009, as mentioned above, because especially a regular increase in the CI volume in this period compensated the negative OMOs. Consequently, the Central Bank had more power to intervene to the market in global crisis in 2008 according to the crisis in February of 2001.
CONCLUSION
Nowadays, the primary task of Central Banks is generally to provide and maintain price stability. For this purpose, Central Banks set monetary policies, so they can make changes over the macroeconomic balances. Accordingly, Central Banks use monetary policy tools to control the level of liquidity in the economy. In other words, the Central Bank is the main determinant of the money supply. In that context, the Analytical Balance Sheet of the CBRT is very important especially because it is a main indicator of what kind of a monetary policy that the CBRT follows.
The Central Bank has power to create money in the economy that affects the other economic units in close relationship, so its balance sheet is very important so as to monitor its effectiveness. Therefore, the changes occurring in the Central Bank’s balance sheet are crucial indicators of its monetary policy. Accordingly, the Analytical Balance Sheet was created upon summing up and offsetting balance sheet of the CBRT to represent specific monetary aggregates in order to make the balance sheet more understandable and simple. The assets side of the Analytical Balance Sheet exhibits how to provide liquidity of economy, while the liabilities show the form of finance of liquidity need in the economy.
Figure 6. The central bank money during 2000-2009 period
Turkey had three economic crises during 2000-2009 period. The first crisis was the banking crisis in November of 2000, the second one was the February 2001 crisis, which was currency crisis and last one was the global economic crisis in 2008. The changes in the CBRT’s Analytical Balance Sheet in terms of these three crises are as follows:
The size of the Analytical Balance Sheet grew 255% year on year at the end of 2001 because of both an increase in the FA due to the devaluation on February of 2001 and also a rise in the DA. In 2008, its size expanded only 6.4%, year on year, but in 2009, it contracted 3%, year on year. This is because, in spite of the fact that FA climbed in the second half of 2008 due to the depreciation of TL, DA was negative due to decrease of Government Domestic Debt Instruments (prior to November 5, 2001).
The ratio of the FA to total assets of the CBRT entered declining trend after 2000 because of the crisis of 2001, but later on, it began to rise. That is to say that, increasing of the FA/assets means the country’s source which is convertible into money regarding the other central banks and international markets is ascending. In addition, the currency risk rate which expresses a similar situation was in a downward trend in the crisis years of 2001 and 2008.
Total Foreign Liabilities escalated in 2001 due to the devaluation, so its monetary policy power has weakened significantly. After 2002, foreign exchange supply increased due to rise in international liquidity and risk appetite. In such an environment, the Central Bank benefited from the abundance of foreign currency in the market by raising its foreign exchange reserves and reducing its foreign liabilities.
In the crises, changes in monetary aggregates which are derived from liabilities of the Central Bank in the Analytical Balance Sheet as follows:
The first monetary aggregate was CI (emission) which is used for the difference between banknotes that are put into circulation and withdrawn from circulation. The share of the CI to total liabilities declined to 7% just after 2001 crises due to the currency substitution and high interest rates, but then it entered in an upward trend until 2009 up to 35%. In this case, the atmosphere of confidence and optimistic expectations that arise from the reverse currency substitution was effective.
The second item was RM which is the sum of CI, Required Reserves, Free Deposits, Extrabudgetary Funds and Deposits of Non-Bank Sector. Because of the fact that the confidence in TL declined due to 2000 and 2001 crises, the share of the RM in balance sheet decreased to 13%. In global crises this ratio moved in the range of 40%-50%.
The third monetary aggregate is the Monetary Base is equal to the sum of RM and OMO which is used to control liquidity in the banking sector by the CBRT. The MB moved between 0-5 billion TL in 2000s, but it had a negative value at the end of the first quarter of 2001 because the CBRT provided liquidity to the market by OMOs in February 2001 crisis. The CBRT uses direct purchase, direct sales, repurchase agreement repurchase agreement and reverse repurchase agreement transactions as a vehicle in OMO. It was at the value of negative 5,2 billion TL at the end of 2000 and negative 11 billion TL on the February 2001 crisis because the CBRT provided liquidity to the market through the OMOs. Similar situation was also observed in the global crisis in 2008. Similar movements were observed in 2008 and 2009 years.
The last monetary aggregate is the CBM which is total TL liabilities of the Central B ank to all units of economy. The CBM is the sum of the monetary base and TL Deposits of Public Sector. In the beginning of 2000 while the CBM was 2 billion TL, the ratio of the CBM to the assets was 15%; but at the end of 2001 while it was 10 billion TL, this ratio was 16%. That means, CBRT’s power of ability to intervene to the market was very weak in that period. In addition, the ratio declined also in 2008 but not as much as the other two crises, but then it began to increase again in 2009.
As a result, the Central Bank’s most important goal is to maintain price stability and control the creation of money in the economy. In this respect, it uses various monetary policy tools. The Analytical Balance Sheet of the CBRT and the monetary aggregates which are derived from the liabilities of the CBRT are the most important indicators in order to observe whether these tools are effective or not in terms of its monetary policy of the CB RT.
REFERENCES
Acar, O. (1999). Sermaye hareketlerinin ser- bestlesmesi ve merkez bankasi bilancolari, Active Dergisi, 10, 84-90. Retrieved from http://www. makalem.com/Browse/Result.asp?nNUMBER =10&sResultType=BrowseSource&nSourceN o=4&nSOURCE_id=33&sSourceText=Active Dergisi&sSourceNumber=33
Akcay, M. A. (1997). Parapolitikasi araclari Tur- kiye ve cesitli ulkelerdeki uygulamalar. Uzmanlik Tezi, DPT (Yayin No: DPT.2483).
Akguc, O. (1993). Merkez bankasi ve finans sek- toru: Merkez bankasi bilancolarinin irdelenmesi. Istanbul: Mulkiyeliler Vakfi.
Akyuz, Y., & Boratav, K. (n.d.). The making of the Turkish financial crisis. Retrieved February 25, 2012, from http://www.peri.umass.edu/fileadmin/ pdf/financial/fin_akyuz.pdf
Alic, A. B., Akboga, B., Aslan, A., & Kayabasi,
G. (2009). Kuresel krizin kobilerin ihracatlarina etkileri ve kobilerde kriz yonetimi: Eskisehir ili kobiler uzerine bir arastirma. Paper presented at the 7th Annual Meeting of the International Students of the Economics Congress. Izmir, Turkey.
Altunoglu, Y. (2009). Emisyon hacmi: Temel be- lirleyiciler ve tahmin modeli. Uzmanlik Yeterlilik Tezi. CBRT, Emisyon Genel Mudurlugu.
Ardic, H. (2004). 1994 ve 2001 ekonomik kri- zlerinin, turkiye cumhuriyet merkez bankasi bilancosunda yarattigi hareketlerin incelenmesi. Uzmanlik Yeterlilik Tezi. CBRT, Muhasebe Genel Mudurlugu.
CBRT. (2001). 2001 yillik rapor. Retrieved September 01, 2011, from http://www.tcmb.gov.tr/ research/yillik/01turkce/bolum_III2001.pdf
CBRT. (2002). 2002 yillik rapor. Retrieved September 01, 2011, from http://www.tcmb.gov.tr/ research/yillik/02turkce/yraporxyeni.html
CBRT. (2003). 2003 yillik rapor. Retrieved September 01, 2011, from http://www.tcmb.gov.tr/ research/yillik/03turkce/yraporxyeni.html
CBRT. (2005). Turkiye cumhuriyet merkez bankasi’nda doviz rezervi yonetimi. Retrieved August 10, 2011, from http://www.tcmb.gov.tr/ yeni/duyuru/2005/rezyon0805.pdf
CBRT. (2006). Turkiye cumhuriyet merkez bankasi bilancosu, aciklamalar, rasyolar ve para politikasi yansimalari. Retrieved September 10, 2011, from http://www.tcmb.gov.tr/yeni/evds/yayin/kitaplar/ tcmb.bilancokitabi.pdf
CBRT. (2009). Baskan yilmaz’in bakanlar kurulu ile TBMM plan ve butce komisyonu sunumlari. TCMB Bulten, (14). Retrieved from http://www. tcmb.gov.tr/yeni/iletisimgm/Bulten_Turkce14. pdf
Colak, O. F. (1996). Finansal piyasalar ve para piyasasi. Ankara: Alkim Yayinevi.
Coskun, Y. S., & Balatan, Z. (2009). Kuresel mali krizin bankacilik sektorune etkileri ve turk bankacilik sektorunun veri zarflama analizi ile bilancoya dayali mali etkinlik analizi. Paper presented at the 12th Annual Meeting of the International Students of the Economics Congress. Izmir, Turkey.
Egilmez, M. (2006). Kasim 2000 krizi uzerine. Retrieved September 15, 2011, from http:// ekonomi.blogcu.com/kasim-2000-krizi-uzerine- mahfi-egilmez/130899
Eroglu, N. (2008). Turkiye’de parasal kesim ve merkez bankasi islemlerinin analizi. Istanbul: Der Yayinlari (Yayin No: 378).
Erturk, E. (2004). Makroekonomik analize giris (2nd ed.). Aktuel Yayinlari.
Fazio, A. (1991). Role and independence of central banks. In P. Downes, & R. V. Adeh (Eds.), The Evolving Role of Central Banks. Washington, DC: IMF Publish.
Foster, J. B. (2008). Kapitalizmin malilesmesi ve kriz. (Cidamli, Trans.). Istanbul: Kalkedon Yayinlari.
Gaygili, A. K. (2007). Finansal acikligin para politikalarinin etkinligi uzerine yansimalari: Turkiye ornegi. (Unpublished master’s thesis). Marmara University, Istanbul, Turkey.
Gogebakan Onder, N. A. (2008). Turkiye cumhuriyet merkez bankasi temel bilanco buyuklukler ve enflasyonun aciklanmasindakigoreli onemi, 1990 - 2007. Uzmanlik Yeterlilik Tezi. CBRT, Muhasebe Genel Mudurlugu.
Gunal, M. (2006). Para, banka ve finansalsistem. Ankara: Yeni Donem Yayinlari.
Hawkins, J. (2003). Central bank balance sheets and fiscal operations. Fiscal Issues and Central Banking in Emerging Economies, Monetary and Economic Department, Bank for International Settlements Papers, No:20, 71-83.
Iskenderoglu, L. (1993). Parapolitikasi acisindan TCMB bilancosu. Merkez Bankasi Bilancolarinin Irdelenmesi. Istanbul: Istanbul Mulkiyeliler Vakfi.
Karacor, Z. (n.d.). Ogrenen ekonomi Turkiye: Kasim 2000-subat 2001 krizinin ogrettikleri. Retrieved June 18, 2011, from http://www.sosyalbil. selcuk.edu.tr/sos_mak/makaleler/Zeynep%20 KARA%C3%87OR/KARA%C3%87OR,%20 ZEYNEP.pdf
Keyder, N. (2000). Para - Teori, politika, uygu- lama. Istanbul: Beta Dagitim.
Mankiw, N. G. (2010). Makroekonomi. Ankara: Efil Yayinevi.
Parasiz, ˛. (2000). Para, banka ve finansalpiyasa- lar. Bursa: Ezgi Kitabevi.
Serdengecti, S. (1997). TCMB vaziyeti ve anlami. Retrieved June 12, 2011, from www.tcmb.gov. tr/yeni/evds/yayin/kitaplar/ss/SSerdengecti.pdf
Universitesi, I., & Enstitusu, S. B. (2003). TCMB analitik bilancosu. Retrieved August 10, from http://www.istanbul.edu.tr/yuksekokullar/so- syalbilimler/iuWebson/fethiacil/tcmbbilanco.pdf
Yakupoglu, A. (2011a). 2002-2009 yillari ar- asinda merkez bankasi parasi ve alt kalemlerinin analizi. Maliye Finans Yazilari, 25(90), 23-40. Retrieved from http://www.finanskulup.org.tr/as- sets/maliyefinans/90/MFY-90_alper_yakupoglu_ merkez_bankasi_parasi.pdf
Yakupoglu, A. (2011b). Dalgali kur rejiminin merkez bankasi’nin doviz varlik ve yukumluluk- lerine etkisi: 2002-2010. Maliye Finans Yazilari, 25(91), 21-45.
Yardimci, P. (2006). Merkez bankasi bilanco kalemlerinin para politikalarini yonlendirmedeki rolu. Selcuk Universitesi Karaman t.t.B.F. Dergisi, 9(11), 156-170. Retrieved from http://iibfdergi. kmu.edu.tr/userfiles/file/aralik2006/12.pdf
Yukseler, Z. (2009). Turkiye ’de kriz donemlerinde ekonomik gelismeler ve odemeler dengesi uyumu. Retrieved August 15, 2011, from http://www. tcmb.gov.tr/yeni/iletisimgm/Krizler_Yukseler.pdf
ADDITIONAL READING
Agenor, P. R., McDermott, C. J., & Ucer, E. M. (1997). Fiscal imbalances, capital inflows, and the real exchange rate: The case of Turkey. IMF Working Paper. WP/97/1, 1-20.
Bakir, C. (2007). Merkezdeki banka turkiye cumhuriyet merkez bankasi ve uluslararasi bir karsilastirma. Istanbul: Istanbul Bilgi Universitesi Yayinlari.
Berument, H., & Tasci, H. (2004). Monetary policy rules in practice evidence from Turkey. International Journal of Finance & Economics, 9, 33-38. doi:10.1002/ijfe.219
Cespedes, L., Chang, R., & Velasco, A. (2000). Balance sheets and exchange rate policy. Working Paper, 7840. Retrieved January 01, 2012, from http://cid.bcrp.gob.pe/biblio/Papers/Documentos/ Zen%F3n%20Quispe/C%E9spedes_Balance%20 sheets.pdf
Demirhan, E. (2000).Turkiye'de merkez bankasi parasi ’ ni belirleyen unsurlarin analizi: 1990-1997. Iktisadi ve Idari Bilimler Dergisi, 14(1), 51-62. Retrieved January 19, 2012, from http://e-dergi.atau- ni.edu.tr/index.php/IIBD/article/view/3485/3314
Emil, A., & Ata. (1998). Para politikalari uygu- lamalari acisindan merkez bankasi bilancosu. Hazine Dergisi, 9, 47-61.
Gunal, M. (2001). Merkez bankasi’nin degiξen rolu ve para politikasi uygulamalari. Istanbul Menkul Kiymetler Borsasi.
Kar, M., & Kara, M.A. (2003). Turkiye’ye yonelik sermaye hareketleri ve krizler. DTM Dergisi, 29. Kara, A. (2012). Kuresel finansal krizde merkez bankalarinin bilanςo yonetimi kapsaminda turkiye ornegi ve alternatif yontemler. Uzmanlik Yeter- lilik Tezi, TCMB Muhasebe Genel Mudurlugu. Retrieved August 01,2011, from http://www.tcmb. gov.tr/kutuphane/TURKCE/tezler/alperkara.pdf
Kasapoglu, O. (2007). Parasal aktarim mekaniz- malari: Turkiye icin uygulama. Uzmanlik Yeter- lilik Tezi, TCMB Piyasalar Genel Mudurlugu. Retrieved December 10, 2011, from http://www. tcmb.gov.tr/kutuphane/TURKCE/tezler/ozgur- kasapoglu.pdf
Krugman, P. (1999). Balance sheets, the transfer problem, and financial crises. Retrieved from http://Web.mit.edu/krugman/www/FLOOD.pdf
Olgun, H. (2001). Kasim subat krizleri ve turkiye’nin guclu ekonomiye gecis programi.
Turkiye Dergisi, 7(41), 626-632.
Onder, T. (2005). Para politikasi araςlari, ama- ςlari ve turkiye uygulamasi. Merkez Bankasi Uz- manlik Tezi. Retrieved December 12, 2011, from http://www.tcmb.gov.tr/kutuphane/TURKCE/ tezler/timuronder.pdf
Ozatay, F. (2009). Turkiye’de 2000-2008 done- minde para politikasi. Iktisat ve Isletme ve Finans Dergisi, 24(275), 37-65.
Ozel, S. (2000). Merkez bankasi para politikasi ve bilancusunun pragmatik analizi. Active Der- gisi, 7-18.
Ozturk, S., & Govdere, B. (2010). Kuresel finansal kriz ve turkiye ekonomisine etkileri. Suleyman Demirel Universitesi Iktisadi ve Idari Bilimler Fakultesi Dergisi, 15(1), 377-397.
Pacaci, C. (2001). Krizler ve turk bankacilik sektoru. Yeni Turkiye Dergisi, 7(41), 635-639.
Parasiz, ˛. (2004). Turkiye ekonomisi. Ezgi Kita- bevi Yayinlari.
Parasiz, ˛. (2004). Para teorisi ve politikasi. Ezgi Kitabevi Yayinlari.
Togay, S. (2001). Kasim 2000 krizine teorik yakla§im: Para arzinin icselligi ve minsky’nin finansal istikrarsizlik hipotezi. Iktisat Isletme ve Finans Dergisi, 31-51.
Uygur, E. (2010). Global crises and the Turkish economy. Retrieved November 30, 2011, from http://www.finance.thirdworldnetwork.net/ file_dir/6158100194dca5b2b6bb0f.pdf
Yilmaz, D. (2008). Global challenges and local response-monetary policy in Turkey. BIS Review, 82. Retrieved October 15,2011, from http://www. bis.org/review/r080627c.pdf
KEY TERMS AND DEFINITIONS
Analytical Balance Sheet: It is created upon summing up and offsetting Balance Sheet of the Central Bank of Republic of Turkey (CBRT) in order to represent specific monetary aggregates.
Asset: The assets of the Analytical Balance Sheet of the CBRT exhibit how to provide liquidity of economy.
Central Bank: The entity responsible for overseeing the monetary system for a nation. Central banks have a wide range of responsibilities, from overseeing monetary policy to implementing specific goals such as currency stability, low inflation, and full employment.
Central Bank Money: It is total TL liabilities of the Central Bank to all units of economy and indicates the sum of the monetary base and TL Deposits of Public Sector.
Currency Issued: CI (emission) is used for the difference between banknotes that are put into circulation and withdrawn from circulation.
Economic Crises: A situation in which the economy of a country experiences a sudden downturn brought on by a financial crisis. An economy facing an economic crisis will most likely experience a falling GDP, a drying up of liquidity and rising/falling prices due to inflation/deflation.
Liability: The liabilities of the Analytical Balance Sheet of the CBRT show the form of finance of liquidity, which is needed in the economy.
Monetary Base: It is equal to the sum of RM and OMO which is used to control liquidity in the banking sector by the CBRT.
Reserve Money: It is the sum of CI, Required Reserves, Free Deposits, Extrabudgetary Funds and Deposits of Non-Bank Sector.
This work was previously published in Technology and Financial Crisis, edited by Ali Serhan Koyuncugil andNermin Ozgulbas, pages 110-127, copyright 2013 by Business Science Reference (an imprint of IGI Global).