Chapter 81 Data Mining using Advanced Ant Colony Optimization Algorithm and Application to Bankruptcy Prediction
Vishal Arora
Indian Institute of Technology Delhi, India
Vadlamani Ravi
Institute for Development and Research in Banking Technology, India
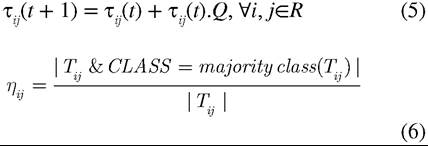
ABSTRACT
Ant Colony Optimization (ACO) is gaining popularity as data mining technique in the domain of Swarm Intelligence for its simple, accurate and comprehensive nature of classification.
In this paper the authors propose a novel advanced version of the original ant colony based miner (Ant-Miner) in order to extract classification rules from data. They call this Advanced ACO-Miner (ADACOM). The main goal of ADACOM is to explore the flexibility of using a different knowledge extraction heuristic approach viz. Gini’s Index to increase the predictive accuracy and the simplicity of the rules extracted. Further, the authors increase the information and the prediction level of the set of rules extracted by dynamically changing specific parameters. Simulations are performed with ADACOM on a few benchmark datasets Wine, WBC (Wisconsin Breast Cancer) and Iris from UCI (University of California at Irvine) data repository and compared with Ant-Miner (Parpinelli, Lopes, & Freitas, 2002), Ant-Miner2 (Liu, Abbass, & McKay, 2002), Ant-Miner3 (Liu, Abbass, & McKay, 2003), Ant-Miner+ (Martens, De Backer, Haesen, Vanthienen, Snoeck, & Baesens, 2007) and C4.5 (Quinlan, 1993). The results show that ADACOM outperforms the above mentioned algorithms in terms of predictive accuracy, simplicity of rules, sensitivity, specificity and AUC values (area under ROC curve). In addition, the ADACOM is also employed to extract rules from bank datasets (UK, US, Spanish and Turkish) for bankruptcy prediction and the results are compared with that obtained by Ant-Miner. Again ADACOM yielded better results and is proven to be the better choice for solving bankruptcy prediction problems in banksDOI: 10.4018∕978-1-4666-6268-1.ch081
.
INTRODUCTION
The exponential advancement in digital and hardware technology over the last few decades has led to tremendous increase in the amount of data received and stored in various data warehouses and data repositories around the world.
The data collection and handling is not of much concern but the useful and relevant information retrieval from the so called raw data is one area that has clearly seen loads of efforts coming into it recently.Data Mining (DM) is one commonly used name to address the efforts put in to derive a set of high level knowledge, from data, which is said to be both comprehensible and accurate (Fayyad, Piatetsky-Shapiro, & Smyth, 1996). In other words we can say that DM is the process of automatically seeking, constructing, analyzing and validating the structural patterns in data and in turn using them, for prediction, on unseen data (Witten, Frank, 1999; Lu, Setiono, & Liu, 1995)
Decision trees (Quinlan, 1986), neural networks (Odom & Sharda, 1990) and genetic algorithms (Goldberg, 1989) are some of the data mining techniques employed to extract classification rules. Currently many classification algorithms are used to extract some kind of relevant pattern amongst the data in the form of a model which can be used in prediction phase for the classification of unseen data. These include decision tree (Quinlan, 1986), neural networks (Odom & Sharda, 1990), support vector machine (Vapnik, 1995). It is an undeniable fact that neural networks, support vector machine and statistical algorithms are strong when it comes to predictive accuracy but fall short in terms of simplicity and comprehensibility. It is nearly impossible to extract useful high level knowledge, from the model developed, which can be easily understood and comprehended by the user. Thus they are called ‘Black Box’. This black box nature is overcome by the new algorithms which generate a set of easily interpreted rules as the model itself.
Recently efforts have been put into research, with success, related to nature-based approaches for finding the solution to classification problems. These include Genetic Algorithms (GA) (Mah- foud & Mani, 1996), Ant Colony Optimization (ACO) (Dorigo & Maniezzo, 1996., Dorigo & Stutzle, 2004) and Particle Swarm Optimization (PSO) (Sousa, Silva, & Neves, 2003) etc.
which fall under Swarm intelligence (SI).Since we developed a new variant of ACO- Miner we discuss more on ACO in the following. The basic ACO technique consists of a population of ants (artificial) which searches in the solution space of the given problem, guided by the pheromone trails and a heuristic approach. The pheromone update and evaporation take place depending upon the past exposure and experience of the ants (candidate solutions). This eventually increases the probability of finding the optimum solution to the problem in the next iteration (Dorigo & Gambardella, 1997).. Its significance and efficiency in various fields has been successfully demonstrated by successful applications to hard combinatorial optimization problems (Dorigo & Stutzle, 2004). In this paper we developed an advanced ant colony optimization algorithm (ADACOM) which makes use of a different but efficient heuristic approach. The new algorithm makes use of Gini’s Index, instead of Entropy, as the measure of information level in a particular term. In addition to this the ADACOM tries to capture the overlooked information resulting from the parameter constraints. This is accomplished by dynamically varying the parameters so as to retrieve more knowledge from the data by compensating the simplicity of the rules extracted but significantly improving upon the predictive accuracy., Ripper, C4.5 (Quinlan, 1993), INN, logit (Ohlson, 1980) and SVM (Quinlan, 1986) are compared with ADACOM for the benchmark datasets.
BACKGROUND
The use of meta-heuristics to solve classification problems has emerged as a new line of research since the seminal work of Mahfoud and Mani (1996), where they employed GA to extract rules from data for stock prediction application. Later, Kim and Han (2003) and Shin and Lee (2002) also employed GA in different ways to extract rules in order to predict bankruptcy in banks. Then, particle swarm optimization miner (Sousa, Silva, & Neves, 2003) appeared in literature.
Bacterial foraging technique (Kim, Abraham, & Cho, 2007) is not yet used for classification purpose. As regards the use of Ant Colony Optimization for rule extraction, Parpinelli, Lopes, & Freitas (2002) were the first to develop Ant-Miner to extract rules. Then improved versions of ant-Miner namely, Ant-Miner2 (Liu, Abbass, & McKay, 2002). Ant-Miner3 (Liu, Ab- bass, & McKay, 2003), Ant-Miner+ (Martens, De Backer, Haesen, Vanthienen, Snoeck, & Baesens, 2007) were developed.Overview of Ant-Miner and Its Variants
Ant Miner (Parpinelli, Lopes, & Freitas, 2002) is considered as the first application of ACO for the classification task. This was used to extract ‘If-Then’ classifications rules from the given dataset. The extracted list of rules is an ordered rule list meaning that each rule is dependent on the previous set of rules and that the rules are to be interpreted in a sequential order for prediction. A brief description of ant miner algorithm (Parpinelli, Lopes, & Freitas, 2002) is given in Algorithm 1. The notation followed is the same as the one by Parpinelli et al. (Parpinelli, Lopes, & Freitas, 2002).
The Ant Miner works only for data which has categorical attributes. Therefore the data containing numeric attributes needs to be discretized as a preprocessing step. The discretization was performed on the raw data (without normalization) for all the experiments. Number of Buckets used for discretization is a user defined parameter and is fixed for the entire execution of the algorithm. It is a discretization parameter and refers to the number of categories for an attribute.
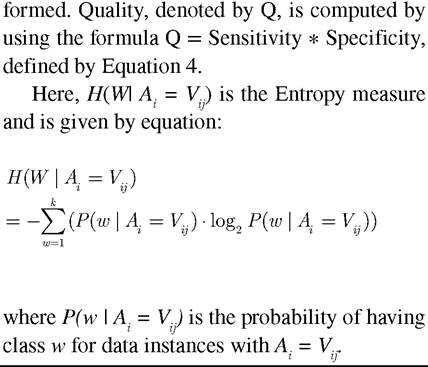
Each iteration of REPEAT-UNTIL loop of Algorithm 1 consists of rule construction, rule pruning and pheromone updating. Each ant starts with exploring the search space to find the best term to add to the rule. The rule is empty initially but with time the ant keeps on adding terms to it. Quality is the measure to differentiate amongst a pool of candidate solutions and select the best out of it.
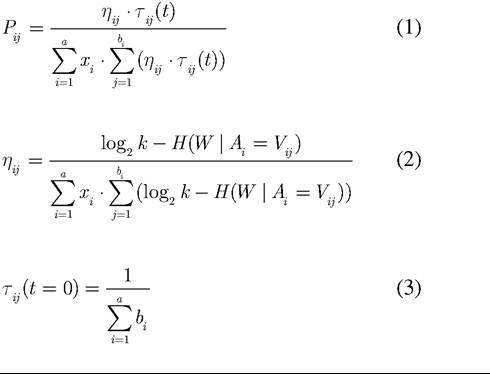
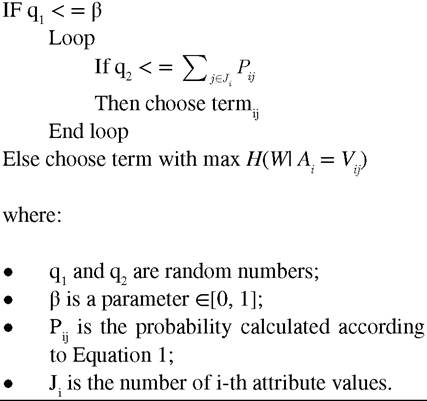
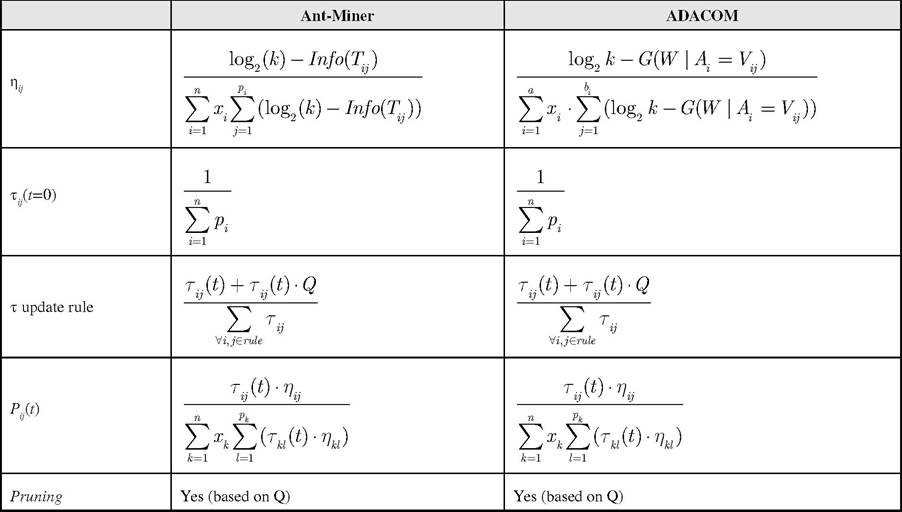
A term is of the form A = V, where A is the ith attribute and Vij is the jth value in the domain of the ith attribute. And the next term to be chosen and added to the current rule is dependent on the probability value (Pj) derived from the pheromone value (τj) and the heuristic value (ηj) of each term and normalized over all possible terms. Pjj(t) is defined by Equation 1 with a the total number of attributes, b i the number of values in the domain of the ith attribute, xi equal to one if the attribute Ai is not yet used by the current ant or zero, otherwise.The heuristic function used to calculate the information associated with each term is defined in terms of Entropy and is given by Equation 2 where, k is the number of classes.
Initially the pheromone corresponding to each term is defined by Equation 3:
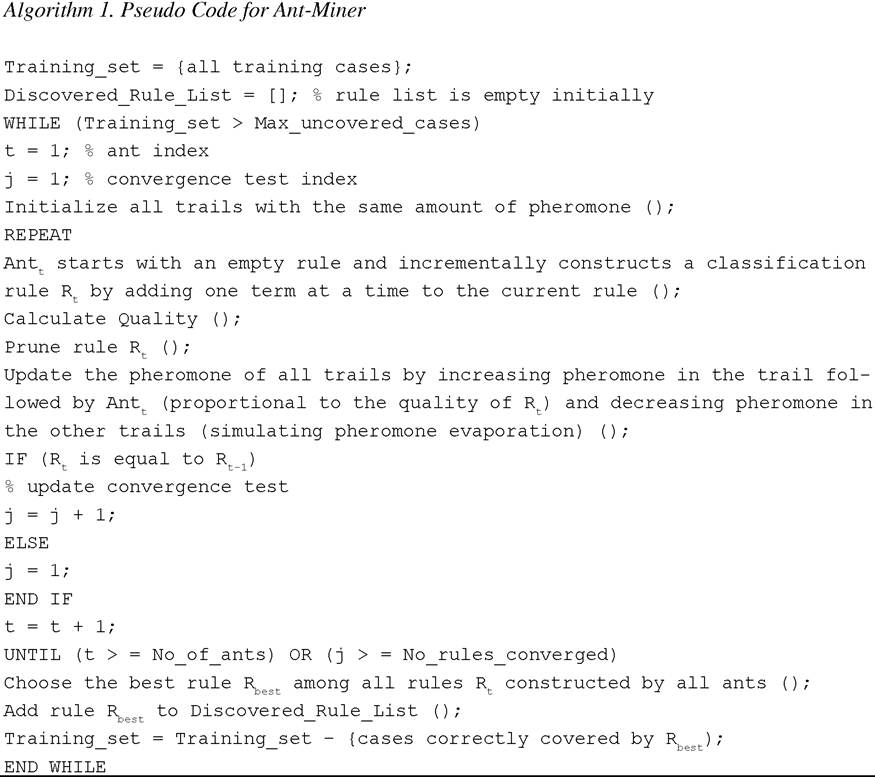
The ant at time t, denoted by, Antt keeps on adding the term to the current rule until the number of cases covered by the current rule is smaller than a user specified threshold i.e. Min_cases _per_rule or all attributes are used by the ant. In addition to this there is a restriction that only those attributes can be added to the current rule which have not already been used for the same rule to avoid inconsistencies. Next the rule formed by Antt is pruned in order to remove the irrelevant terms which may have been selected as a result of ignoring attribute interactions. Pruning is done by iteratively removing one term at a time from the rule while it improves the quality of the rule thus
After the rule is pruned resulting in simplicity of the rule without compromising on the quality, the pheromone updation is carried out.
For all the terms that belong to the current rule, the pheromone value is increased (pheromone deposition) using Equation 5 given below while the pheromone content of rest of the terms is decreased (pheromone evaporation) by normalizing it over all possible terms.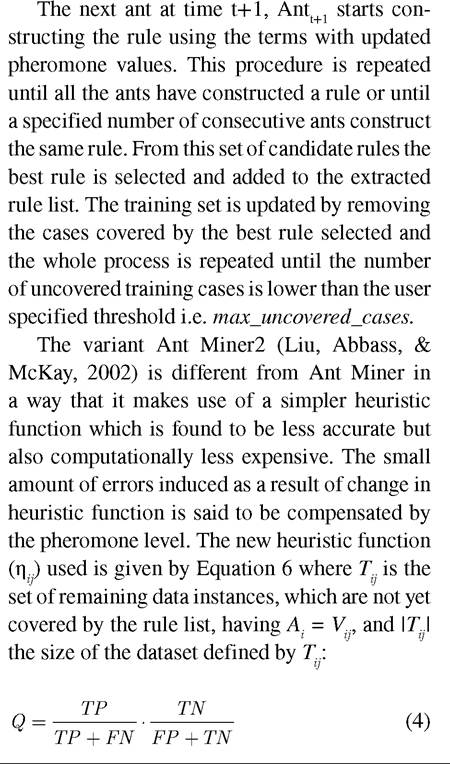
where:
TP (True Positives): The number of cases covered by the rule that have class predicted by the rule;
FN (False Negatives): The number of cases that are not covered by the rule but that have the class predicted by the rule;
TN (True Negatives): The number of cases that are not covered by the rule and that do not have the class predicted by the rule; FP (False Positives): The number of cases covered by the rule that have a class different from the class predicted by the rule:
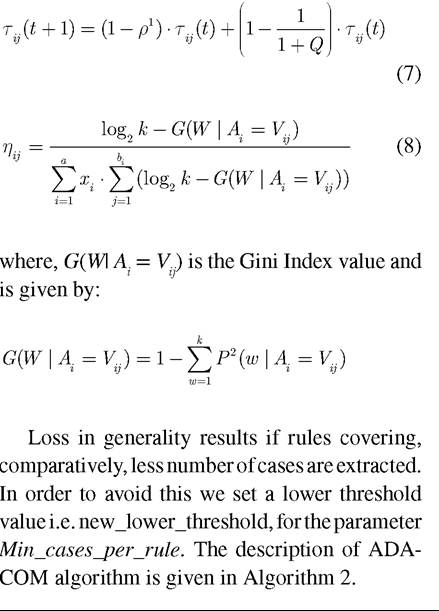
The increased accuracy of Ant Miner3 (Liu, Abbass, & McKay, 2003) has been attributed to two major changes to Ant Miner2 viz. a different update rule and use of a transition rule that increases the probability of choosing those terms which have not yet been used in previously constructed rules. The pheromone function used in Ant Miner3 is defined by Equation 7 with ρ the evaporation factor, while the transition rule is given:
Transition Rule
The comparison of the heuristic and probability value functions used in Ant Miner and ADACOM are presented in Table 1 along with the pheromone update rule used.
MAIN FOCUS
Proposed Algorithm: Advanced
Aco Miner (ADACOM)
When compared to the previous versions of Ant Miner the novelties proposed in ADACOM are as follows:
• Use of a different information retrieval approach or heuristic function. The algorithm makes use of Gini’s Index instead of Entropy measure for calculating the heuristic value corresponding to each term and;
• Dynamically decrementing the minimum number of cases per rule to improve the predictive accuracy.
Different data mining techniques use different heuristics. A heuristic may be best suited for one while the same may not be acceptable for a different technique. With regard to the heuristic function used to calculate the information level of a term in Ant Miner Algorithm we can say that different heuristic functions perform differently in terms of accuracy. Ant Miner used Entropy based heuristic function while ADACOM uses Gini’s Index as the heuristic function. The heuristic function (Gini’s Index) used in ADACOM is defined by Equation 8.
Secondly, by altering the parameters dynamically we are actually increasing the search space for the Antt. Here minimum number of cases per rule (Min_cases_per_rule) is the parameter which is changed dynamically. By decrementing the Min_cases_per_rule we are actually trying to find a few additional rules, if possible, so as to improve the predictive accuracy. It is evident that this change may result into over fitting of data, which in turn may lead to loss of generality of the rule list extracted.
Table 1. Comparison between Ant-Miner and ADACOM
OVERVIEW OF BANKRUPTCY PREDICTION IN BANKS
The problem of failure prediction of financial firms and banks came into picture with the study of Altman (Altman, 1968) in 1960. Now it has grown into one of the most extensively researched area since last few decades. Due to the adverse affects of bankruptcy on creditors, auditors, stockholders and senior management, bankruptcy prediction has gained interest of people from nearly all the above mentioned domains (Wilson, & Sharda, 1994).
Altman developed appropriate quantitative models by applying data mining techniques including discriminant analysis (Altman, Marco, & Varet, 1994), logit (Ohlson, 1980). probit (Zmijewski, 1984) and neural networks (Fletcher & Goss, 1993; Odom & Sharda, 1990; Tam & Kiang, 1992). CAMELS rating, which was used by Federal Deposit Insurance Corporation Improvement Act of 1991 to indicate the safety and soundness of the institution, is a six part rating system. This rating evaluates banks and firms in terms of: Capital Adequacy, Asset Quality, Management Expertise, Earnings Strength, Liquidity, and Sensitivity to Market Risk. To a large extent CAMELS ratings clearly provide regulators with important information. But Cole and Gunther (1995) reported that these CAMELS ratings decay rapidly, which is of much concern.
Altman (Altman, 1984) made use of financial ratios and multiple discriminant analysis (MDA) for bankruptcy prediction. Later it was observed that bankruptcy prediction is not restricted to only these types of classifiers. The logit model is employed by Ohlson (1980) to predict firm failure. Back propagation neural network (BPNN) and discriminant analysis were employed by Odom and Sharda (Odom, & Sharda, 1990, Odom, & Sharda, 1990). BPNN was applied by Tam (1991) and when compared with MDA, logistic regression, k-nearest neighbor (k-NN) method and ID3. He found that BPNN outperformed other techniques. Then, Salchenberger (Salchenberger, Mine, & Lash, 1992) claimed that the neural network performed better than logit model in terms of various possible errors.
In 1996, Serrano-Cinca (Serrano-Cinca, 1996) compared SOM with LDA and BPNN in financial diagnosis. He proposed two hybrid neural systems consisting of LDA, BPNN and SOM.
Rahimian et al. (1996) compared the performance of BPNN, Athena (an entropy-based neural network) and single layer perceptron on the bankruptcy prediction problem. Next, Olmeda
and Fernandez (1997) compared a number of classifiers in stand-alone mode and developed a hybrid intelligent system based on those individual classifiers. Later, Varetto (1998) worked in the field of genetic algorithm (GA) and applied it for bankruptcy prediction and compared its performance with that of LDA. Gorzalczany and Piasta (1999) presented neuro-fuzzy classifier (N-FC) and rough classifier (RC) as two different hybrid intelligent decision support systems for firm bankruptcy prediction and compared the results with the work done previously.
Further, McKee (2000) reported a rough set based bankruptcy prediction model. After this, Mckee and Lensberg (2002) proposed a hybrid approach to bankruptcy prediction, which made use of GP and variables from a rough set model derived in prior research to construct a bankruptcy prediction model. They concluded that this hybrid produced better results compared to that of rough sets model alone. Later, Atiya (2001) proposed some new financial indicators for bankruptcy prediction problem. Swicegood and Clark (2001) designed BPNN which used bank call reports to extract variables and compared DA, BPNN and human judgment in predicting bank failures. Park and Han (2002) proposed a hybrid of analytical hierarchy process, case based reasoning and K-nearest neighbors technique for bankruptcy prediction.
Concurrently Becerra et al. (2005) reported the use of linear discriminant models, multi-layer perceptron and wavelet networks for corporate financial distress. According to them wavelet neural networks may have advantages over the multi-layer perceptron and probably be a viable alternative to the linear discriminant models. Then, Shin et al. (2005) used support vector machine (SVM) to predict corporate bankruptcy and concluded that SVM outperformed the BPNN in terms of accuracy along with reduction in training dataset. Another great step in this field was the proposal of an early warning system for detecting banks suffering from serious problems by Canbas et al. (2005). They applied this methodology to Turkish banks dataset. Later, Ryu and Yue (2005) introduced isotonic separation for prediction of firm bankruptcy.
Cheng et al. (2006) put forward a distress prediction model that can be said to be a hybrid of radial basis function network (RBFN) learning and logit analysis. They concluded that the performance of the proposed RBFN is far superior when compared to the traditional logit analysis and back propagation neural network (BNN). Further contribution came from, Ravikumar and Ravi (2006) who proposed a fuzzy rule based classifier (FRBC) for bankruptcy prediction and reported that FRBC outperformed the BPNN in the case of US banks dataset. Later, Ravi et al. (2007) proposed a semi-online training algorithm for the radial basis function neural networks (SORBF) and applied it to bankruptcy prediction in banks. Semi Online Radial Basis Function Neural Networks without linear terms (SORBF2) showed better performance as compared to other techniques such as ANFIS, SVM, MLFF-BP, RBF, Semi Online RBFN without linear terms (SORBF1) and Orthogonal RBF. Ravikumar and Ravi (2006) also proposed an ensemble classifier based on ANFIS, SVM, RBF, SORBF1, SORBF2, Orthogonal RBF and MLFF-BP for the bankruptcy prediction problem and reported that ANFIS, SORBF2, MLP are the most prominent models as they appeared in the best ensemble classifier combinations.
Another quantitative approach in this regard is the automatic extraction of prediction rules from huge financial datasets. The DM techniques such as neural networks, GA and inductive learning methods have been successful in obtaining useful bankruptcy prediction rules (Messier & Hansen, 1988; Shaw & Gentry, 1990; Shin & Lee, 2002). Our effort to apply ADACOM to various bank datasets including UK, US, Turkish and Spanish were put in keeping in mind the robust, efficient and comprehensible nature of ADACOM.
Later, Ravikumar and Ravi (2007) conducted a thorough review of all the works reported using statistical and intelligent techniques to solve the bankruptcy prediction problem in banks and firms during 1968-2005. They compared the techniques in terms of prediction accuracy, data sources, and timeline of each study wherever available. Further, Ravi et al. (2008) developed a novel soft computing system, based on Multi Layer Perceptron (MLP), Radial Basis Function (RBF), Classification And Regression Trees (CART), probabilistic neural network (PNN), fuzzy rule based classifier (FRBC) and principal component analysis (PCA) based hybrid techniques, for bank performance prediction. Recently, Modified Great Deluge Algorithm based Auto Associative Neural Network (Pramodh & Ravi, 2007). principal component neural networks (Ravi, & Pramodh, 2008) and differential evolution trained wavelet neural network (Chauhan, Ravi, & Chandra, 2008) fuzzy rule based classifier preceded by feature selection (Chandra, & Ravi, 2009)and privacy preserving data mining (Ramu & Ravi, 2009) were applied to bankruptcy prediction with great success.
DATA
ADACOM was tested on a wide range of datasets. We worked on three different benchmark datasets from UCI (University of California Irvine) repository, namely, Iris, Wine and WBC (Wisconsin Breast Cancer) and four different bankruptcy datasets. Bankruptcy datasets include Spanish banks, Turkish banks, UK banks and US banks datasets. The Spanish banks’ data is obtained from Olmeda and Fernandez (Olmeda & Fernandez, 1997) Spanish banking industry suffered the worst crisis during 1977-85 resulting in a total cost of 12 billion dollars. The data of ratios used for the failed banks was taken, from the last financial statements, before the bankruptcy was declared and the data of non-failed banks was taken from 1982 statements. The Spanish dataset contains 66 banks with 9 features, out of which 37 banks went bankrupt and 29 banks are healthy. The predictor variables are presented in Table 2.
Turkish banks’ data was obtained from Can- bas, Caubak, & Kilic (2005) Banks Association of Turkey published 49 financial ratios. Initially, Canbas et al. (2005) applied univariate analysis of variance (ANOVA) test on these 49 ratios, of previous year, for predicting the health of the bank in the present year. However, only 12 ratios were chosen as the early warning indicators, which have the discriminating ability (significant level is
Figure 1. Distribution of accuracy for US dataset: Dotted line corresponds to maximum uncovered data (Max_uncovered_cases) equal to 5 and solid line corresponds to maximum uncovered data (Max_un- covered_cases) equal to 10
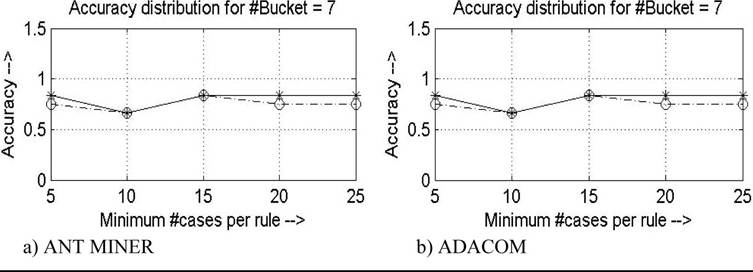
Figure 2. Distribution of accuracy for SPANISH dataset: Dotted line corresponds to maximum uncovered data (Max_uncovered_cases) equal to 5 and solid line corresponds to maximum uncovered data (Max_uncovered_cases) equal to 10
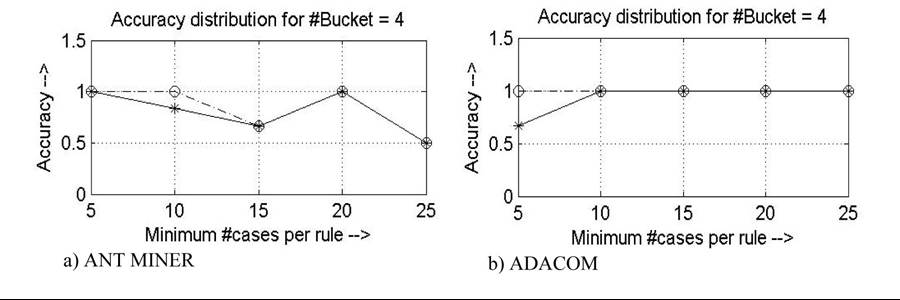
Figure 3. Distribution of accuracy for UK dataset: Dotted line corresponds to maximum uncovered data (Max_uncovered_cases) equal to 5 and solid line corresponds to maximum uncovered data (Max_un- covered_cases) equal to 10
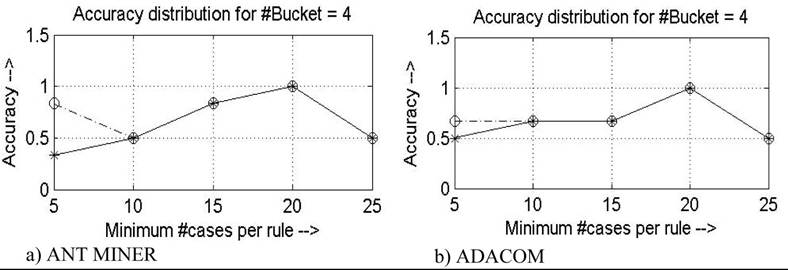
Figure 4. Distribution of accuracy for TURKISH dataset: Dotted line corresponds to maximum uncovered data (Max_uncovered_cases) equal to 5 and solid line corresponds to maximum uncovered data (Max_uncovered_cases) equal to 10
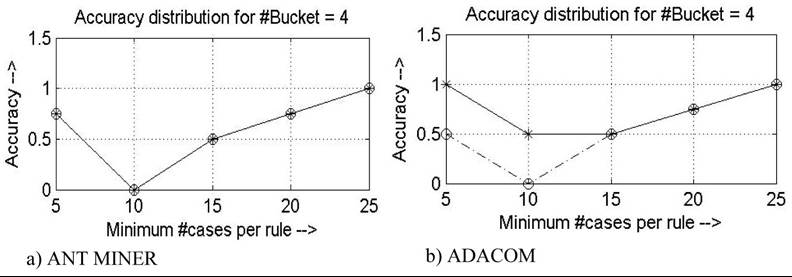
Figure 5. Distribution of accuracy for IRIS dataset: Dotted line corresponds to maximum uncovered data (Max_uncovered_cases) equal to 5 and solid line corresponds to maximum uncovered data (Max_un- covered_cases) equal to 10
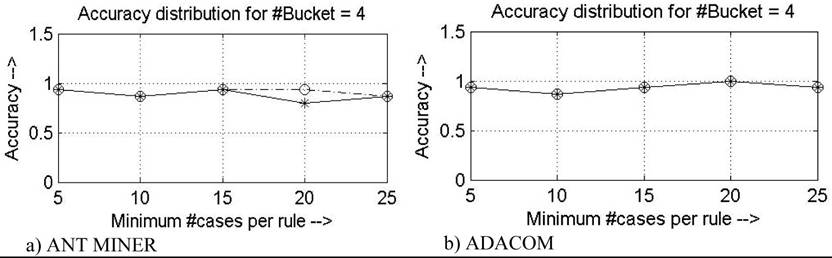
Figure 6. Distribution of accuracy for WINE dataset: Dotted line corresponds to maximum uncovered data (Max_uncovered_cases) equal to 5 and solid line corresponds to maximum uncovered data (Max_uncovered_cases) equal to 10
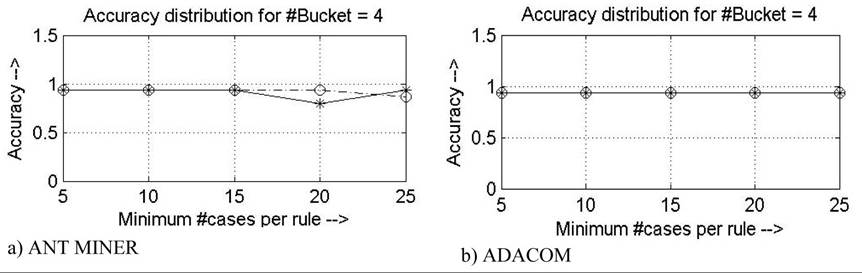
Figure 7. Distribution of accuracy for WBC dataset: Dotted line corresponds to maximum uncovered data (Max_uncovered_cases) equal to 5 and solid line corresponds to maximum uncovered data (Max_un- covered_cases) equal to 10
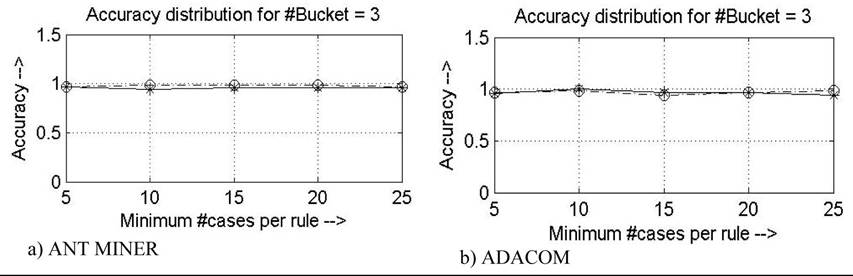
Table 6. Optimum range of parameters for different datasets (ADACOM)
| Buckets | Max Uncovered Data | Min Cases per Rule (Initial) | |
| Iris | 3-7, in steps of 1 | 5,10 | 5-15, in steps of 5 |
| Wine | 3-7, in steps of 1 | 5,10 | 5-20, in steps of 5 |
| WBC | 3-6, in steps of 1 | 5,10 | 5-25, in steps of 5 |
| US | 3-6, in steps of 1 | 5,10 | 5-20, in steps of 5 |
| UK | 3-6, in steps of 1 | 5,10 | 5-25, in steps of 5 |
| Spanish | 3-6, in steps of 1 | 5,10 | 5-25, in steps of 5 |
| Turkish | 3-6, in steps of 1 | 5,10 | 5-25, in steps of 5 |
specificity and area under ROC curve i.e. AUC value corresponding to each dataset.
Sensitivity in the context of bankruptcy is the ratio of the number of banks predicted correctly as bankrupt by the classifier to the total number ofbankrupt banks. Sensitivity forms an important criterion for comparing classifiers and handling ties when it comes to bankruptcy prediction problem since we actually want a bankrupt bank to be predicted bankrupt. On the other hand specificity is the ratio of the total number of non-bankrupt banks predicted correctly by the classifier to the total number of non-bankrupt banks. Using sensitivity and specificity we calculate the area under ROC curve (AUC value) by taking 100 - Specificity on X-axis and Sensitivity on Y-axis and this again forms basis for ranking classifiers. The classifier which gives maximum AUC value is considered to be the best classifier.
ADACOM is compared with Ant Miner for the bank datasets. Accuracy is the first criterion in judging the strength of the two classifiers. Next is Sensitivity and then AUC value. The winning values are marked underlined for each dataset in Table 5. ADACOM is found to outperform Ant Miner in the case of US dataset by obtaining 90.71% accuracy while Ant Miner is found to be 89.41% accurate. For other datasets there occurs a tie which is tackled by considering the sensitivity and AUC values. For UK dataset ADACOM obtained 68.50% sensitivity while Ant Miner got just 57.33%. From the viewpoint of AUC value, since ADACOM gave significantly higher values of area under ROC curve for each of the dataset, we can say that ADACOM is a better classifier compared to Ant Miner.
The extracted rule list for Iris, Wine and WBC datasets is shown in Tables 7, 8, and 9 respectively. The other datasets are bank datasets and were used to find out how efficient ADACOM is, if applied to bankruptcy prediction problem. The extracted rule list for these datasets viz. US, UK, Spanish and Turkish is shown in Tables 10, 11, 12, and 13 respectively. The extracted rule list for each dataset is of human comprehensible type i.e. it can be easily understood by a layman and applied to use for prediction. The rule list is exhaustive, compact and accurate.
The significance of dynamically decrementing the parameter minimum cases per rule can be seen
Table 7. Extracted rule list for Iris dataset
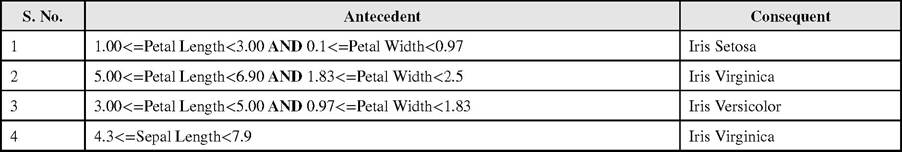
Table 8. Extracted rule list for wine dataset
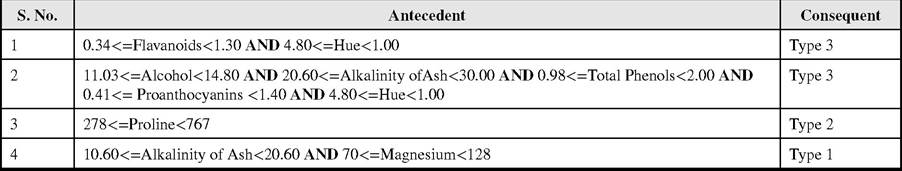
Table 9. Extracted rule list for WBC dataset
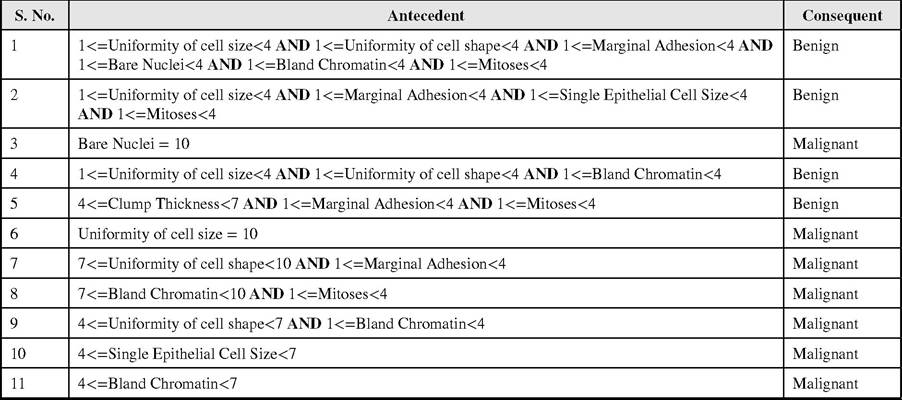
Table 10. Extracted rule list for UK dataset
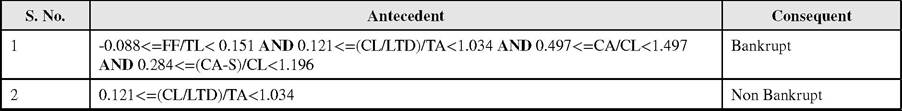
Table 11. Extracted rule list for US dataset
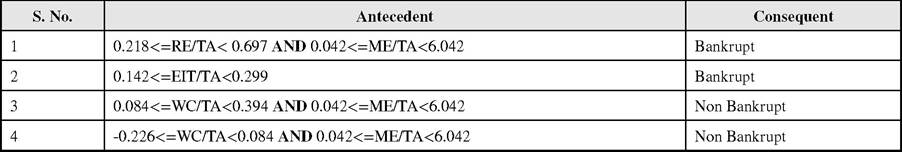
Table 12. Extracted rule list for Spanish dataset
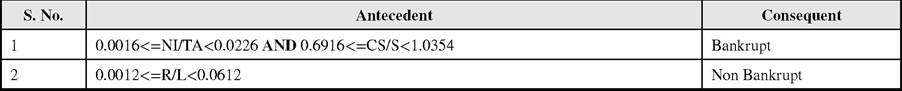
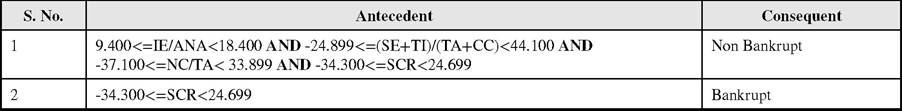
Table 13. Extracted rule list for Turkish dataset
in the change in accuracy distribution for the two versions (Figure 1 to Figure 7). It is observed that this feature improves the algorithm by making it more uniform and stable by overcoming the local minima and in the pursuit to reach global maximum, which in turn improves upon the predictive accuracy. Also it is evident, from the analysis done in the next section, that all the novelties introduced in ADACOM do not increase the computational complexity of the new algorithm much.
Analysis of ADACOM’s Computational Complexity
In this section, we present an analysis of ADA- COM’s computational complexity. This analysis is divided into three parts:
1. Preprocessing;
2. A single iteration of the WHILE loop of Algorithm 2; and
3. The entire WHILE loop of Algorithm 2.
Then we combine the results of these three steps in order to determine the computational complexity of an entire execution of ADACOM:
1. Computational complexity of preprocessing: The values of all ηιy are precomputed, as a preprocessing step, and kept fixed throughout the algorithm. These values can be computed in a single scan of the training set, so the time complexity of this step is O(nα), where n is the number of cases and a is the number of attributes;
2. Computational complexity of a single iteration of the WHILE loop of Algorithm 2: Each iteration starts by initializing pheromone, i.e., specifying the values of all τ.. (to). This step takes O(av), where a is the number of attributes and v is the number of values per attribute.
Next, we have to consider the REPEAT loop. Let us first consider a single iteration of this loop,
i. e., a single ant, and later on the entire REPEAT loop. The major steps performed for each ant are:
1. WHILE loop performing rule construction;
2. Rule evaluation;
3. Rule pruning; and
4. Pheromone updating.
The computational complexities of these steps are as follows:
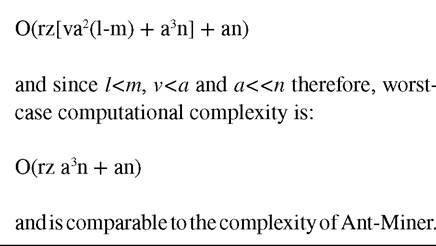
1. WHILE loop performing rule construction: The choice of a condition to be added to the current rule requires that an ant considers all possible conditions. The values of ηιy and τj (t) for all conditions have been pre-computed. Therefore, this step takes O(av). In order to construct a rule, an ant will choose k conditions. Note that k is a highly variable number, depending on the data set and on previous rules constructed by other ants. In addition, k ≤ a (since each attribute can occur at most once in a rule). Hence, one WHILE loop iteration or a single rule construction takes O(avk). This is repeated (l-m) number of times; where, l is the minimum number of cases per rule and m is the new lower threshold value. Hence, the complete while loop takes O(avk(l-m));
2. Rule evaluation: This step consists of measuring the quality of a rule, as given by (4). This requires matching a rule with k conditions with a training set with N cases, which takes O(kn);
3. Rule pruning: The first pruning iteration requires the evaluation of k new candidate rules (each one obtained by removing one of the k conditions from the unpruned rule). Each of these rule evaluations takes on the order of (n(k-1)) operations. Thus, the first
CONCLUSION AND FUTURE RESEARCH
We proposed a new version of Ant Miner (Parpi- nelli, Lopes, & Freitas, 2002) to be called, ADA- COM, which makes use of Gini’s index to extract the information corresponding to each variable from the dataset. In addition to this it involves dynamic parameter change to improve upon the prediction accuracy. Based on the experiments, we conclude that the ADACOM works better than the Ant Miner and its variants. We also conclude that ADACOM can be considered as a viable classifier for bankruptcy prediction problems.
Work in the direction to optimize the system parameters for improving the overall performance is carried out. We also tried to find out the optimal set of parameters which obtained the optimum accuracy while maintaining the simplicity and compactness of the rule base.
There is still tremendous scope of further improvement in terms of understanding the nature and influence of various system parameters. The heuristics applied and the pheromone updating and initialization approach are some of the critical areas of research, which still needs much research effort. In addition to this there is a scope to look into the term selection criterion by the ants, which if worked upon, may improve the predictive accuracy, noticeably. Another interesting area of research can be the application of the proposed algorithm to different diverse fields such as medicine, risk analysis, astronomy, agriculture
fraud detection, target marketing etc. Further, if possible, a hybrid of ADACOM and other data mining techniques to solve various classification problems can prove to be fruitful.
The proposed Advanced ACO algorithm (ADACOM) c an undoubtedly be a suitable tool for extracting the best set of rules for any classification problem whether it is medicine application, churn modeling, fraud detection, customer credit worthiness analysis, customer profiling, target marketing or bankruptcy prediction.
REFERENCES
Altman, E. (1968). Financial ratios, discriminant analysis and the prediction of corporate bankruptcy. The Journal of Finance, 23, 589-609. doi:10.1111/j.1540-6261.1968.tb00843.x
Altman, E. I. (1984). The success of business failure prediction models: An international survey. Journal of Banking & Finance, 8(2), 171-198. doi:10.1016/0378-4266(84)90003-7
Altman, E. I., Marco, G., & Varet, F. (1994). Corporate distress diagnosis: Comparisons using linear discriminant analysis and neural networks. Journal of Banking & Finance, 18, 505-529. doi:10.1016/0378-4266(94)90007-8
Atiya, A. F. (2001). Bankruptcy prediction for credit risk using neural networks: A survey and new results. IEEE Transactions on Neural Networks, 12, 929-935. doi:10.1109/72.935101 PMID:18249923
Becerra, V. M., Galvao, R. K. H., & Abou-Seads, M. (2005). Neural and wavelet network models for financial distress classification. Data Mining and Knowledge Discovery, 11, 35-55. doi:10.1007/ s10618-005-1360-0
Beynon, M. J., & Peel, M. J. (2001). Variable precision rough set theory and data discretisation: An application to corporate failure prediction. Omega, 29, 561-576. doi:10.1016/S0305- 0483(01)00045-7
Canbas, S., Caubak, A., & Kilic, S. B. (2005). Prediction of commercial bank failure via multivariate statistical analysis of financial structures: The Turkish case. European Journal of Operational Research, 166, 528-546. doi:10.1016/j. ejor.2004.03.023
Chandra, D. K., & Ravi, V. (2009). Feature selection and fuzzy rule-based classifier applied to bankruptcy prediction in banks. International Journal of Information and Decision Sciences, 1(4), 343-365. doi:10.1504/IJIDS.2009.027756
Chauhan, N. J., Ravi, V., & Chandra, D. K. (2008). Differential evolution trained wavelet neural network: Application to bankruptcy prediction in banks. Expert Systems with Applications, 36(4), 7659-7665. doi:10.1016/j.eswa.2008.09.019
Cheng, C. B., Chen, C. L., & Fu, C. J. (2006). Financial distress prediction by a radial basis function network with logit analysis learning. Computers & Mathematics with Applications (Oxford, England), 51, 579-588. doi:10.1016/j. camwa.2005.07.016
Cole, R., & Gunther, J. (1995). A camel rating’s shelf life. Federal Reserve Bank of Dallas Review, 13-20.
Dorigo, M., & Gambardella, L. M. (1997). Ant colony system: A cooperative learning approach to the traveling salesman problem. IEEE Transactions on Evolutionary Computation, 1, 53-66. doi:10.1109/4235.585892
Dorigo, M., & Maniezzo, V. (1996). The ant system: Optimization by a colony of cooperating agents. IEEE Transactions on Systems, Man, and Cybernetics, 26, 1-13. PMID:18263002
Dorigo, M., & Stutzle, T. (2004). Ant colony optimization. Cambridge, MA: MIT Press. doi:10.1007/b99492
Fayyad, U. M., Piatetsky-Shapiro, G., & Smyth, P. (1996). From data mining to knowledge discovery: An overview. Advances in Knowledge Discovery and Data Mining, I-34. Cambridge, UK: AAAI/MIT.
Fletcher, D., & Goss, E. (1993). Forecasting with neural networks: An application using bankruptcy data. Information & Management, 24(3), 159-167. doi:10.1016/0378-7206(93)90064-Z
Goldberg, D. E. (1989). Genetic algorithms in search, optimization and machine learning. Addison-Wesley.
Gorzalczany, M. B., & Piasta, Z. (1999). Neu- ro-fuzzy approach versus rough-set inspired methodology for intelligent decision support. Information Sciences, 120, 45-68. doi:10.1016/ S0020-0255(99)00070-5
Kim, D. H., Abraham, A., & Cho, J. H. (2007). A hybrid genetic algorithm and bacterial foraging approach for global optimization. Information Sciences, 177(18), 3918-3937. doi:10.1016/j. ins.2007.04.002
Kim, M., & Han, I. (2003). The discovery of expert’s decision rules from qualitative bankruptcy data using genetic algorithms. Expert Systems with Applications, 25, 637-646. doi:10.1016/ S0957-4174(03)00102-7
Liu, B., Abbass, H. A., & McKay, B. (2002). Density-based heuristic for rule discovery with ant-miner. In Proceedings of the 6th Australasia- Japan Joint Workshop on Intelligent Evolution Systems, Canberra, Australia (pp. 180-184).
Liu, B., Abbass, H. A., & McKay, B. (2003). Classification rule discovery with ant colony optimization. In Proceedings IEEE/WIC International Conference on IntelligentAgent Technology (pp. 83-88).
Lu, H., Setiono, R., & Liu, H. (1995). NeuroRule: A connectionist approach to data mining. In Proceedings of the 21st International Conference on Very Large Data Bases (pp. 478-489). Zurich, Switzerland: Morgan Kaufmann.
Mahfoud, S., & Mani, G. (1996). Financial forecasting using genetic algorithms. Applied Artificial Intelligence, 10(6), 543-566. doi:10.1080/088395196118425
Martens, D., De Backer, M., Haesen, R. J., Van- thienen, M., & Snoeck, B., & Baesens. (2007). Classification with ant colony optimization. IEEE Transactions on Evolutionary Computation, 11(5), 651-665. doi:10.1109/TEVC.2006.890229
McKee, T. E. (2000). Developing a bankruptcy prediction model via rough sets theory. International Journal of Intelligent Systems in Accounting Finance & Management, 9, 159-173. doi:10.1002/1099-1174(200009)9:33.0.CO;2-C
McKee, T. E., & Lensberg, T. (2002). Genetic programming and rough sets: A hybrid approach to bankruptcy classification. European Journal of Operational Research, 138, 436-451. doi:10.1016/S0377-2217(01)00130-8
Messier, W. F., & Hansen, J. (1988). Inducing rules for expert system development: An example using default and bankruptcy data. Management Science, 34(12), 1403-1415. doi:10.1287/ mnsc.34.12.1403
Odom, M., & Sharda, R. (1990). A neural network for bankruptcy prediction. In Proceedings of the IJCNN International Conference on Neural Networks, San Diego, CA.
Odom, M., & Sharda, R. (1990). A neural networks model for bankruptcy prediction. In Proceedings of the IEEE International Conference on Neural Network (pp. 163-168).
Ohlson, J. A. (1980). Financial ratios and the probabilistic prediction of bankruptcy. Journal of Accounting Research, 18, 109-131. doi:10.2307/2490395
Olmeda, I., & Fernandez, E. (1997). Hybrid classifiers for financial multicriteria decision making: The case of bankruptcy prediction. Computational Economics, 10, 317-335. doi:10.1023/A:1008668718837
Park, C. S., & Han, I. (2002). Case-based reasoning with the feature weights derived by analytic hierarchy process for bankruptcy prediction. Expert Systems with Applications, 23(3), 255-264. doi:10.1016/S0957-4174(02)00045-3
Parpinelli, R. S., Lopes, H. S., & Freitas, A. A. (2002). Data mining with an ant colony optimization algorithm. IEEE Transactions on Evolutionary Computation, 6(4), 321-332. doi:10.1109/ TEVC.2002.802452
Pramodh, C., & Ravi, V. (2007). Modified great deluge algorithm based auto associative neural network for bankruptcy prediction in banks. International Journal of Computational Intelligence Research, 3(4), 363-370. doi:10.5019/j. ijcir.2007.117
Quinlan, J. R. (1986). Induction of decision trees. Machine Learning, 1, 81-106. doi:10.1007/ BF00116251
Quinlan, J. R. (1993). C4.5: Programsfor machine learning. San Mateo, CA: Morgan Kaufmann.
Rahimian, E., Singh, S., Thammachote, T., & Virmani, R. (1996). Bankruptcy prediction by neural network. In R. R. Trippi, & E. Turban (Eds.), Neural networks in finance and investing. Burr Ridge: Irwin Professional Publishing.
Ramu, K., & Ravi, V. (2009). Privacy preservation in data mining using hybrid perturbation methods: An application to bankruptcy prediction in banks. International Journal of Data Analysis Techniques and Strategies, 1(4), 313-331. doi:10.1504/IJ- DATS.2009.027509
Ravi, V., Kurniawan, H., Thai, P. N. K., & Ravikumar, P. (2008). Soft computing system for bank performance prediction. Applied Soft Computing Journal, 8(1), 305-315. doi: 10.1016/j. asoc.2007.02.001
Ravi, V., & Pramodh, C. (2008). Threshold accepting trained principal component neural network and feature subset selection: Application to bankruptcy prediction in banks. Applied Soft Computing, 8(4), 1539-1548. doi:10.1016/j. asoc.2007.12.003
Ravi, V., Ravikumar, P., Ravi Srinivas, E., & Kasabov, N. E. (2007). A semi-online training algorithm for the radial basis function neural networks: Applications to bankruptcy prediction in banks. In V. Ravi (Ed.), Advances in banking technology and management: Impact of ICT and CRM. Hershey, PA: IGI Global. doi:10.4018/978- 1-59904-675-4.ch015
Ravikumar, P., & Ravi, V. (2006). Bankruptcy prediction in banks by fuzzy rule based classifier. The Proceedings of 1st IEEE International Conference on Digital and Information Management, Bangalore (pp. 222-227).
Ravikumar, P., & Ravi, V. (2006). Bankruptcy prediction in banks by an ensemble classifier. In the Proceedings of IEEE International Conference on Industrial Technology, Mumbai (pp. 2032-2036). Ravikumar, P., & Ravi, V. (2007). Bankruptcy prediction in banks and firms via statistical and intelligent techniques - A review. European Journal of Operational Research, 180(1), 1-28. doi:10.1016/j.ejor.2006.08.043
Ryu, Y. U., & Yue, W. T. (2005). Firm bankruptcy prediction: Experimental comparison of isotonic separation and other classification approaches. IEEE Transactions on Systems, Man and Cybernetics. Part A, 35(5), 727-737.
Salchenberger, L., Mine, C., & Lash, N. (1992). Neural networks: A tool for predicting thrift failures. Decision Sciences, 23, 899-916. doi:10.1111/j.1540-5915.1992.tb00425.x
Serrano-Cinca, C. (1996). Self organizing neural networks for financial diagnosis. Decision Support Systems, 227-238. doi:10.1016/0167- 9236(95)00033-X
Shaw, M., & Gentry, J. (1990). Inductive learning for risk classification. IEEE Expert, 47-53. doi:10.1109/64.50856
Shin, K. S., Lee, T. S., & Kim, H. J. (2005). An application of support vector machines in bankruptcy prediction model. Expert Systems with Applications, 28, 127-135. doi:10.1016/j. eswa.2004.08.009
Shin, K. S., & Lee, Y. J. (2002). A genetic algorithm applications in bankruptcy prediction modeling. Expert Systems with Applications, 23(3), 321-328. doi:10.1016/S0957-4174(02)00051-9
Sousa, T., Silva, A., & Neves, A. (2003). A particle swarm data miner. Lecture Notes in Computer Science, Springer Berlin/Heidelberg, 2902, 43-53. Swicegood, P., & Clark, J. A. (2001). Off-site monitoring for predicting bank under performance: A comparison of neural networks, discriminant analysis and professional human judgment. International Journal of Intelligent Systems in Accounting Finance & Management, 10, 169-186. doi:10.1002/isaf.201
Tam, K., & Kiang, M. (1992). Managerial applications of neural networks: The case of bank failure prediction. Management Science, 38(7), 926-947. doi:10.1287/mnsc.38.7.926
Tam, K. Y. (1991). Neural network models and the prediction of bank bankruptcy. Omega, 19, 429-445. doi:10.1016/0305-0483(91)90060-7
Vapnik, V. N. (1995). The nature of statistical learning theory. New York, NY: Springer-Verlag. doi:10.1007/978-1-4757-2440-0
Varetto, F. (1998). Genetic algorithm applications in the analysis of insolvency risk. Journal of Banking & Finance, 22, 1421-1439. doi:10.1016/ S0378-4266(98)00059-4
Wilson, R. L., & Sharda, R. (1994). Bankruptcy prediction using neural networks. Decision Support Systems, 11, 545-557. doi:10.1016/0167- 9236(94)90024-8
Witten, I. H., & Frank, E. (1999). Data mining- practical machine learning tools and techniques with Java implementations. Morgan Kauffmann.
Zmijewski, M. E. (1984). Methodological issues related to the estimation of financial distress prediction models. Journal of Accounting Research, 22(1), 59-82. doi:10.2307/2490859
This work was previously published in International Journal of Information Systems and Social Change (IJISSC), 4(3); edited by John Wang, pages 33-56, copyright 2013 by IGI Publishing (an imprint of IGI Global).