Chapter 47 Fund Manager Overconfidence and Investment Narratives
Arman Eshraghi
University of Edinburgh, UK
ABSTRACT
This chapter proposes a novel approach to measuring fund manager overconfidence and its impact on investment performance.
Among numerous behavioural biases identified in financial agents, overconfidence is perhaps most widely studied. Abundant research suggests that overconfidence can have a significant value-diminishing impact on financial decisions taken by small investors, but very few studies have sought to measure the overconfidence of professional investors. This study investigates more than 4600 US equity mutual funds and demonstrates why the proxies commonly used to measure investor overconfidence cannot be readily applied to fund managers, hence the usefulness of the content analysis approach as an alternative. A number of potential proxies for overconfidence including overoptimism, excessive certainty, and excessive self-reference are measured across fund manager reports. The findings suggest that superior past performance boosts overconfidence, which is, in turn, associated with diminished future investment returns. In addition, word frequency analysis is conducted to shed light on the genre and tone fund managers employ in their investment narratives and how this interplays with their demonstrated level of overconfidence.1. INTRODUCTION
Traditional finance often uses theoretical models predominantly assuming that economic agents are rational, i.e., efficient and unbiased information processors who constantly seek to maximise their utility. It is now widely agreed that these appealingly simple assumptions are quite inaccurate (Barberis & Thaler, 2003). Behavioural finance, on the other hand, assumes that investors are often
subject to behavioural biases that can negatively affect their financial decisions. These biases and heuristics, which are typically grounded in the cognitive psychology literature, are being increasingly applied in financial contexts.
Indeed, studies in behavioural finance often lead to conclusions that significantly resonate with what professionals in the finance industry experience and “know” at a deeper and perhaps unconscious level (Taffler & Tuckett, 2010).DOI: 10.4018/978-1-4666-6268-1.ch047
.
In this context, studying investor psychology is of paramount importance. Hirschleifer (2001), among others, provides a detailed survey of studies linking investor psychology to asset pricing and argues that this issue lies at “the heart of the grand debate in finance spanning the last two decades.” While a complete understanding of investor psychology requires familiarity with a wide range of individual and group behaviours, a few psychological traits are often recognized as highly influential in shaping investors decisions. The overconfidence effect clearly belongs to this list.
The overconfidence effect, due to its broadness and importance, has been widely influential outside the field of psychology (Daniel, Hirshleifer & Subrahmanyam, 1998; Statman, Thorley & Vorkink, 2006; Garcia, Sangiorgi & Urosevic, 2007). The role of overconfidence in influencing the behaviour of economic agents and, by extension, the functioning of financial markets, is an emerging, increasingly important and widely researched topic. In fact, it has been suggested that in the field of judgment and decision-making, no problem is “more prevalent and more potentially catastrophic than overconfidence” (Plous, 1993).
To properly understand overconfidence, it is appropriate to start from the closely related concept of “optimism.” Optimism seems to be an integral part of the human psyche. From the perspective of evolutionary processes, it is proposed that optimism must have brought the early humans important benefits, and therefore, in the course of thousands of years of evolution, it has become part of the genetic hardwiring of the human brain. Apart from this evolutionary perspective, it is now widely known that humans constantly learn about themselves and their abilities by observing the consequences of their actions.
In doing so, most people overestimate the degree to which they play a role in their own successes. This tendency is often amplified by an illusion of control, i.e. by thinking that one can control or influence an outcome. The overconfidence resulting from this mechanism can have several negative consequences for decision-making, as I will discuss in detail in the literature review. In fact, many researchers cite overconfidence as an explanation for wars, strikes, litigations, entrepreneurial failures and, not surprisingly, stock market bubbles (Glaser, Noth & Weber, 2007; Moore & Healy, 2008).A large body of literature has more recently focused on the overconfidence of corporate managers, and its impact on corporate investment decisions in areas such as capital structure and M&A activity (see Malmendier & Tate, 2005; Malmendier & Tate, 2008; Malmendier, Tate & Yan, 2011; Gervais, Heaton & Odean, 2011). The questions asked in this chapter, however, concern the impact of overconfidence on professional investors, which is a far less studied topic. The underlying research questions are motivated by three large areas of literature, i.e. studies of mutual fund performance and persistence, studies of financial accounting narratives and business communication, and studies of professional investor psychology. In particular, the following research questions are asked in this chapter:
1. Can fund manager overconfidence be robustly measured through content analysis of investment narratives?
2. How does a fund manager’s prior investment performance affect his or her overconfidence?
3. Do fund managers strategically change the tone of their investment narratives to justify their prior investment outcomes and express views on future investment outcomes?
As financial agents, professional investors often operate in an environment that is significantly different from the assumptions of conventional models. Conventional finance views financial agents in terms of “rational” actors in the marketplace who use formal methods of asset valuation in an attempt to identify those stocks or other assets which may be mispriced; even though, on the other hand, markets are viewed traditionally as efficient.
In contrast, the world of the real investment manager is one where she is swamped by information, is subject to acute information asymmetry, is under intense competition, and, in the end, has to rely to a large extent on subjective judgment, intuition and “gut feeling.” Added to this are the many imponderables which are outside her control, may largely drive her investment performance, and are intangible from an external viewer’s perspective (Holland, 2009). Ultimately, the professional investment manager is required to do a job which is very difficult if not impossible to do, and is under constant threat of dismissal if the returns she earns are not deemed satisfactory.This chapter argues that such environmental forces can, in a subtle way and through time, feed into professional investors’ overconfidence, and indirectly affect how they make investment decisions. This chapter attempts to take a mixed methods research approach. Prior research has found significant potential in applying mixed methods research strategies in the accounting and finance domain. The key strengths of mixed methods research include both testing and building theories through extension of existing theories as well as convergence and contradiction of findings.
The chapter is organised as follows. Section 2 introduces the background, the core constructs and variables, and discusses the challenges of measuring overconfidence. Section 3 introduces the data and its sources, and provides relevant descriptive statistics. Section 4 empirically explores how past investment performance affects the overconfidence of fund managers, and the genre and tone of their investment narratives. Finally, section 5 concludes the chapter, and discusses research implications as well as areas for further work.
2. BACKGROUND
Humans constantly learn about themselves and their abilities by observing the consequences of their actions; in doing so, most people overestimate the degree to which they play a role in their own successes.
A number of constructs need to be clearly differentiated in this discussion. For example, Van den Steen (2002) provides a comprehensive categorization for this purpose: Self-serving attribution bias refers to the fact that people attribute success to their own dispositions and skills, while they attribute failure to external forces or bad luck; ego-centric or self-centric bias refers to the fact that individuals taking part in a joint endeavor relatively over-estimate their contribution to a good outcome; overconfidence relates to the fact that people over-estimate the accuracy of their estimates and predictions; overoptimism refers to the fact that individuals tend to be overoptimistic about future events and the consequences of their actions; and finally, illusion of control people think they have more influence than they actually do over the outcome of a random or partially random event.Prior psychology literature has produced two different types of explanation for overconfidence and its associated effects. From one perspective, these phenomena have been interpreted in the context of motivational biases, the argument being that individuals are motivated to hold unrealistically positive self-perceptions in order to increase their own happiness and well-being. The core assumption is, of course, that people seek to maximize their happiness in a utilitarian way. Alternatively, a different, perhaps complementary, view is put forward by cognitive psychologists who argue that people generally expect to succeed, and they often accept responsibility for their expected outcomes. Hence, in combination of the two effects, people tend be prone to self-serving attribution bias.
Importantly, this self-serving attribution bias can, in turn, produce overconfidence. Gervais and Odean (2001) explain that investors may falsely attribute superior past performance to their own skill, and inferior past performance to chance, which produces overconfidence. Overestimation of one’s investment skill can, in this manner, result in excessive trading, as documented by Odean (1999).
Despite the extensive literature examining attribution and overconfidence among ordinary individuals, corporate executives, traders, and retail investors, there are few studies that can claim to have examined the role of such biases in subsequent fund manager performance. In particular, due to the fact that the bulk of investment in financial markets is made by institutional investors, any link between a professional asset manager’s performance and her potential overconfidence or susceptibility to self-attribution bias can be of considerable importance, both to the academic literature and the investment industry.The overconfidence effect is commonly measured in psychology through laboratory-type experiments (for a review see Hoffrage, 2004; Eshraghi, 2012). However, few of these experimental approaches are robust when it comes to gauging investor overconfidence, not least because of issues concerning ecological validity. Thus, researchers often resort to indirect effects proxying for overconfidence among investors. For example, trading activity is a commonly used proxy of investor overconfidence (Barber & Odean, 2000). However, while this measure clearly works for retail investors, it cannot be as easily used for fund managers. Fund managers do not necessarily engage in excessive trading due to overconfidence; rather, they may have to increase their turnover after a rise in fund inflows, which usually follows good past performance. Putz and Ruenzi (2011) control for this effect in their examination of the turnover of US equity mutual funds over the period 1994-2004. The authors conclude that fund managers indeed trade more after good past performance, and their higher trading is driven by individual portfolio performance. This is consistent with superior past performance producing task-specific overconfidence. In a similar way, Chow, Lin, Lin and Weng (2009) examine a sample of equity mutual funds, and show that fund managers behave overconfidently conditional on prior performance. They also demonstrate that such behavior deteriorates subsequent performance. However, one should note that other potential confounding factors may affect managerial trades, such as incentive for windowdressing, tax-management issues, preference for liquidity and changing investment styles to attract fund flows, thus reducing the robustness of trading activity as a proxy for overconfidence.
Another proxy recently used in the literature for measuring overconfidence is Active Share. Active Share refers to the share of portfolio holdings that differ from benchmark index holdings, and is introduced as a new measure of active portfolio management by Cremers and Petajisto (2009). Using this measure, Choi and Lou (2010) are able to show that mutual fund managers are typically susceptible to the self-serving attribution bias. However, Active Share is not a “clean” measure of overconfidence either. A similar set of confounding variables can influence the way fund managers choose to arrange their portfolios. In addition, defining the optimal benchmark portfolio against which to measure Active Share is not trivial.
A more straightforward way of measuring overconfidence may, of course, be to examine the actual estimates and predictions of fund managers about their subsequent performance. Willis (2001), for example, investigates annual earnings forecasts that are publicly released in conjunction with mutual fund manager stock recommendations, thereby finding evidence of excess optimism. Gort, Wang and Siegrist (2008) examine overconfidence using a similar method, and conclude that the pension fund managers in their sample provide excessively narrow confidence intervals when asked to forecast future returns or estimate past returns of various assets. However, since their approach requires questionnaire-type surveys attempting to measure fund manager confidence intervals, it cannot be readily used for a large sample of respondents and is subject to the usual robustness concerns associated with this type of secondary data collection.
In this chapter, a novel approach for measuring professional investor overconfidence is suggested, i.e., studying the narratives in investment company annual reports. The three proxies for indirectly measuring overconfidence are overoptimism, excessive certainty and excessive self-reference. The DICTION software is used to extract the first two variables. Predominantly, the optimism and certainty master variables are used. In DICTION, optimism is defined as, “language endorsing some person, group, concept or event or highlighting their positive entailments.” The formula used for calculating “net optimism” is: [praise + satisfaction + inspiration] - [blame + hardship + denial]; in other words, “optimism” minus “pessimism.” DICTION defines certainty as “language indicating resoluteness, inflexibility, and completeness and a tendency to speak ex cathedra.” The DICTION formula for certainty is: [ tenacity + leveling + collectives + insistence] - [numerical terms + ambivalence + self reference + variety]. I use the adjustment proposed in Demers and Vega (2010) to include numerical terms as adding to rather than subtracting from the certainty score.
The third proxy used for overconfidence is self-reference, which is defined as the normalized frequency of first-person singular and plural pronouns in each narrative (I, me, my, mine, we, us, our, ours), which can be derived from DICTION with a simple calculation. One can also explore the possibility of constructing a meta-variable comprising some or all of the above overconfidence proxies. Since the face validity of these variables is debatable, the usefulness of such an overconfidence meta-variable will be evaluated on an empirical basis.
As explained above, the sample narratives are sourced from investment company annual reports. The importance of studying finance and accounting narratives is illustrated by the growing emphasis on the objectivity of accounting literature as a means of communicating financial performance. The narratives studied here merit close attention as they are essential parts of the organizational sense-making process among the firm’s stakeholders (Gabriel, 2000).
In terms of structure and intended purpose, investment company annual reports are comparable to corporate annual reports. Stanton and Stanton (2002) cite a study which demonstrates that corporate annual reports have become “a highly sophisticated product of the corporate design environment, the main purpose of which is to proactively construct a particular visibility and meaning rather than revealing what was there.” This is consistent with the inherent reflexivity of language, i.e. language both mirrors and constructs (construes) reality in a desired way Fairclough and Holes (1995). In other words, as Hines (1988) suggests, people create a picture of an organization, they think and act on the basis of that picture, and “by responding to that picture of reality, they make it so.”
There exists a substantial body of literature examining corporate annual reports from various perspectives. Researchers often investigate sections of, or even the whole annual report and focus on themes such as impression management, marketing, organizational legitimacy, political economy, accountability, etc. Stanton and Stanton (2002) provide a comprehensive review of this vast literature by categorizing 70 of the most “useable studies” in the field. The focus of these studies has been extremely wide, with no one particular area dominating the attention of the cited authors.
The annual report studies investigating narratives and stories appear to agree on a number of shared patterns: the way a story is told by the narrator, as well as what the story says, both matter. Linguistic theory provides “a range of language choices and constructions that report preparers can use to pursue their goals without misinformation or complex language” (ibid) and, as such, the choice of verb structures, themes, subjects, context, cohesion and condensations all determine meaning, as Thomas (1997) explains.
Just as importantly, narrative theories discuss different sets of factors that influence meaning, (Stanton & Stanton, 2002). These include the sources of meaning, the narrative structure, the reader interaction with the text, the existence of different narrators and different genres (modes of narration e.g. epistles, lessons, sermons, essays and question-and-answer dialogues).
Prior research also concurs that language can often be used to obfuscate bad news and thus blur distinctions on the causes of poor performance. Courtis (2004) defines obfuscation as “a narrative writing technique that obscures the intended message, or confuses, distracts or perplexes readers, leaving them bewildered or muddled.” Narrators often achieve this effect through “the use of esoteric or obscurantist vocabulary and/or gobbledygook, extraneous and non-relevant information, long sentences with complex grammatical structures and/or high variability in reading ease, and convoluted and/or spurious argumentation.”
I also take note of the methodology recommended for analysing CEO communication by Craig, Garrot and Amernic (2001) and Amernic, Craig and Tourish (2010). The former study states that any attempt at “close reading” CEO narratives should reveal (1) the metaphors used by, (2) the ideology adhered to, and (3) the rhetoric implemented by the CEO as well as any (4) critical ‘silences’, (5) dichotomies and (6) false distinctions made by the executive. The latter study adds to this list (7) the CEO’s mindset and (8) the CEO’s attitude to risk exposure and risk management. In brief, managers are equipped with an increasingly “complex arsenal of communication tools” including selection and integration of narratives, language, images, graphs etc. to create, what Jameson (2000) calls, a hyperstructure that effectively engages the audience as part of the story. Finally, it is important not to forget that the narrator is an implicit audience of his or her own story.
3. THE STRUCTURE OF FUND MANAGER NARRATIVES
This section provides information about the sources as well as a general outline of the data used in this study. The mutual fund performance data used in this research is sourced from the CRSP Survivor-Bias-Free Mutual Fund Database. This database, widely used in the finance and accounting literature, is designed to facilitate research on the historical performance of open-ended US mutual funds. It claims to be “the only complete database of both active and inactive mutual funds” and distinguishes itself by providing survivorbias-free data. The mutual fund annual reports are sourced from the Electronic Data-Gathering, Analysis, and Retrieval (hereinafter EDGAR), a publicly available database provided by the US Securities and Exchange Commission (hereinafter SEC). It performs automated collection, validation, indexing, acceptance and forwarding of submissions by companies and, in some cases, individuals who are legally required to file forms with the SEC.
It is important to discuss the issue of authorship of mutual fund annual reports. Firstly, according to the conventions in the mutual fund industry, fund managers often write their own reports and commentaries, which may then be edited by in-house editors only to check spelling and grammar, and to ensure presentational consistency with other sections of the annual report. In other words, the in-house editors are mostly concerned with the professional presentation of the annual report as a whole document and are much less concerned with the core thematic elements, sentence structure and other rhetorical features of the fund manager narratives. Secondly, similar to the prevailing practice in CEO communication, fund managers are signatories of their reports and assume legal responsibility for their content. Amernic, Craig and Tourish (2010) argue that this acts as an incentive for them to closely scrutinise and approve the final version of the narrative before signature and publication. More importantly, they argue, “whether or not a CEO is actively involved in composing a letter to stockholders does not matter: the words in the CEO’s letter are symbolic and emblematic, and the reader takes them to be the CEO’s own.” Clearly, a similar proposition can be made about fund managers.
The question of authorship can be further examined by investigating the variations between individual fund manager reports within the same investment company. This is, if we assume that the content of fund manager reports and the writing style of fund managers are substantially influenced by organizational factors or the role of in-house editors, we should expect to find a somewhat homogeneous set of fund manager narratives in each company’s annual report regardless of who the fund manager is. This, however, does not appear to be the case. In order to study the extent of cross-sectional variation in fund manager reports, I randomly select 50 such reports from five different investment companies. The results of cross-comparisons across a range of DICTION variables as well as readability and tone indicate that there is indeed a significant level of within-sample variation that can be attributed to individual fund manager characteristics. A more robust test that would control for the types of funds in cross-comparisons can further confirm this observation.
For illustration purposes, a sample fund manager narrative is provided in Box 1, extracted from the 2007 annual report of a large-cap equity mutual fund. From a sense-making perspective, it is interesting to observe how the fund manager seeks to manage the impression of the fund and its performance.
The sample of mutual funds used in this study covers all actively managed equity mutual funds with a unique manager and complete returns data for at least three consecutive years during the 2003-09 period. Annual reports with no substantial fund manager commentary, i.e., less than 200 words, are removed from this sample. Thus, for the purpose of the panel data analysis, I arrive at 4,659 unique actively managed equity mutual funds that have a unique fund manager and complete returns data for at least three years during the sample period, and have corresponding fund manager commentaries. This yields the main sample for most of the empirical tests in this chapter. Table 1 reports summary statistics on the total actively managed equity mutual funds that have a corresponding match in the CRSP database. The statistics provided are related to the annual performance on an absolute basis, fund size, expenses and turnover. Definitions of these measures are also listed.
This study specifically looks at optimism, certainty and self-reference of fund manager commentaries to infer the overconfidence of their corresponding managers. Table 2 summarises the descriptives used in this study based on the main sample.
I also calculate Pearson’s correlations among the overconfidence measures derived from the narratives and the risk factors embedded in the Carhart (1997) asset pricing model (see Eshraghi, 2012 for a discussion on this). Importantly, the crosscorrelations between the overconfidence proxies suggest that optimism and certainty are to some extent associated measures of overconfidence (r=0.416) and they are both positively correlated with momentum (previous one-year return), i.e. a fund manager experiencing positive prior returns is likely to grow more optimistic about her future performance as well as more resolute in her tone of voice. There is an also significant correlation between optimism and self-reference (r=0.755) which is consistent with the expectations and the empirical evidence demonstrated in this chapter.
In addition, the relatively low correlations between the proxies and the Carhart risk factors suggest fund manager overconfidence, as measured here, is not directly driven by any intrinsic fund characteristics and associated risk factors. Particularly in the case of momentum, one can argue that a large part of the variation in optimism
Box 1.
Dear Fellow Blue Chip 35 Fund Shareholder,
For the six months ending June 30, 2007, our Fund appreciated 4.04%, beating our primary market benchmark-quite an accomplishment in a market dominated by small- and mid-size stocks-but lagging our peer benchmark. The S&P 500 Index rose 3.16%, and the Lipper Large-Cap Core Funds Index rose 5.35%. Considering we had a “headwind” of almost two percentage points due to the size of our holdings versus our primary market benchmark, we are quite pleased.
Even more positive was our relative performance in the market downturn of the full fiscal year ending June 30, 2007. While declining a significant 18.77%, we provided a sizable cushion relative to our performance benchmarks-just at the time when it counted the most (from a risk perspective). The S&P 500 Index declined 26.21% for the fiscal year, and the Lipper Large-Cap Core Funds Index declined 25.69%. Primary reasons for this outperformance were: a) a slight tailwind by way of company size on the way down, b) significant benefit from our “roughly equal weighted” indexing strategy, which performs particularly well in a precipitous market fall and recovery, c) a flight to “blue chip” quality in the first three quarters of the fiscal year, and d) a particularly well-timed re-composition of Bridgeway Ultra-Large 35 Index in March, when we added Goldman Sachs, Schlumberger, McDonalds, and 3M Company; all have beaten the broader market since adding them.
After strong large company dominating years in 2005 and 2006, small and especially ultra-small stocks came back with a vengeance in the June quarter. We were able to beat our primary market benchmark over the last six-month period in spite of this disadvantage. Since a primary determinant of our performance relative to the S&P 500 Index is size dominance, i.e. whether small or large stocks are leading in the marketplace, it is helpful to review this data often. Our informal goal is to outperform the S&P 500 in the vast majority of calendar years in which ultra-large companies beat ultra-small ones (We have done this every calendar year since inception) and (we believe, due to the structure of our index) in half the years that ultra-small ones beat ultra-large ones. This latter goal is no mean feat, but we have accomplished it in four of eight calendar years since inception and appear headed for another one in 2007.
The primary reason for our strong six-month (January-June) period performance was our “roughly equal weighting strategy,” which requires us to invest more in the stocks that have gone down the most. Our quarterly rebalancing that took place in late March was fortuitously near the March 9 market bottom. The stocks that had declined the most from July 2006 through early March 2007 were typically the ones that bounced back the most in the June quarter. The recent market performance really showcased the advantages, especially by way of risk control, of our roughly equal weighting strategy (see section on risk below). An environment least friendly to this strategy would be a long and steady market appreciation, such as in the late 1990's, or one of steady and prolonged decline. However, we hope our large company advantage would more than offset the weighting strategy disadvantage in some of these periods, as was true in 1998 and 1999.
Our annual performance tells the story of a) the worst bear market in the last seven decades, b) one that was led by large financial stocks, and c) one that didn’t offer many places to hide. At the other end of the spectrum are three financial firms we might rather like to forget. We wrote up the experience of AIG in our semi-annual report in December 2006. In our March report, we wrote about McDonalds, “Personally, we don’t like adding a consumer non-cyclical company at what looks like might be a market bottom... but we follow statistical procedures which pretty much ensure this company is added.” So far, following the discipline of our process has worked out well, as the stock has outperformed the broader market in spite of a correct call (at least so far) on the direction of the market since March 31, 2007.
is not explained by momentum. In other words, the implication is that the overconfidence measure used in this study is capable of capturing an effect distinct from other previously studied risk factors that influence investment performance.
4. OVERCONFIDENCE AND TONE OF FUND MANAGER NARRATIVES
In this section, I empirically investigate how past investment results influence fund manager overconfidence and tone. In order to test the impact of past investment performance on overconfidence, I rank the funds in each year on prior-year Carhart alphas and form decile portfolios. Then, I combine all the extreme (top and bottom) deciles across 2003-2009 and use the t-test with unequal variance to measure the difference between the two groups. The results are displayed in Table 3 (Panel A). I reiterate this analysis based on funds ranked by prior three-year alphas (Panel B).
It can be inferred that prior positive performance, both during the previous one-year and previous three-year periods, generates excess optimism as well as certainty as expected and
Table 1. Summary statistics of the sample mutual funds
| Year | Number | Average Return (% per year) | Total Net Assets (Smillion) | Expense Ratio (% per year) | Turnover (% per year) |
| 2003 | 2169 | 30.2 | 295.2 | 1.5 | 86.3 |
| 2004 | 2201 | 38.0 | 336.6 | 1.6 | 91.9 |
| 2005 | 2287 | 32.6 | 385.0 | 1.4 | 105.2 |
| 2006 | 2490 | 25.4 | 439.9 | 1.5 | 92.0 |
| 2007 | 2355 | -18.9 | 485.2 | 1.5 | 133.6 |
| 2008 | 2612 | -25.1 | 377.6 | 1.3 | 125.6 |
| 2009 | 2549 | -10.6 | 441.4 | 1.4 | 108.7 |
| Mean | 2380 | 10.2 | 394.4 | 1.5 | 106.2 |
| Median | 2355 | 25.4 | 385.0 | 1.5 | 105.2 |
| SD | 173 | 27.2 | 65.9 | 0.1 | 18.9 |
Absolute Return: Daily, monthly, and annual returns values are calculated in CRSP as a change in NAV (net asset value) including reinvested dividends from one period to the next. NAVs are net of all management expenses and 12b-1 fees (12b-1 fee denotes the ratio of the total assets attributed to marketing and distribution costs. It represents the actual fee paid in the most recently completed fiscal year as reported in the Annual Report Statement of Operations. Front and rear load fees are excluded). TNA: Total net assets as of the last trading day of each month, averaged for each year. Expense Ratio: Expense Ratio as of the most recently completed fiscal year. It represents the ratio of total investment that shareholders pay for the fund’s operating expenses, which include 12b-1 fees. Turnover: Fund turnover ratio. It is defined as the minimum of aggregated sales or aggregated purchases of securities, divided by the average 12-month total net assets of the fund.
the difference between the extreme deciles for both variables is significant at the 5% level. In fact, funds belonging to the top decile of Carhart alpha have a mean optimism that is, on average, about three standard deviations higher than the funds belonging to the bottom decile in the case of previous one-year alpha. The difference between the two deciles when funds are ranked by previous three-year alphas is similar but less pronounced. The effect of prior performance on fund manager certainty is also similar. The difference between the funds in the two extreme deciles in terms of selfreference is also significant in the case of previous one-year alpha and suggests that high-performing fund managers tend to refer to themselves more often their poor-performing counterparts.
I also investigate the investment narratives from the perspective of genre theory. By studying the corpus-linguistic features of fund manager reports, I demonstrate how different groups of fund managers develop the core message in their narratives in very different ways (i.e. genres) in light of past performance. The notion of genre is grounded in organizational communications.
Table 2. Descriptive statistics of overconfidence proxies
| Mean | SD | Min | 1st Quarter | Med | 3rd Quarter | Max | |
| Optimism | 52.20 | 2.11 | 43.50 | 49.28 | 51.58 | 55.42 | 64.16 |
| Certainty | 47.25 | 1.37 | 44.39 | 46.14 | 46.92 | 48.15 | 51.97 |
| Self-Reference | 1.13 | 0.18 | 0.74 | 0.99 | 1.04 | 1.28 | 1.76 |
This table reports the distribution of selected overconfidence proxies based on the content analysis of fund manager narrative, as well as positive/negative tone and readability. Optimism and certainty are computed by Diction, and certainty is adjusted according to Demers and Vega (2010). The optimism scores are based on the fund outlook section, the self-reference scores are based on the past-performance discussion section and certainty scores are based on the whole narrative.
Table 3. Variation of fund manager overconfidence in extreme portfolios sorted on prior Carhart alphas
| Panel A | Top Decile of Carhart Alpha (PRlYR) | Bottom Decile of Carhart Alpha (PR1YR) | t-Test with Unequal VaR | ||
| Mean | SD | Mean | SD | ||
| Optimism | 55.931 | 2.097 | 49.737 | 1.95 | 2.544** |
| Certainty | 51.013 | 2.25 | 45.634 | 2.210 | 2.339** |
| Self-Reference | 1.944 | 0.249 | 1.095 | 0.254 | 1.895* |
| Panel B | Top Decile of Carhart Alpha (PR3YR) | Bottom Decile of Carhart Alpha (PR3YR) | t-Test with Unequal VaR | ||
| Mean | SD | Mean | SD | ||
| Optimism | 54.140 | 2.115 | 50.206 | 2.18. | 2.218** |
| Certainty | 51.637 | 2.047 | 45.792 | 2.306 | 1.982** |
| Self-Reference | 2.043 | 0.285 | 1.266 | bgcolor=white>0.2621.635 | |
This table compares the top and bottom deciles formed by sorting the funds in each year on prior-year Carhart alphas and combining all the extreme deciles across 2003-2009. *, **, *** indicate significance at 10%, 5%, and 1% levels based on two-tailed tests.
Miller (1984) defines genre as “typified rhetorical actions based in recurrent situations.” Genres exist at different levels of abstraction, and can be identified in very broad as well as very specific contexts. For instance, Rutherford (2005) identifies the narrative section of UK corporate annual reports (also known as the Operating and Financial Review) as a middle-range genre of corporate communications between organizations and their stakeholders. In a similar way, I argue that the fund manager narratives can be treated as an impactful genre of corporate communication between the fund manager and the investors with its own distinct sub-genres. I use word-frequency analysis to demonstrate which sub-genres exist in fund manager narratives and discuss their links to past and expected future investment performance.
Word-frequency analysis is part of an increasingly versatile and modern methodological toolbox in corpus linguistics. As an empirical methodology, corpus linguistics seeks to analyse actual patterns of language use by employing a large, systematically organized body of texts known as the corpus (Rutherford, 2005). It can be used in textual analysis to distinguish between different genres, as well as explore features of individual genres. In the context of this research, wordfrequency analysis is primarily used to identify the different sub-genres used in the fund manager’s communication of performance results.
The sample used in this section consists of all actively-managed equity mutual funds with unique managers and complete returns data during 2003-09 that have significant fund manager commentaries in their annual reports. The average length of each fund manager commentary is 692 words (about two pages). Therefore, on average, the whole corpus under study consists of around 700,000 words for each year.
I investigate the trend of certain corpus- linguistic features of fund manager commentaries throughout the sample period, and, in particular, focus on 2006 and 2008. These two years reflect, to a large extent, opposite snapshots of the overall economic environment affecting the mutual fund industry, as proxied by leading market indices. In other words, while 2006 is a sufficiently good proxy for a bullish year with regards to the US and global financial markets, 2008 can be treated as a bearish year in the same context.
Based on the funds’ broad investment style denoted by their Lipper Objective Code, I subdivide the sample funds into two categories of value-oriented and growth-oriented funds. Value- oriented funds normally seek a high level of current income through investing in income-producing stocks, bonds, and money market instruments. Growth-oriented funds normally invest in companies with long-term earnings expected to grow significantly faster than the earnings of the stocks represented in the maj or unmanaged stock indices. I also divide the funds, based on prior-year absolute annual returns into loss-making (negative return), least-profitable (bottom decile positive return) and most profitable (top decile positive return) categories. The number of funds in each category changes during the sample years. Finally, I divide the funds based on size (total net assets) into the smallest (bottom decile) and largest (top decile) categories. Hence, I end up with seven categories for the purpose of corpus-linguistic analysis.
The first stage of the analysis explores the frequency of eligible words across all the sample annual reports. Similar to the methodology used by Rutherford (2005), the following word groups are excluded from the analysis in order to make a list of eligible words:
1. Frequently occurring grammatical elements such as articles, conjunctions, pronouns, and common verbs;
2. Days, months and years;
3. Numbers, including monetary amounts, in words, figures and denominations.
Rutherford also manually removes specific company and product names, but this is clearly not feasible in my much larger sample. However, these specific words should not introduce any significant bias in my analysis as they often include the name of the fund discussed in each commentary and therefore, in aggregate, are not expected to appear among high-frequency words.
Table 4 lists the average 50 most frequently used eligible words across the sampled commentaries. I merge all the fund manager commentaries to arrive at a master corpus document for each year. Then, I determine the highest-frequency words in each year and average them across the years.
The word “fund” is the most frequently used word in the corpus closely followed by the pronoun “we.” This is an interesting observation as the higher occurrence of the latter relative to the former may be an alternative proxy for self-reference and possibly even fund manager narcissism. I define a simple ratio by dividing the number of “we” instances by the number of “fund” instances for each narrative. For the whole sample, this ratio is equal to 0.824.1 Higher values of the ratio (particularly more than 1.016 which is one standard deviation larger than its mean) can signal fund manager narcissistic tendencies. As expected, this ratio is highly correlated (0.831) with my standard self-reference measure which looks at the frequency of all first-person singular and plural pronouns.
Next, I investigate the linguistic features of the fund manager narratives through the sample years. The mutual fund industry experienced two rather distinct economic macro-environments during the sample period, i.e. the bullish years of 2003-2006 and the bearish, volatile years of 2007-2009. In this context, it is interesting to observe the impact of the economy and other external factors on the lexical features of fund manager reports. Table 5 demonstrates a number of these measures and lists the 10 most frequently used words in the commentaries each year.
A number of interesting observations can be made here. During the bullish years, with the exception of 2006, fund managers more frequently refer to themselves by mentioning “we” rather than the “fund,” while the reverse pattern emerges during the bearish years. The difference in word frequencies is significant at the 5% level using the t-test with unequal variance.
Similarly, fund managers appear to write more frequently about their often “strong” record of “performance” or “growth” during the pre-2007 years. On the contrary, during the 2007-2009 pe-
Table 4. Highest frequency eligible words commonly used in fund manager narratives
| Instances | Frequency | Word | ||
| 11312 | 1.63% | fund | ||
| 9323 | 1.34% | we | ||
| 7086 | 1.02% | year | ||
| 5967 | 0.86% | market | ||
| 5594 | 0.80% | performance | ||
| 4973 | 0.71% | funds | ||
| 4973 | 0.71% | growth | ||
| 3605 | 0.52% | investment | ||
| 3232 | 0.46% | interest | ||
| 3232 | colspan=2 bgcolor=white>0.46%stock | |||
| 3108 | 0.45% | index | ||
| 3108 | 0.45% | sector | ||
| 3108 | 0.45% | stocks | ||
| 2984 | 0.43% | companies | ||
| 2984 | 0.43% | consumer | ||
| 2984 | 0.43% | economy | ||
| 2859 | 0.41% | strong | ||
| 2859 | 0.41% | years | ||
| 2735 | 0.39% | S&P | ||
| 2735 | 0.39% | technology | ||
| 2611 | 0.38% | prices | ||
| 2362 | 0.34% | past | ||
| 2362 | 0.34% | portfolio | ||
| 2362 | 0.34% | value | ||
| 2238 | 0.32% | believe | ||
| 2238 | 0.32% | higher | ||
| Instances | Frequency | Word | ||
| 2113 | 0.30% | holdings | ||
| 1989 | 0.29% | opportunities | ||
| 1865 | 0.27% | current | ||
| 1865 | 0.27% | information | ||
| 1740 | 0.25% | fiscal | ||
| 1740 | 0.25% | fund’s | ||
| 1740 | 0.25% | industry | ||
| 1740 | 0.25% | long-term | ||
| 1740 | 0.25% | positive | ||
| 1616 | 0.23% | inflation | ||
| 1616 | 0.23% | period | ||
| 1492 | 0.21% | economic | ||
| 1492 | 0.21% | profit(s) | ||
| 1492 | 0.21% | new | ||
| 1492 | 0.21% | returns | ||
| 1492 | 0.21% | return | ||
| 1492 | 0.21% | services | ||
| 1367 | 0.20% | products | ||
| 1367 | 0.20% | returned | ||
| 1367 | 0.20% | shareholder | ||
| 1304 | 0.19% | loss(es) | ||
| 1243 | 0.18% | because | ||
| 1243 | 0.18% | business | ||
| 1243 | 0.18% | data | ||
| 1243 | 0.18% | earnings | ||
| 1243 | 0.18% | lower | ||
riod, fund managers make more frequent citations of the “market” as well as the “economy,” possibly for the self-serving purpose of projecting relatively less glorious performance on external factors. The causation word “because” makes two notable appearances among the 10 highest-frequency words in 2007 and 2008. This can possibly be attributed to the fund manager’s preference to “talk him/herself out” of explaining an undesirable investment outcomes by advancing more causal arguments.2 The word “index” is also cited more frequently
during the “bearish” years, for the likely reason of making relative performance comparisons.
The frequency of individual keywords across different categories is also worth investigating. In making pair-wise comparisons, I use the Mann- Whitney U test, a powerful, non-categorical, nonparametric test of between-subject differences, to find the differences between frequencies that are significant at the 5% level. Table 6 shows the frequencies of individual words on the consolidated 50 highest-frequency wordlist where there
Table 5. Corpus-linguistic features of fund manager investment narratives
| 2003 | 2004 | 2005 | 2006 | 2007 | 2008 | 2009 | |
| Total Words (tokens) | 594 | 552 | 636 | 679 | 729 | 795 | 860 |
| Distinct Words (types) | 2049 | 1833 | 2232 | 2370 | 2223 | 2202 | 2511 |
| Type/Token Ratio | 3.45 | 3.32 | 3.51 | 3.49 | 3.05 | 2.77 | 2.92 |
| Words per Sentence | 9.8 | 10.2 | 9.5 | 11.0 | 12.4 | 13.9 | 13.5 |
| Characters per Word | 5.7 | 6.4 | 6.1 | 7.0 | 6.9 | 7.9 | 7.6 |
| 10 Highest- Frequency Words | we fund performance growth year stock strong believe higher interest | we fund growth investment performance strong stocks market funds index | we fund performance strong growth investment believe market economy stock | fund we year performance strong growth funds higher stock market | fund we market index economy investment because performance value funds | fund we year market index economy sector value because investment | fund we market year economy funds index investment interest stock |
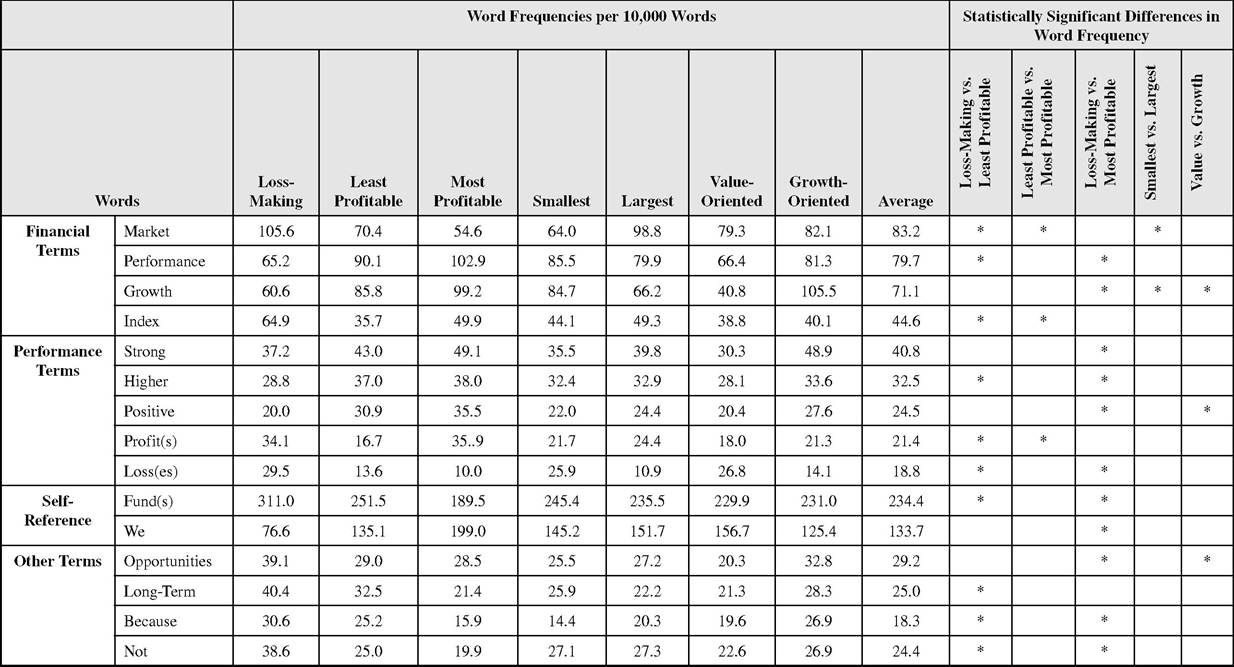
are significant differences in frequency among the seven groups of mutual funds. The wordfrequencies reported in Table 6 are averaged across the sample years and normalised based on a 10,000-word document.
With regards to financial terms, “market” is more frequently used among funds with negative absolute returns, and the least profitable funds in the positive return category. The same pattern holds for “economy.” Although no firm conclusion can be drawn from this observation, it seems to
suggest that fund managers, in aggregate, refer to the market and the economy as external performance detractors in a self-serving way, which is consistent with the anecdotal evidence based on close-reading mutual funds. The usage frequency of “index” yields a similar conclusion, i.e. fund managers tend to make benchmark comparisons more frequently when performance is in the negative domain, and in doing so they strategically shift the reader’s attention away from the fact that they have lost money by investing in the fund.
Table 6. Word-frequency analysis of positive and negative tone
| Words | Loss-Making | Least Profitable | Most Profitable | Average | Loss-Making vs. Least Profitable | Least Profitable vs. Most Profitable | Loss-Making vs. Most Profitable |
| Positive Words | 625.6 | 618.1 | 735.2 | 626.5 | * | * | |
| Negative Words | 251.0 | 260.5 | 187.8 | 255.4 | * | ||
| “Up” Words | 115.5 | 115.3 | 129.7 | 120.2 | * | ||
| “Down” Words | 52.8 | 51.0 | 37.5 | 45.7 | * |
In contrast, “performance” is used more often by the most profitable funds and less so by least profitable funds and loss-making funds. This can be due to the same self-serving attribution bias that leads fund managers to take ownership of favourable performance results. Not surprisingly, “growth” is used more frequently by growth- oriented funds, but also more so by most profitable funds. It is, however, difficult to attach significance to the latter, since “growth” may refer to a rise in assets as well as returns, both in the past fiscal year and the anticipated future.
Continuing on to performance terms, we can observe that the triad of “strong,” “higher” and “positive” is used more frequently by the most profitable funds. However, the least profitable funds, and even loss-making funds do not use these terms less frequently. This may be associated with the tendency of fund managers to report negative news in the false positive format (i.e. “the fund did not benefit from positive performance” instead of “our returns were negative”). In fact, the usage frequency of “not” is itself suggestive of the well-documented Pollyanna effect which can be defined as “the tendency to use evaluatively positive words more frequently and diversely than evaluatively negative words in communicating” (Boucher and Osgood, 1968). With regards to the usage of “profit(s)” and “loss(es),” the results are similar to Rutherford (2005). Loss-making funds refer to profits more frequently than to losses, and they even make more references to profits than least profitable funds, which provides further support for the Pollyanna hypothesis. I will test the Pollyanna hypothesis more robustly later in this section.
The use of self-reference terms in the commentaries is consistent with the pattern observed in the longitudinal study in Table 6. In other words, loss-making funds tend to use “fund” much more frequently than “we” while they begin to refer to themselves using a personal pronoun when performance improves. This is, of course, a clear manifestation of the self-serving attribution bias inherent, more or less, in all economic agents, and by extension, in professional investors.
Finally, some other terms in Table 6 merit attention. Loss-making fund managers, compared to their counterparts who have returned a profit, tend to talk more frequently about lost “opportunities” as well “opportunities” for growth in the future. The same applies to growth-oriented funds versus value-oriented funds. Loss-making funds managers also cite “long term” more frequently in comparison. Both of these observations may suggest the same strategy of focusing the reader’s attention on more positive messages. In addition, the word “because” is used more often in the negative domain, for the likely purpose of advancing causal arguments to justify sub-par performance.
I also use Henry (2008)'s list of positive and negative words to search for instances of positiv- ity/negativity in the study corpus using the same categories of funds in terms of performance, i.e., loss making, least profitable and most profitable. In addition, I explore two relevant categories, i.e., “up” words which generally connote growth or elevation and include “higher” “increase,” “increased,” “more,” “over” and “up”; and “down” words which include “decrease,” “decreased,” “lower,” “reduced” and “reduction.” The word frequencies are averaged across all the sample years and normalised for a document length of 10,000 words. The results are illustrated in Table 7.
The results reported in Table 7 suggest that positive words are more often used in fund manager commentaries than negative words (almost 2.4 times as much, which is slightly less than the 3 times proportion Rutherford (2005) found for corporate annual reports), which is another clear manifestation of the Pollyanna effect. This effect is stronger among loss-making funds compared to least profitable funds, i.e. the fund managers in the former group tend to use more positive words in order to “sugarcoat” the undesirable message they have to communicate to their clients in the commentaries. The results for “up” words and “down” words are similar.
co OO
Table 7. Word frequency analysis of investment narratives belonging to different fund categories
5. DISCUSSION
In this chapter, the dynamic relationship between the overconfidence of fund managers, the past performance of their funds and the tone of their investment narratives were studied. We observed that over optimism and self-reference are likely to be more representative indicators of overconfidence than certainty, possibly due to the fact that fund managers commonly write their reports in a resolute tone by normal practice. The word frequency analysis of investment narratives demonstrated that key differences exist in the tone and genre of fund manager commentaries whose corresponding funds have experienced varying degrees of past investment performance.
It is of course clear that fund managers do not operate in a context-free world. Holland (2009) identifies a number of important intangibles in the work environment of fund managers. These include:
1. “Increasing significance of knowledge intensive processes, assets or intangibles in creating value within the enterprise, and within its immediate network of corporate alliances, suppliers, distributors, and customers.
2. Increasing use of technology within these value creation processes.
3. Major changes in the corporate value creation process such that knowledge creation, articulation, processing and leveraging, has become a central survival activity for multinational companies.
4. Changes in corporate structure from top heavy, multi-layered managerial hierarchies to flat hierarchies, and to companies establishing alliance and networks with companies in the same industry and with suppliers and distributors.
5. Increased internationalization or globalization of companies and industries.
6. Radical changes in corporate strategy arising from the above forces.”
Further research can address a number of limitations in the content analysis process. Fundamentally, content analysis is based on the assumption that the language people choose to express themselves in contains information about the nature of their psychological states. A large body of literature on narrative analysis, both in psychology and more specifically in the area of accounting and finance, is built on this core assumption. The alternative assumption, however, is that environmental circumstances may shape verbal and written communication in a way that may render the underlying psychological states of individuals untraceable.
Firstly, a weakness of computer-assisted content analysis using the “bag-of-words” method is that word frequencies and word categories are relied on to imply intended meaning. This approach is of course not perfectly accurate, yet it is a compromise that allows researchers to analyse large amounts of textual data in a practical way. To circumvent associated problems, I have attempted to triangulate the results of computer-assisted analysis with manual coding and close-reading methodologies on random control samples of the annual reports.
Secondly, any content analysis program has to deal with the issue of homographs. While DICTION has a built-in feature that enables it to make context-dependent judgements on homographs, and therefore is superior to most other comparable packages, human coding can obviously lead to more accurate results.
Thirdly, DICTION makes use of pre-defined dictionaries, which may not always be perfectly tuned to specific research needs. The program also allows user-defined dictionaries that clearly increase flexibility. Although the current study has not taken advantage of this feature, this should not have contributed to any significant inaccuracy since almost all of the fund rankings and comparisons performed are within sample, and therefore such biases should have mostly cancelled out in the process.
Fourthly, for each of the content analysis variables, DICTION specifies thresholds and declares values exceeding those thresholds as “out of range,” assuming a normal distribution for the underlying scores. While this is a useful feature, researchers should examine the distribution normality of the content analysis scores beforehand (a step taken in this study). More importantly, DICTION thresholds are by definition static whereas, ideally, the researcher can improve the accuracy of the results by defining dynamic thresholds for time-series data depending on market environment and investor sentiment at any given observation date.
REFERENCES
Amernic, J., Craig, R., & Tourish, D. (2010). Measuring and assessing tone at the top using annual report CEO letters. Edinburgh, UK: The Institute of Chartered Accountants of Scotland.
Barber, B. M., & Odean, T. (2000). Trading is hazardous to your wealth: The common stock investment performance of individual investors. The Journal of Finance, 55, 773-806. doi:10.1111/0022-1082.00226
Barberis, N., & Thaler, R. H. (2003). Handbook of the economics of finance (Vol. 1B). Amsterdam: Elsevier B.V.
Carhart, M. M. (1997). On persistence in mutual fund performance. The Journal of Finance, (52): 57-82. doi:10.1111∕j.1540-6261.1997.tb03808.x
Chen, H., Jegadeesh, N., & Wermers, R. (2000). The value of active mutual fund management: An examination of the stockholdings and trades of fund managers. Journal of Financial and Quanti ta- tive Analysis, 35, 343-368. doi:10.2307/2676208 Choi, D., & Lou, D. (2010). A test of the selfserving attribution bias: Evidence from mutual funds. Yale SOM Working Paper.
Chow, E., Lin, Y., Lin, H., & Weng, Y. (2009). The performance of overconfident fund managers. Working Paper.
Courtis, J. K. (2004). Corporate report obfuscation: Artefact or phenomenon? The British Accounting Review, 36, 291-312. doi:10.1016/j. bar.2004.03.005
Cremers, M., & Petajisto, A. (2009). How active is your fund manager? A new measure that predicts performance. Review of Financial Studies, 22(9), 3329-3365. doi:10.1093/rfs/hhp057
Daniel, K., Hirshleifer, D., & Subrahmanyam, A. (1998). Investor psychology and security market under- and overreactions. The Journal of Finance, 53, 1839-1885. doi:10.1111/0022-1082.00077
Demers, E., & Vega, C. (2010). Soft information in earnings announcements: News or noise? (INSEAD Working Paper No. 2010/33/AC). INSEAD.
Eshraghi, A. (2012). Professional investors, psychology and performance. (Published PhD Dissertation). LAP Lambert.
Fairclough, N., & Holes, C. (1995). Critical discourse analysis: The critical study of language. Harlow, UK: Longman.
Garcia, D., Sangiorgi, F., & Urosevic, B. (2007). Overconfidence and market efficiency with heterogeneous agents. Economic Theory, 30, 313-336. doi:10.1007/s00199-005-0048-4
Gervais, S., Heaton, J. B., & Odean, T. (2011). Overconfidence, compensation contracts, and capital budgeting. The Journal of Finance. doi:10.1111/j.1540-6261.2011.01686.x
Gervais, S., & Odean, T. (2001). Learning to be overconfident. Review of Financial Studies, 14, 1-27. doi:10.1093/rfs/14.1.1
Glaser, M., Noth, M., & Weber, M. (2007). Behavioral finance. In D. J. Koehler, & N. Harvey (Eds.), Blackwell handbook of judgment and decision making (pp. 527-546). Hoboken, NJ: Wiley-Blackwell.
Gort, C., Wang, M., & Siegrist, M. (2008). Are pension fund managers overconfident? Journal of Behavioral Finance, 9, 163-170. doi:10.1080/15427560802341616
Hines, R. D. (1988). Financial accounting: In communicating reality, we construct reality. Accounting, Organizations and Society, 13, 251-261. doi:10.1016/0361-3682(88)90003-7
Hirschleifer, D. (2001). Investor psychology and asset pricing. The Journal of Finance, 56, 1533-1598. doi:10.1111/0022-1082.00379
Hoechle, D., Schmid, M., & Zimmerman, H. (2009). A generalization of the calendar time portfolio approach and the performance of private investors. SSRN eLibrary.
Hoffrage, U. (2004). Overconfidence. In R. F. Pohl (Ed.), Cognitive illusions: A handbook on fallacies and biases in thinking, judgment and memory (pp. 235-254). London, UK: Psychology Press.
Holland, J. (2009). Looking behind the veil: Invisible corporate intangibles, stories, structure and the contextual information content of disclosures.
Qualitative Research in Financial Markets, 1, 152-187. doi:10.1108/17554170910997410
Malmendier, U., & Tate, G. (2005). CEO overconfidence and corporate investment. The Journal of Finance, 60, 2661-2770. doi:10.1111/j.1540- 6261.2005.00813.x
Malmendier, U., & Tate, G. (2008). Who makes acquisitions? CEO overconfidence and the market’s reaction. Journal of Financial Economics, 89, 20-43. doi:10.1016/j.jfineco.2007.07.002 Malmendier, U., Tate, G., & Yan, J. (2011). Overconfidence and early-life experiences: The impact of managerial traits on corporate financial policies. The Journal of Finance. doi:10.1111/j.1540- 6261.2011.01685.x
Moore, D. A., & Healy, P. J. (2008). The trouble with overconfidence. Psychological Review, 115, 502-517. doi:10.1037/0033-295X. 115.2.502 PMID:18426301
Odean, T. (1999). Do investors trade too much? The American Economic Review, 89, 1279-1298. doi:10.1257/aer.89.5.1279
Plous, S. (1993). The psychology of judgment and decision making. New York, NY: McGraw-Hill.
Puetz, A., & Ruenzi, S. (2011). Overconfidence among professional investors: Evidence from mutual fund managers. Journal of Business Finance & Accounting, 38, 684-712. doi:10.1111/j.1468- 5957.2010.02237.x
Stanton, P., & Stanton, J. (2002). Corporate annual reports, research perspectives used. Accounting, Auditing & Accountability Journal, 15, 478-500. doi:10.1108/09513570210440568
Statman, M., Thorley, S., & Vorkink, K. (2006). Investor overconfidence and trading volume. Review of Financial Studies, 19, 1531-1565. doi:10.1093/rfs/hhj032
Taffler, R. J., & Tuckett, D. A. (2010). Emotional finance: The role of the unconscious in financial decisions. In Behavioral finance: Investors, corporations, and markets. Hoboken, NJ: John Wiley and Sons, Inc. doi:10.1002/9781118258415.ch6
Thomas, J. (1997). Discourse in the marketplace: The making of meaning in annual reports. Journal of Business Communication, 34, 44-66. doi:10.1177/002194369703400103
Van den Steen, E. (2002). Skill or luck? Biases of rational agents. MITSloan School ofManagement Working Paper, 4255-02.
Willis, R. H. (2001). Mutual fund manager forecasting behavior. Journal of Accounting Research, 39, 707-725. doi:10.1111/1475-679X.00035
KEY TERMS AND DEFINITIONS
Content Analysis: A social sciences methodology for studying the content of (mostly written) communication.
Decision Making: The process of selecting of a course of action among several alternatives.
Fund Manager: A person responsible for implementing a fund’s investing strategy and managing its asset portfolio.
Investor Psychology: The study of investor mind and behavior.
Overconfidence: The attribute of having greater certainty than circumstances warrant.
ENDNOTES
1 Fund managers often tend to refer to their own fund under management in singular format and the competition or the industry in plural. Hence, instances of the word “funds” are not considered in calculating this ratio.
2 Li (2008) demonstrates that a higher frequency of causation words (such as “because”) in the Management Discussion and Analysis of corporate annual reports is associated with less persistent earnings.
This work was previously published in Communication and Language Analysis in the Corporate World, edited by Roderick P. Hart, pages 1-20, copyright 2014 by Information Science Reference (an imprint of IGI Global).
886