Chapter 48 Modern Risk Management Techniques in Banking Sector
Okan Acar Banker, Turkey
Asli Beyhan Acar
Istanbul University, Turkey
ABSTRACT
Risk management as a very rapid emerging subject has been affected by several happenings in the world.
There are many studies covering risk definition, risk types, and risk management, plus there are many contemporary approaches in order to calculate the risk incurred by the companies due to their transactions. In the modern business life, since the transactions have become very fast and their risk exposure increases, the companies, especially the financial institutions, started to use new techniques to measure the probable effects of the risks that they have taken while undertaking the transactions. In this chapter, the authors show two techniques as the contemporary approaches to risk management. These are operations research and statistics. They know that these two concepts are very detailed and sophisticated tools, which require software for better results. The banks have been investing in these solutions, and they are designing new organizations to handle these issues. Thus, the authors introduce these techniques very briefly with using some banking practices for better understanding.INTRODUCTION
The Chinese word for “crisis” represents “danger” and “opportunity,” which shows “risk” and “gain” are sisters.
As the entire world becomes more united and many countries began to be the part of international trade, they have enacted many laws in order to sustain the continuity of these transactions. They have agreed on the financial deregulations
which are the main milestone to open the local country for international transactions by allowing imports and exports. These happenings were firstly welcomed by the local people since the imported goods more easily provided and the public was benefiting from the competition due to the different brands in the same sector.
This is the main advantage of financial deregulations and open market transactions.DOI: 10.4018/978-1-4666-6268-1.ch048
.
However, as the transactions become more fast, they became also uncontrollable. Due to this uncontrollable structure of the transactions, many speculators have invested into many emerging markets in order to benefit from the high interest gain. For instance US investors have converted their local currency to emerging countries’ currencies in order to buy their currencies which have a yield of 50-100% in the mid-1990s. This led to unbelievable profits which were impossible to be earned in US in one year period.
Not only the foreign investors but also the local individuals and also the banks have done the same in order to reach big profits. However, since the type of these investments were portfolio investments rather than direct investments such as real estate or project investments which reduce unemployment, they have not added value in the financial strength of the country. Thus, they did not increase the welfare of the public in that country. For example, the unemployment was very volatile and has not decreased to the accepted rates; the GDP per person has not reached the developed countries’ figures. These were the frequent sayings against financial deregulations and globalization. However, after any bad happening about the political or economic structure of the country it was seen that the portfolio investments have left the country. This shows that these funds may cause may financial disability if they are not ruled or managed in a clear way.
Therefore, many emerging countries like Argentina, Mexico, Brazil, Turkey etc. have entered into crises environments. This showed that the reserves of the central banks were not enough and the financial strengths of the local banks were not able to satisfy the needs of these portfolio investors. Furthermore, the banking sectors of many emerging markets had entered into a very tough competition which brings the financial weaknesses.
The financial weaknesses of the banks were stemming from two main causes; insufficient liquidity and capital. This was the result of the aggressive growth strategies of the banks by ignoring risk management.As it is mentioned in the below paragraphs, the need for risk management has been understood after the crises happened in several emerging countries. Therefore these countries started to pay more attention to risk management and they have implemented new techniques in order to prevent big losses of especially banking sector. They have realized that if banking sector goes under financial distress not only financial sector but also many sectors have been badly affected from these happenings. This put stress on the financial regulators of different countries to implement new acts and regulations involving different and modern risk management techniques to be imposed on the banks and other financial sector actors.
In this chapter we will try to show what these techniques are and how these techniques can be used by the banks. However before going forward that stage we need to show what risk is and how risk management should be defined in banking sector. Afterwards, we will be dealing with the risk types imposed on banking sector. The risk types will be purchase power risk, interest rate risk, market risk, politic risk, FX risk, liquidity risk, credit risk, operational risk, financial risk, management risk and company and industry risk. In order to manage risk by mitigating it, there would be several business tools relying on operations research and statistics. The definitions, theory and examples of these techniques will be clearly explained throughout the chapter.
WHAT IS RISK AND RISK MANAGEMENT?
Before going forward into the deep details of this study, we should define what risk is and what the usage of risk management is. Since we are living in a very complex world with a wide variety of transactions, we need more sophisticated decision making tools than before.
Since the variety of transactions increase rapidly the outcomes of the decisions vary accordingly. Each decision may lead to different outcome which may contain undeserved consequences. These undeserved consequences are defined as risk. If we define risk in a very brief way, we can use the following definition (Arnoldi, 2009);Risk is the potential danger.
If we make the definition wider, we would say;
Risk is the possibility of something bad happening or to do something although there is a chance of a bad result.
For example, if a bank lends a credit facility to a customer, in case of no repayment, this bank is risking the amount lent. The bank is monitoring the customer payment behaviors until the payment comes; this amount is seen as the risk of the bank.
As it is shown at the beginning of the chapter and in Figure 1, the Chinese character (pronounced “Wei Ji”), like many Chinese characters, is composed of two individual characters, each one with a different meaning. The first character means “danger” and the second means “opportunity.” When combined, they mean “crisis.” The word “crisis” is commonly associated with “a situation that has reached an extremely difficult or dangerous point” with special attention paid to the element of danger in the situation. However, a key sense of the word crisis is that it refers to a “turning point for better or worse.” To better understand the relationship between “Wei Ji,” it will help to substitute “risk” for “danger” and “return” for “opportunity” to relate the concepts more closely to finance. This shows that risk and return are sisters and you cannot avoid one of them to have the other.
What we generally know about risk are:
• We are all confronted with risks in the contemporary social or business life.
• Risk cannot be totally avoided.
• Risk should be welcomed or taken into consideration in order to be a candidate for gains.
• Each decision includes risk of not taking other decisions.
This shows that risk is not only a financial subject but also a very strong social issue which is very important of each and every individual’s or institution’s life.
After, we have given the definition of risk; we need to say that risk should be controlled by somehow in order to project the happenings in the future. This, statement leads us to another concept which is “risk management.”
For many social analysts, politicians, and academics risk management is the management of environmental and nuclear risks that appear to threaten our existence. For the bankers and financial officers it is the sophisticated use of techniques like currency hedging, interest rate swaps, credit repayments etc. For the insurance buyers and sellers it is coordination of insurable risks and the reduction of insurance costs.
If we make a general definition without considering its functions we can say that (Gallati, 2003).
Risk management is the process of protecting an organization from potential asset or income loss.
Figure 1. Chinese word for crisis

The procedure of the related subject can be illustrated as follows. As it is shown in Figure 2, the company should use each and every opportunity of improving the existing risk management of the organization. This is due to the change happening around the company and among the business life. Furthermore, if we discuss the main phases of risk management we need to talk about:
• Establishing the context.
• Identification of risks.
• Analysis of risks.
• Evaluation of the risks and their probable consequences.
• Treating the risk.
This is a closed loop and surely repeated continuously (The University of Newcastle Australia, 2013).
There has been evolved a new and emerging subject called Enterprise risk management (ERM) which brings new approach to risk management. We know that enterprise risk can include a variety of factors with potential impact on an organizations activities, processes and resources. External factors can result from economic change, financial market developments and dangers arising in political, legal, technological and demographic environments (Olson, 2008).These all combined factors constitute the enterprise risk management’s approach.
The main differences between traditional risk management and ERM are depicted in Table 1.
TYPES OF RISKS
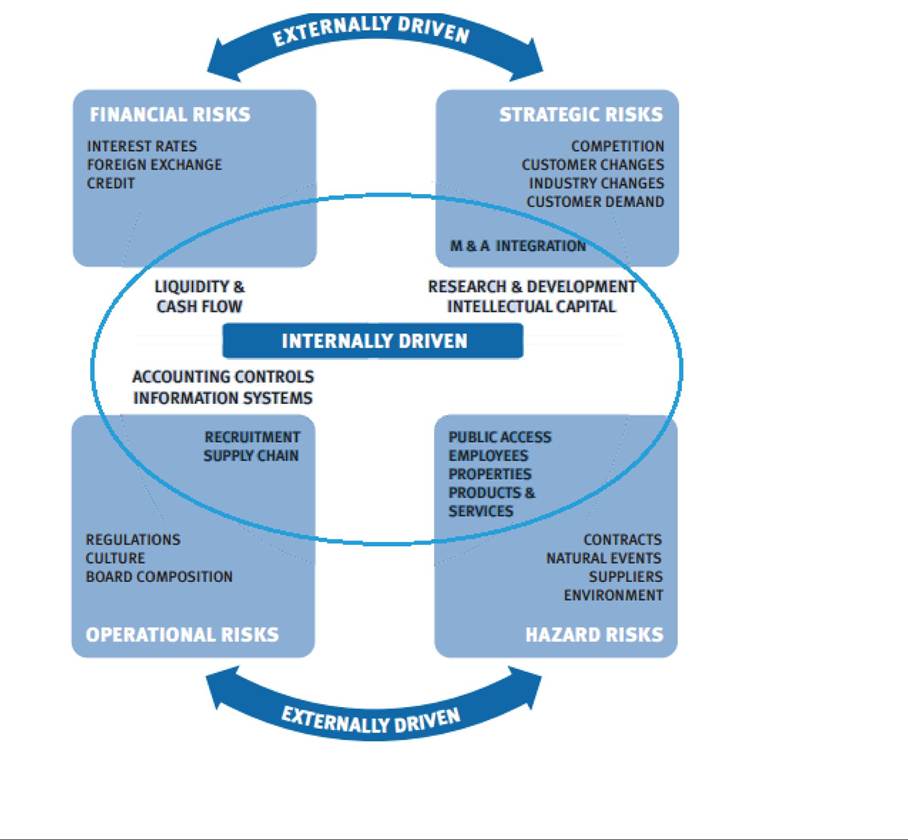
The risks facing an organization and its operations can result from factors both external and internal to the organization. According to Federation of European Risk Management Associations (FERMA) Figure 3 summarizes examples of key risks in these areas and shows that some specific risks can have both external and internal drivers and therefore overlap the two areas. They can be categorized further into types of risk such
Figure 2. Risk management
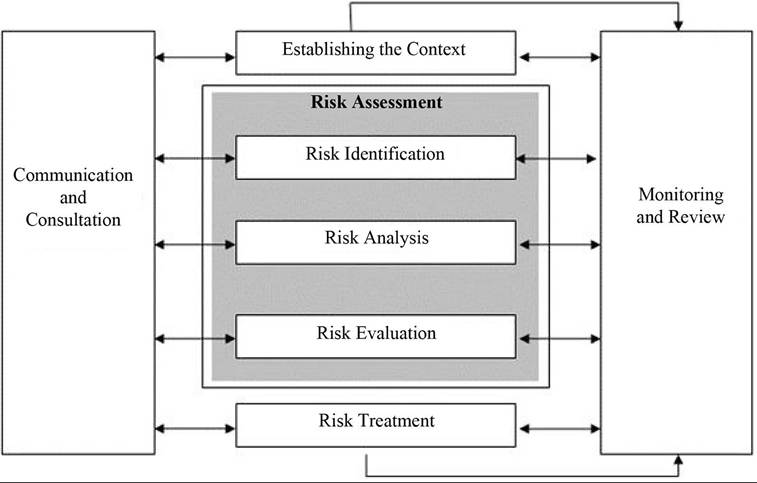
Table 1. Differences between traditional risk management and ERM
| Traditional Risk Management | ERM |
| Risk as individual hazards | Risk viewed in the context of business strategy |
| Risk identification and assessment | Risk portfolio development |
| Focus on discrete risks | Focus on critical risks |
| Risk mitigation | Risk optimization |
| Risk limits | Risk strategy |
| Risk with no owners | Defined risk responsibilities |
| Haphazard risk quantification | Monitoring and measurement of risks |
Source: Olson & Wu (ibid)
as strategic, financial, operational, hazard, etc. (FERMA, 2013).
Before going more detail, we can talk on two main types of risks (Megginson, 2008):
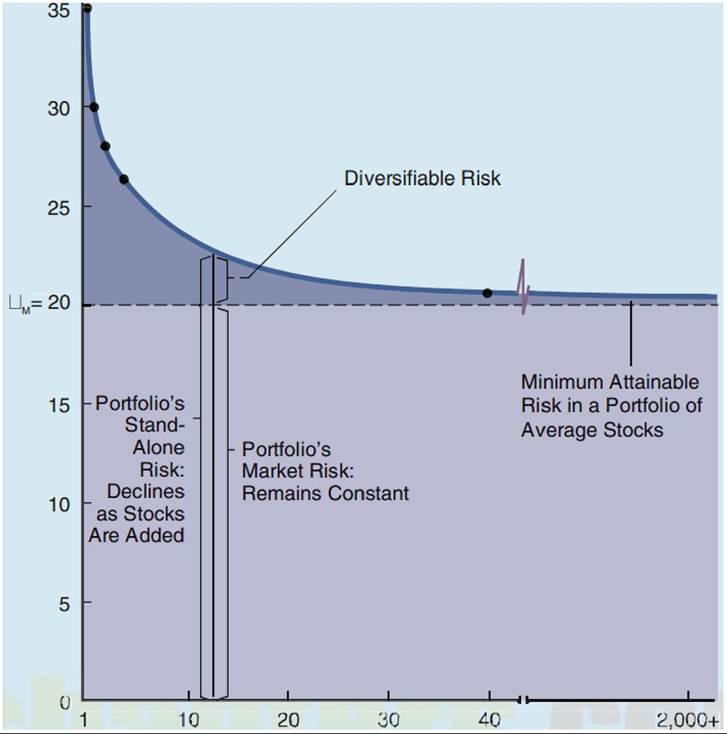
• Systematic Risk: This is the uncontrollable risk which is originated from the market conditions. This risk can be named as market risk and it has an effect on all investments in that market. This risk is an externally driven risk which cannot be mitigated through diversification.
• Unsystematic Risk: The risk of the investment itself is defined as the unsystematic
Figure 3. Type of risks
risk. This is driven by internal factors and can be mitigated through diversification. The diversifiable risk is depicted as per Figure 4.
After defining the systematic and unsystematic risks we should go forward to define the types of the risks standing under these risks. Under unsystematic risks we have management, industry, liquidity, credit and operational risks. However, the last three can be also categorized under systematic risks as per some other financial books.
Management Risk: This is the risks associated with ineffective, destructive or underperforming management, which hurts shareholders and the company or fund being managed.
Industry Risk: This is the chance that a set of factors particular to an industry group drags down the industry’s overall performance. For example a tax increase in the automobile industry may adversely affect the profits of the automobile producers due to the sharp decline in the sales volume (Maheshwari, 2008).
Figure 4. Systematic and unsystematic risks
• Liquidity Risk: Liquidity is generally defined as the ability of a financial firm to meet its debt obligations without incurring unacceptably large losses. An example is a firm preferring to repay its outstanding one-month commercial paper obligations by issuing new commercial paper instead of by selling assets. Thus, “liquidity risk” is the risk that a firm will not be able to meet its current and future cash flow and collateral needs, both expected and unexpected, without materially affecting its daily operations or overall financial condition. Financial firms are especially sensitive to funding liquidity risk since debt maturity transformation (for example, funding longer-term loans or asset purchases with shorter-term deposits or debt obligations) is one of their key business areas (Federal Reserve Bank of San Francisco, 2013).
• Default or Credit Risk: Credit risk is most simply defined as the potential that a bank borrower or counterparty will fail to meet its obligations in accordance with agreed terms. The goal of credit risk management is to maximize a bank’s risk-adjusted rate of return by maintaining credit risk exposure within acceptable parameters. Banks need to manage the credit risk inherent in the entire portfolio as well as the risk in individual credits or transactions. Banks should also consider the relationships between credit risk and other risks. The effective management of credit risk is a critical component of a comprehensive approach to risk management and essential to the long-term success of any banking organization(Basel Committee of Banking Supervision, 1999).
We can say that when a credit is utilized, since there is a potential threat of default of the capital and the interest/profit, each credit amount is named as risk. This type of risk can be also named as customer risk or default risk. In order to reduce the risk, the banks are demanding down payments or placing pledges on the tangible assets.
• Operational Risk: Operational risk is “the risk of direct or indirect loss resulting from inadequate or failed internal processes, people and systems or from external events.”(Basel Committee of Banking Supervision, 1999: 4) The most important types of operational risk involve breakdowns in internal controls and corporate governance. Such breakdowns can lead to financial losses through error, fraud, or failure to perform in a timely manner or cause the interests of the bank to be compromised in some other way, for example, by its dealers, lending officers or other staff exceeding their authority or conducting business in an unethical or risky manner. Other aspects of operational risk include major failure of information technology systems or events such as major fires or other disasters (Basel Committee of Banking Supervision, 1999).
The systematic risks are as follows:
• Market Risk: In most of the financial literature market risk and systematic risk is used instead of each other. Market risk is the possibility that financial markets will drop in value and create a ripple effect in one’s investment. Market risk arises because market prices in general move up and down consistently for some time. There are many market related risks that a company should try to manage or mitigate during risk management (Maheshwari, 2008). These are depicted as follows.
• Interest Rate Risk: This risk arises for the holder of an interest bearing position. This is the exposure of a bank’s financial condition to adverse movements in interest
rates. Accepting this risk is a normal part of banking and can be an important source of profitability and shareholder value. However, excessive interest rate risk can pose a significant threat to a bank’s earnings and capital base. Changes in interest rates affect a bank’s earnings by changing its net interest income and the level of other interestsensitive income and operating expenses. Changes in interest rates also affect the underlying value of the bank’s assets, liabilities and off-balance sheet instruments because the present value of future cash flows (and in some cases, the cash flows themselves) change when interest rates change. Accordingly, an effective risk management process that maintains interest rate risk within prudent levels is essential to the safety and soundness of banks (Basel Committee on Banking Supervision, 1997).
Currency (FX) Risk: It is the risk that arises from the possible movements in the value of the foreign currencies. It arises from three different environments (Jorion, 2003);currency float in which the external value of the currency is free to move, to depreciate or appreciate; fixed currency system in which the external value of the currency is fixed to another currency and the changes in the currency regime in which the movements from pegged to floating or vice versa, affects the value of the currency. Political Risk: With increasing interaction of the world’s markets, political climates around the world can affect the value of domestic and international investments. A period of instability may decrease the value of the investments and a stability period may increase the wealth of people by increasing the value of the investments (Maheshwari, 2008).Other than stability and instability there might be the risks related to the political regime followed by the rulers of the country. The political risks arises when the rulers choose the following paths:
Nationalization.
Partial nationalization.
Limitation of the activities.
Limitation on the acquisitions and mergers.
Uncertainties in the laws (especially in tax laws.)
These risks are all called as political risks.
Equity Risk: This risk arises for the holder of an equity position. An example of this risk is a bank that has purchased shares/ equities in a company. A loss arises when the share/equity is fixed at a lower market value.
Commodity Value Risk: This risk that arises for the holder of a commodity position. An example of commodity risk is a bank that has purchased gold. A loss for the bank arises when the price of gold is fixed at a lower level in the commodities markets.
Settlement and Counterparty Risk: It is the risk that arises on transactions in interest rates, currency, equities or commodities that have not yet been settled. An example is a bank that has purchased a share from another bank that is not the issuer of the share, but which has to deliver the share to the purchaser against payment. A loss arises for either party in the transaction if settlement does not occur.
Purchase Power Risk: This risk is related to the inflation in a country. If the inflation which is defined as the continuous increases in the overall prices in an economy, is higher than the average income increase.
MODERN RISK MANAGEMENT TECHNIQUES
After defining risk, risk management and the types of risk we now will try to explain what the modern risk management techniques are and how they are used to forecast the possible outcomes of different transactions.
As we already know, the decision making under risk has drawn much attention in many different social sciences, especially in economics and management. In economics, the microeconomic problem concerning consumers and firms under the uncertainty circumstance must be solved on the basis of the theory of the decision making under risk. Moreover, in management, modeling the decision making under risk is a key problem of the risk management and decision science.
The first technique that is applied under uncertain and risky situation is Operations Research. This is an interdisciplinary branch of mathematics (especially applied mathematics) used to provide a scientific base for management to take timely and effective decisions to their problems. It tries to avoid undesired consequences from taking decisions merely by guessing or by using thumb rules (Operations Research Society of America, 1987). It uses methods like mathematical modeling, statistics, and algorithms to arrive at optimal or good decisions in complex problems which are concerned with optimizing the maxima (profit, faster assembly line, greater crop yield, higher bandwidth, etc.) or minima (cost loss, lowering of risk, etc) of some objective function.
As it is seen from the definition, the related technique is mainly used for optimizing the decision making. This will decrease the uncertainty and of course mitigate the risk. Nevertheless, although this technique is useful for reducing the risk, since the computations are mainly dependent on the previous data or personal experiences, this doesn’t mean that the risk is totally avoided.
The second one is Statistics, Statistics is the study of how to collect, organize, analyze and interpret numerical information from data. Descriptive statistics involves methods of organizing, picturing and summarizing information from data. Inferential statistics involves methods of using information from a sample to draw conclusions about the population.
One of the main concepts of statistics is standard deviation. This is the main item that is being used in the calculation of risk. Moreover, risk is defined as the standard deviation of the average real annual returns (Siegel, 2002). Therefore, if the standard deviation of A type financial instrument is more than B type financial instrument, it is said that A type is more riskier than the B type.
Operations Research
As it is seen from the definition made a few paragraphs ago, the related technique is mainly used for optimizing the decision making. This will decrease the uncertainty and of course mitigate the risk. Nevertheless, although this technique is useful for reducing the risk, since the computations are mainly dependent on the previous data or personal experiences, this doesn’t mean that the risk is totally avoided.
Decisions that lend themselves to display in a decision table also lend them to display in a decision tree. The decision tree is a graphical display of the decisions process that indicates decision alternatives and their respective probabilities and pay offs for each combination of alternative(Shah & Gor, 2007). The decision tree classifier is one of the possible approaches to multi-stage decision making. The basic idea involved in any multi-stage approach is to break up a complex decision into a union of several simpler decisions. This is done by a decision tree in which each internal node denotes a test on an attribute; each branch represents an outcome of the test (Han & Kamber, 2001).
Figure 5. A decision tree
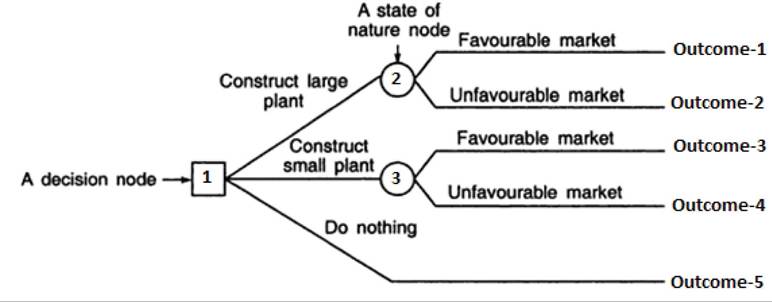
Figure 5 shows a basic decision tree.
The circular nodes which are also called as state of nature node show uncertain conditions where square nodes which are called as decision nodes represent the decision making activity under certain conditions. Therefore, the nodes; 2 and 3 stand for uncertain events where 1 stands for certain conditions.
For business, this technique is mainly dealing with the calculation of expected utility or expected monetary value of the project. The formulas are depicted as follows (Taha, 1997). 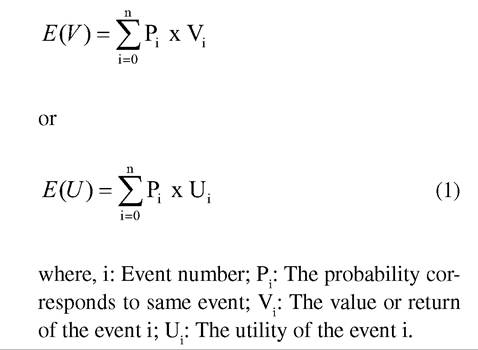
Box 1
Halech Bank is a multinational commercial bank that mainly operates in corporate, small business, retail, investment and VIP banking. The stakeholders are putting 1 million USD equity to be used in banking channels which is expected to bring about 2.5% (risk free return) return in one year time period. If the bank utilizes this amount to the existing banking channels the probability of default would be 2%, 5%, 3%, 1.5% and 1% for corporate, small business, retail, investment and VIP banking respectively. The returns would be 12%, 17%, 15%, 10% and 8% for corporate, small business, retail, investment and VIP banking respectively. The utilizations would be made evenly across all banking channels. Other than investing into the bank for utilizing as loans, the stakeholders and the management are in different between buying a new bank in MENA region which would generate 10% return with a probability of 40%, 8% with a probability of 30% and 12% with a possibility of 20%. The bank management is in different between these decisions and opts for to make the decision with decision trees. The management has drawn a decision tree as depicted in Figure 6.
Figure 6. Halech Bank decision tree
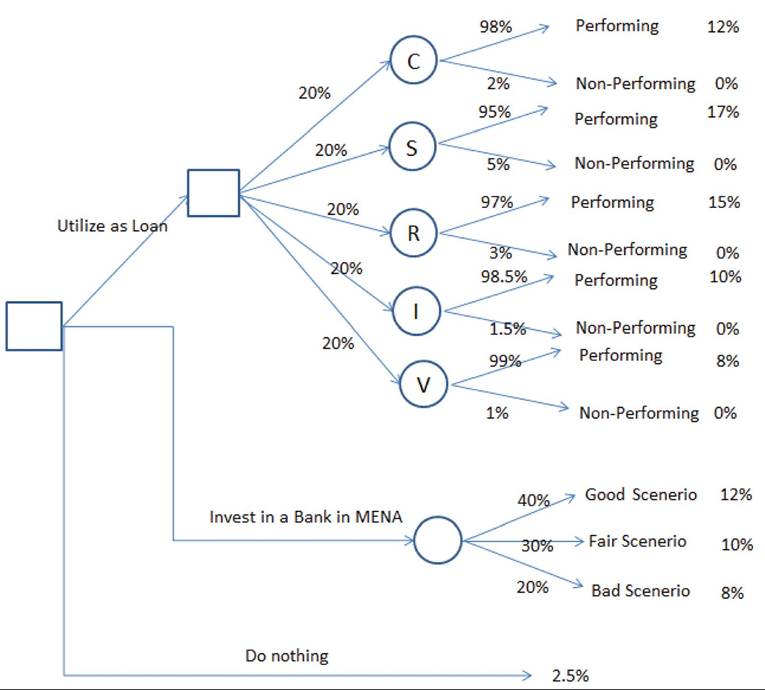
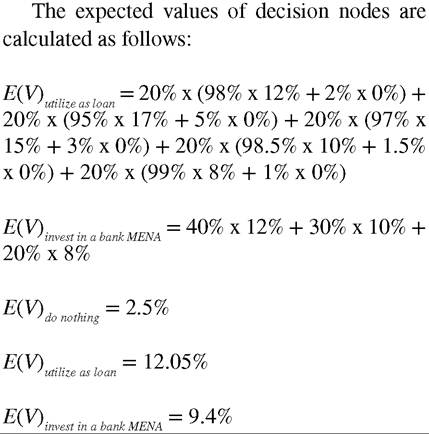
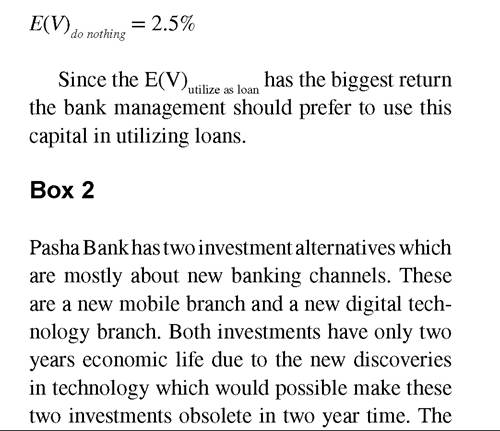
Table 2. Pasha Bank channel alternatives
| Mobile Branch | Digital Branch | |
| Economic Life | 2 years | 2 years |
| Investment cost | USD 1 million | USD 750 thousand |
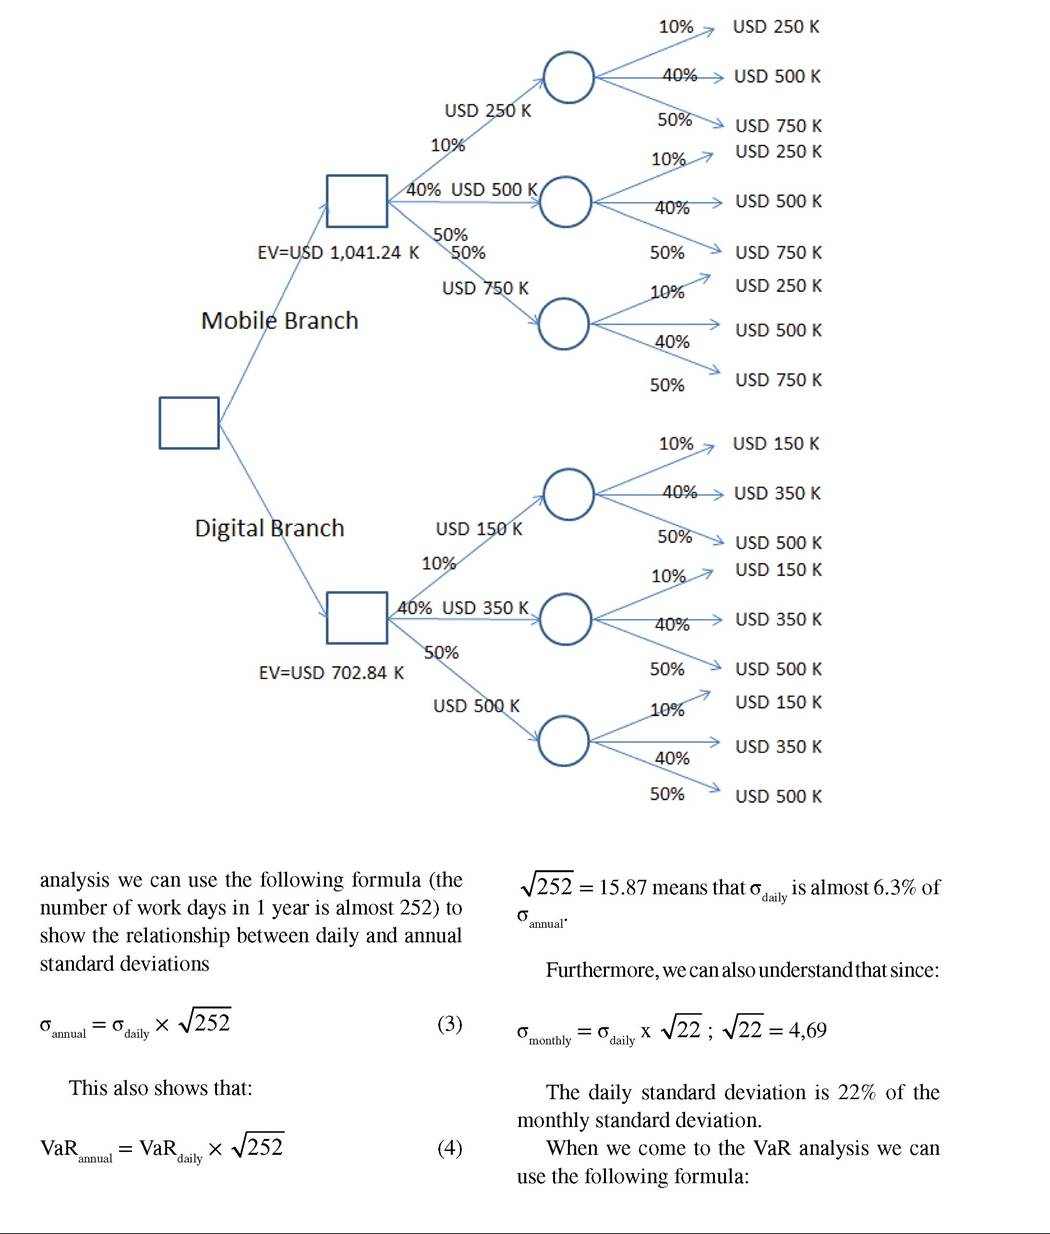
| Expected Cash Flows/Year | USD 250 thousand 10% probability | USD 150 thousand 10% probability |
| USD 500 thousand 40% probability | USD 350 thousand 40% probability | |
| USD 750 thousand 50% probability | USD 500 thousand 50% probabiity |
expected rate of return is 10% p.a. and the details of the investment are depicted as per Table 2.
They need to see the NPV (net present value)1 of each investment on a decision tree
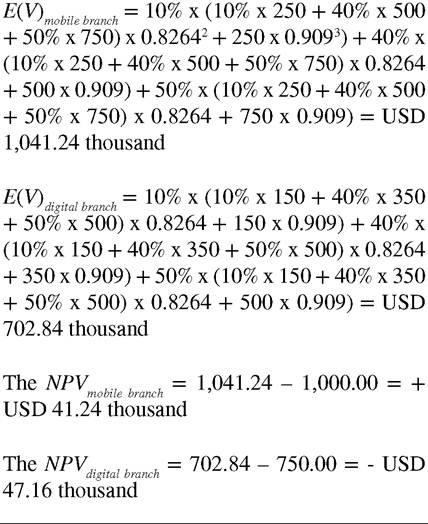
Mobile branch is the most feasible alternative.
To sum up, when we come to risk management, it is for sure that these decision trees will mitigate the risk incurred. This is because it is helping to decrease the uncertainty. The managers are more aware of what will happen in the future by considering the previous information on the probability of the different and possible outcomes.
Statistics
In risk management, statistics have been widely used in order to understand and mitigate risk. There are various applications of statistics in risk management but most of them are based on the variation of the assets’ prices. Therefore the term variance and standard deviation are commonly used in this area. Standard deviation is the square root of variance and the formula is depicted as follows (Spiegel & Lindstrom, 2000):

where; σ represents standard deviation; Xj represents jth datum in the population; X represents the average of all data in the population; and N represents the number of data in the population.
In this chapter we will show how the bank management uses statistics and of course standard deviation and variance to understand the possibili - ties of different scenarios which are probable to happen in the future.
The first major technique is called as VaR (value at risk). VaR is a statistical concept which shows the maximum loss that an institution can be confident it would lose on a portfolio of assets due to normal market movements (Penza, Bansal, 2001). As it is in the definition, VaR analysis is a powerful analysis to manage market risk. In order to compute the standard deviation for VaR
Figure 7. Pasha Bank decision tree
VaR = The market value of the financial position x Volatility
Volatility = σ x Z score of an accepted confident interval
This financial position can be anything including FX, stocks, commodities etc. Therefore, any position held by the bank can be analyzed using this method of statistics.
If we go deep into the detail we can convert the formula to the following formulas:
VaR = The market value of the foreign currency position x Volatility in FX
VaR = The market value of the stock position x Volatility in Index
VaR = The market value of the bond x Volatility in bond return
We will show it in a banking sector scenario as follows.
Box 3
Canaria Bank which is a Spanish Bank has a long position of USD 12.5 million, the bank wants to see how the VaR would be in one year time for this long position. The board of directors hates speculation so they have always demanded square position from the bank management. The bank management tries to show that the annual VaR is not so big to be scared. They have hired a consultancy firm and they wanted them to calculate the VaR of this position in one year time. The calculations of the firm are as follows:
They have taken the last 20 working days USD exchange rates against Euro (EUR1 = USD 1,30..) which is shown in Table 3.
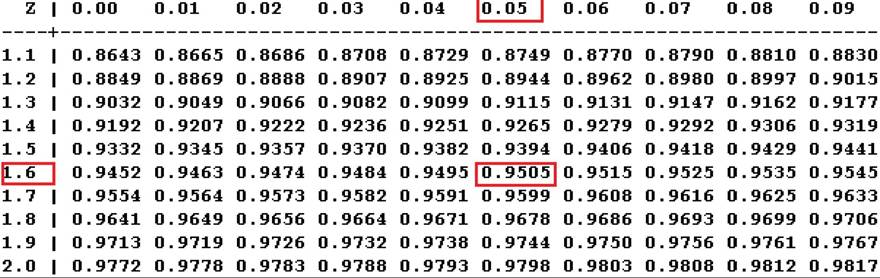
The standard deviation is calculated as 1.06% as per the formula (2). They have used a confident interval of 95% which corresponds to 1.65 as Z score (shown in Table 4).
VaR = The market value of the foreign currency position x Volatility in FX.
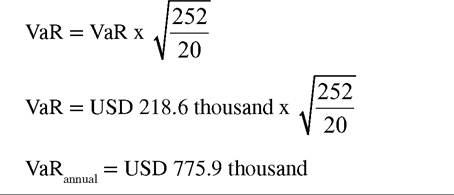
VaR= USD 12.5 million x 1.06% x 1.65.
VaR = USD 218.6 thousand.
But this is calculated for only 20 working days. Therefore we need to convert it to 252 working days which is almost 1 year.
As per Formula (3)
Other than VaR Analysis, there are many other methods can be used in banking based on statistics. We will introduce one other technique related to statistics in order to show how banking industry is so close to statistic applications. As we all know that like any other company, the banks are making financial planning and budgeting before the beginning of the New Year. Their main purpose is to find out how much profit to be earned in the
Table 3. USD vs Euro exchange rates
| Dates | Exchange Rate | Dates | Exchange Rate |
| 29-Apr | 1.3018 | 14-May | 1.2970 |
| 30-Apr | 1.3090 | 15-May | 1.2987 |
| 2-May | 1.3075 | 16-May | 1.2887 |
| 3-May | 1.3167 | 17-May | 1.2874 |
| 6-May | 1.3109 | 20-May | 1.2864 |
| 7-May | 1.3107 | 21-May | 1.2863 |
| 8-May | 1.3099 | 22-May | 1.2871 |
| 9-May | 1.3125 | 23-May | 1.2932 |
| 10-May | 1.3145 | 24-May | 1.2882 |
| 13-May | 1.3007 | 27-May | 1.2961 |
Table 4. Z Table
coming year having last 4-5 years trend in hand. This analysis of course is made with sophistical analyses with very detailed calculations and having many other factors affecting the bank’s performance. Here, we will only show a very basic example to understand how regression analysis is used to estimate the coming year’s performance with the last 5 years data.
Regression analysis is a very common and widely used analysis which is used in a very wide scope of business decisions. This analysis is the study of the data in which a relationship between data sets has been analyzed. There are independent variable(s) which are represented by xιwhich are assumed that they have direct impact on the dependent variable called “y” (Sen, Srivastava, 1990). The regression model has the following formula.  where; Y represents the dependent variable, X represents the independent variable.
Box 4
Tarabia Bank management and the stockholders have a conflict on the coming years profit budget. The management as the operations side knows that the coming year’s profit would not be as much as the stockholders are expecting. The stockholders are thinking that they have invested in this bank 10 years ago and this is the time to see sufficient returns after a decade time. Therefore, they have agreed on hiring a consultancy agency to make a feasible but efficient budget for the bank for the coming year.
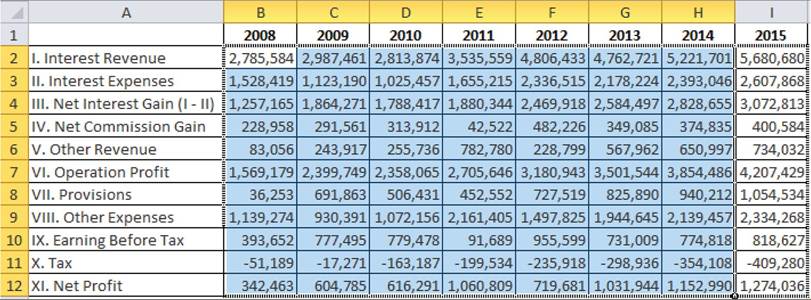
The firm has suggested using the last 5 years figures in order to understand the following year’s performances. They have also suggested regression analysis which is a very powerful technique of statistics. They have investigated the results of the last five years in detail and they have decided to use income statements of the last five years (Table 5) to forecast the next three years’ figures.
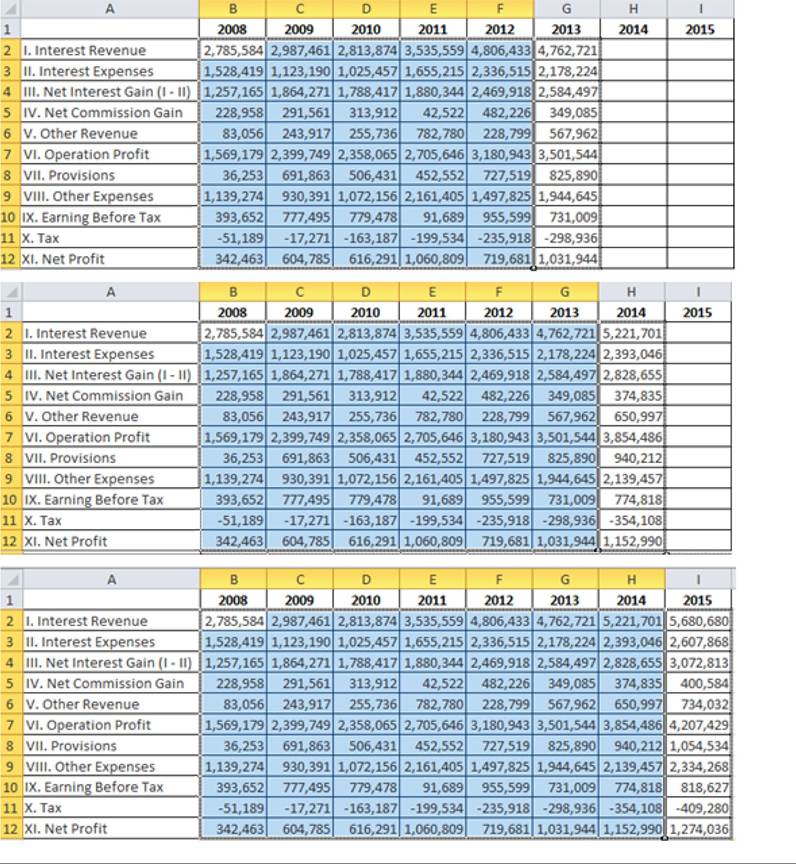
They have used MS excel to forecast the new year’s figures with a very simple way.
Step 1: Input Data to Excel.
Step 2: Select Data (Figure 8).
Step 3: Move the Mouse to the bottom-right most (Column F, Row 12) expand it to the three left columns (Figure 9).
The forecasted values are listed under the years 2013, 2014 and 2015. If we want to see the equations we can use the following technique.
Table 5. Tarabia bank income statements
| 2008 | 2009 | 2010 | 2011 | 2012 | |
| Interest Revenue | 2,785,584 | 2,987,461 | 2,813,874 | 3,535,559 | 4,806,433 |
| Interest Expenses | 1,528,419 | 1,123,190 | 1,025,457 | 1,655,215 | 2,336,515 |
| Net Interest Gain (rev.-exp.) | 1,257,165 | 1,864,271 | 1,788,417 | 1,880,344 | 2,469,918 |
| Net Commission Gain | 228,958 | 291,561 | 313,912 | 42,522 | 482,226 |
| Other Revenue | 83,056 | 243,917 | 255,736 | 782,780 | 228,799 |
| Operation Profit | 1,569,179 | 2,399,749 | 2,358,065 | 2,705,646 | 3,180,943 |
| Provisions | 36,253 | 691,863 | 506,431 | 452,552 | 727,519 |
| Other Expenses | 1,139,274 | 930,391 | 1,072,156 | 2,161,405 | 149,7825 |
| Earning before Tax | 393,652 | 777,495 | 779,478 | 91,689 | 955,599 |
| Tax | -51,189 | -17,271 | -163,187 | -199,534 | -235,918 |
| Net Profit | 342,463 | 604,785 | 616,291 | 1,060,809 | 719,681 |
Figure 8. Excel calculations-select data
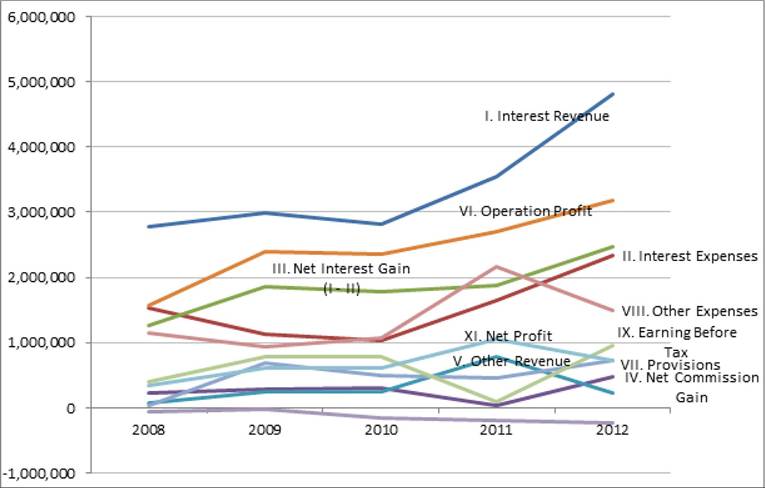
Step 1: Draw the charts of each item. To do that, go to insert menu, select line and select 2-D line (Figure 10).
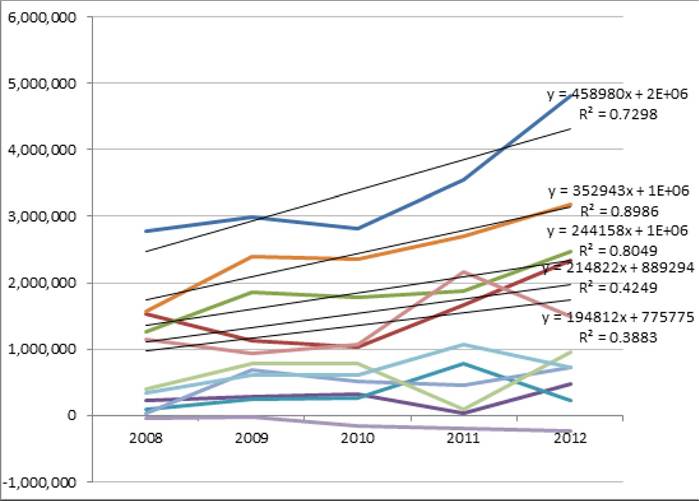
Step 2: The drawn figure is in Figure 11. Right Click on each line, select Add Trendline. Afterwards, click on “Linear,” “Display equation on Chart” and “Display R-squared Value on Chart.”(Figure 12-13)
R2which is an indicator of the accuracy of the model calculated through the regression analysis has a value range of 0 to 1. As the R2 value increases the accuracy of the model increases. This means that the regression models for the first three items are more accurate than the last two items. This means that the bank will achieve a net profit amount of 1,031,944, 1,152,990 and 1,274,036 in the coming three years.
CONCLUSION
Here in this study we have tried to show the modern risk management techniques which have been used by the banks so far in order to make more accurate estimations for the consequences of the banking
Figure 9. Excel calculations-expand data
transactions. Before doing that, we have defined what risk and risk management are. As we have shown in the beginning of the chapter the risk was defined as the possibility of something bad happening or to do something although there is a chance of a bad result. Moreover, the risk management was defined as the process of protecting one’s person or organization from potential asset or income loss.
Afterwards, we have shown the types of risks which have been gathered under both systematic and unsystematic risks. As it was explained throughout the chapter, the systematic risks were defined as the uncontrollable risks which are originated from the market conditions. However, there are other risks called unsystematic risks which are mainly originated from the operations of the company itself. All of these risks have been explained briefly throughout the chapter.
Figure 10. Excel cαlculαtions-drαw line

Figure 11. Tarabia Bank income statement items
After defining risk, risk management and types of risks, we have introduced contemporary risk management techniques. As we know that there are many other techniques other than these two techniques, we have restricted our study with only operations research and statistics. Moreover we know that both operations research and statistics cover a wide scope of business decisions thus what we have expressed here in this study is only a sample when we compare it the whole concept of these two techniques.
As it was mentioned in the study with the literature review and the examples, both operations research and statistics have been getting more importance in the modern financial applications. Since banks are one of the most important actors in the financial system both techniques have been started to be used by these institutions in order to mitigate and manage risk.
Figure 12. Excel cαlculαtions-αdd trendline

Figure 13. Tarabia Bank income statement regression models
As these are emerging subjects, there would be many researches to be conducted upon these two techniques. The banks would be more interested in more sophisticated aspects of both operations research and statistics. We have started to see many applications regarding statistics. The Basel Accords and all principles adopted with several amendments by Basel Banking Committee have shown that statistics have started to be used in managing different types of risks which have direct influence on the banking risks. As statistics have been used in all empirical analysis which has been done upon different aspects of sciences, the researchers are very close to these applications. However, since there are many techniques in statistics there is a very long way to go to calculate and estimate the risks more accurately in the future. Furthermore, there would be many other different statistical and operational research based analysis to be developed and the banking sector would make of these techniques more clearly in the future.
REFERENCES
Arnoldi, J. (2009). Risk. London, UK: Polity.
Ashish, S., & Srivastava, M. S. (1990). Regression analysis: Theory, methods, and applications. New York: Springer.
Basel Committee of Banking Supervision. (1997). Principles for the management of interest rate risk. Basel: BIS.
Basel Committee of Banking Supervision. (1999). Principles for the management of credit risk. Basel: BIS.
Basel Committee of Banking Supervision. (2001). Overview of the new Basel capital accord. Basel: BIS.
Federal Reserve Bank of San Francisco. (2013). What is liquidity risk? Retrieved from http://www. frbsf.org/publications/economics/letter/2008/ el2008-33.html
FERMA. (2013). Risk management standard. Retrieved from http://www.ferma.eu/risk-man- agement/standards/risk-management-standard
Gallati, R. R. (2003). Risk management and capital adequacy. New York: McGraw-Hill Professional.
Han, J., & Kamber, M. (2001). Data mining: Concepts and techniques. San Francisco: Morgan Kaufmann.
Jorion, P. (2003). Financial risk manager handbook. New York: John Wiley and Sons.
Maheshwari, Y. (2008). Investment management. New Delhi: PHI Learning Pvt. Ltd.
Megginson, W. L., & Smart, S. B. (2008). Corporate finance. London, UK: Cengage Learning EMEA.
Olson, D. L., & Wu, D. D. (2008). Enterprise risk management. World Scientific.
Operations Research Society of America. (1987). Operations research. New Age International.
Penza, P., & Bansal, V. K. (2001). Measuring market risk with value at risk. New York: John Wiley & Sons.
Shah, N. H., Gor, R. M., & Soni, H. (2007). Operations research. New Delhi: PHI Learning Pvt. Ltd.
Siegel, J. J. (2002). Stocks for the long run: The definitive guide to financial market returns and long-term investment strategies. New York: McGraw-Hill Professional.
Spiegel, M. R., & Lindstrom, D. P. (2000). Schaum’s easy outlines: Statistics: Based on Schaum’s outline of theory and problems of statistics. New York: McGraw-Hill Professional.
Taha, H. A. (1997). Operations research. Upper
Saddle River, NJ: Prentice Hall.
University of Newcastle Australia. (2013). Risk management. Retrieved from.http://www. newcastle.edu.au/service/risk-assurance/risk- management.html
This risk can be named as market risk and it has an effect on all investments in that market. This risk is an externally driven risk which cannot be mitigated through diversification.
Unsystematic Risk: The risk of the investment itself. This is driven by internal factors and can be mitigated through diversification.
KEY TERMS AND DEFINITIONS
ENDNOTES
Industry Risk: The chance that a set of factors particular to an industry group drags down the industry’s overall performance. For example a tax increase in the automobile industry may adversely affect the profits of the automobile producers due to the sharp decline in the sales volume.
Management Risk: The risks associated with ineffective, destructive or underperforming management, which hurts shareholders and the company or fund being managed.
Systematic Risk: The uncontrollable risk which is originated from the market conditions.
NPV is the difference between the present values of all future cash flows and the initial investment cost. A positive NPV shows that the project is feasible. The more the NPV the more economical the Project.
2 year interest factor of 10% which is used to convert USD 1 future cash flow to two years before. It is 1/(1+0.1)2
1 year interest factor of 10% which is used to convert USD 1 future cash flow to one year before. It is 1/(1+0.1)1
This work was previously published in Handbook of Research on Strategic Business Infrastructure Development and Contemporary Issues in Finance, edited by Nilanjan Ray and Kaushik Chakraborty, pages 186-206, copyright 2014 by Business Science Reference (an imprint of IGI Global).