Chapter 30 Multi-Agent Financial Network (MAFN) Model of US Collateralized Debt Obligations (CDO): Regulatory Capital Arbitrage, Negative CDS Carry Trade, and Systemic Risk Analysis
Sheri M. Markose
University of Essex, UK
Bewaji Oluwasegun
University of Essex, UK
Simone Giansante
University of Bath, UK
ABSTRACT
A database driven multi-agent model has been developed with automated access to US bank level FDIC Call Reports that yield data on balance sheet and off balance sheet activity, respectively, in Residential Mortgage Backed Securities (RMBS) and Credit Default Swaps (CDS).
The simultaneous accumulation of RMBS assets on US banks’ balance sheets and also large counterparty exposures from CDS positions characterized the $2 trillion Collateralized Debt Obligation (CDO) market. The latter imploded at the end of2007 with large scale systemic risk consequences. Based on US FDIC bank data, that could have been available to the regulator at the time, the authors investigate how a CDS negative carry trade combined with incentives provided by Basel II and its precursor in the US, the Joint Agencies Rule 66 Federal Regulation No. 56914, which became effective on January 1, 2002, on synthetic securitization and Credit Risk Transfer (CRT), led to the unsustainable trends and systemic risk. The resultant market structure with heavy concentration in CDS activity involving 5 US banks can be shown to present too interconnected to fail systemic risk outcomes. The simulation package can generate the financial network of obligations of the US banks in the CDS market. The authors aim to show how such a Multi-Agent Financial Network (MAFN) model is well suited to monitor bank activity and to stress test policy for perverse incentives on an ongoing basis.DOI: 10.4018∕978-1-4666-6268-1.ch030
.
1. INTRODUCTION
The 2007 financial crisis which started as the so-called ‘sub-prime’ crisis in the US has had severe global repercussions. There has been a contraction in output and employment, bank bailouts1, increased tax burdens, and accelerated fiscal austerity to levels not previously recorded since the Great Depression.
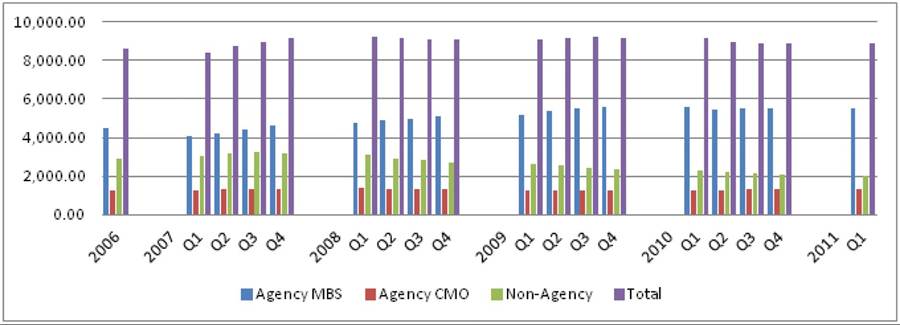
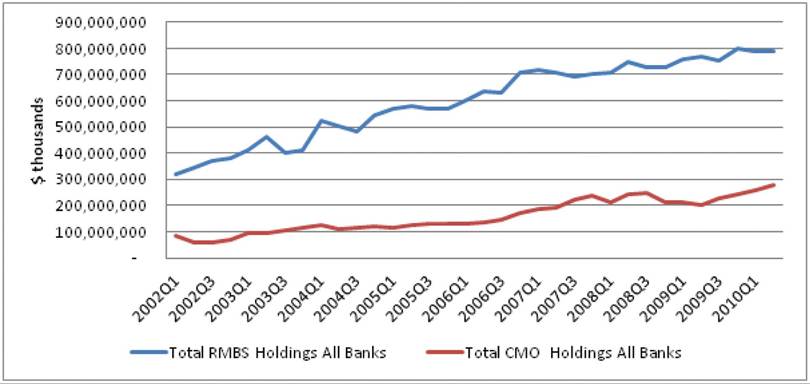
The crisis has exposed shortcomings of monetary economics (Buiter, 2009) and the regulatory framework of Basel II (Brunnermier, et al., 2009; Hellwig, 2010; Mar- kose, 2011). Eichengreen (2010) has concluded that “fundamentally, the [2007] crisis is the result of flawed regulations and perverse incentives in financial markets.” Macroeconomic modeling and its use in policy analysis have come under heavy criticism. Critics have accused macroeconomists of an insidious reliance on a particular class of macroeconomic models that has abstracted away institutional details and financial interconnections in the provision of liquidity, capital adequacy and solvency (Wieland, 2010; Colander, et al., 2009). Most of all, what is prominent is the absence of a framework to deal with regulatory and market failure arising from the negative externalities from excessive credit creation and leverage. On the operational front, serious deficits remain in the economics curricula in not providing integrated quantitative tools for holistic visualization and monitoring of the financial system to identify systemic risk threats from activities of financial firms. Further, central tenets of the regulatory framework were and continue not to be stress tested in an ongoing way to see if they are prone to creating perverse incentives. The main objective of this chapter is to provide an exemplar of a quantitative integrative financial framework using multi-agent modeling, which can monitor and analyse systemic risk from activities of financial intermediaries within the context of the regulatory incentives and prevailing market conditions.The specific institutional propagators of the 2007 crisis involved Residential Mortgage B acked Securities (RMBS), which had grown to over $8.5 trillion in the US alone by 2006 (Figure 1), surpassing US securities and corporate bonds. This whole asset class suffered considerable impairment of market value with the collapse of US house prices. Except for government agency issues, post 2008, new issuance of MBS has dropped to almost zero.
The buildup of systemic risk occurred in two distinct phases. In the first ‘originate and distribute’ phase of securitization of bank loans, banks followed an aggressive strategy ofloan portfolio expansion by overcoming restrictions placed by the size of a bank’s deposit base by reissuing the capital released from securitization into new mortgages/loans. This regulatory arbitrage which placed securitized assets off balance sheet in Special Purpose Vehicles (SPV) in order to reduce the 8% minimum capital requirement of the Basel I Accord has been found by many (see, Goderis, et al., 2007) to enable banks to achieve 50% higher loan target levels and reduce equity capital to asset ratio to about 5.3% as opposed to the 9.8% for those that did not. The second phase of the crisis involved an accelerated growth of RMBS, especially in its subprime form, as collateral in structured Collateralized Debt Obligations (CDO)2 held as bank assets and in bank liabilities in conduits such as Asset Backed Commercial Paper (ABCP) in short term repo markets. The liquidity crunch is seen as a run on the repo market. As noted by Gorton and Metrich (2009), outdated models of money and banking prevented central banks and supervisory bodies from seeing the $12 trillion procyclically sensitive collateralized securities in the repo and shadow banking system as being part of the fractional system of private credit creation which will suffer convertibility problems vis-a-vis central bank regulated funds and reserves for which the tax payer remains liable.Emphasizing the problem of how the above individually rational activity of financial institutions aimed at expanding their loan market share will undermine system stability, Jones (2000), from the Division of Research and Statistics of the
Figure 1. US mortgage-related securities outstanding (US$ billions) 2006-2011 (Source: Securities Industry and Financial Markets Association (SIFMA). Note: CMOCollateralized Mortgage Obligations; Non-Agency MBS includes RMBS and CMBS.)
Board of Governors of the Federal Reserve System, stated “absent measures to reduce incentives or opportunities for regulatory capital arbitrage, over time such developments could undermine the usefulness of formal capital requirements as prudential policy tools.” Jones noted that regulatory capital arbitrage has attracted scant academic attention, or for that matter as a key aspect of regulatory design, and appears to think that this is due to a lack of sufficient time series data, which impedes econometric analysis of regulatory capital arbitrage.
If econometric models are not up to the task of modeling regulatory capital arbitrage due to limited data points, are there no other tools to test bed regulatory systems?About the second phase in RMBS developments, the question that has often been asked is, in a period, which started with the ‘originate and distribute’ model of remote securitization and regulatory focus on Credit Risk Transfer (CRT), how did so much RMBS assets and their credit risk accumulate within banks themselves? Indeed, the extraordinary transfer of $1.5 trillion MBS from balance sheets of US financial intermediaries directly on to that of the Federal Reserve in March 2010 to purge the system of toxic assets marks an ongoing fallout from the crisis3.
Acharya and Richardson (2010) state that “what made the current crisis so much worse than the crash of2000 was the behaviour of many of the Large, Complex Financial Institutions (LCFIs). These LCFIs ignored their own business model of securitization and chose not to transfer the credit risk to other investors” (italics added). While Acharya and Richardson (2010) appear to acknowledge that LCFIs by retaining RMBS securities on their balance sheets along with CDS4 guarantees allowed banks to save capital, they neither attribute this to the regulatory incentives in place nor show how profitable this was for banks in the short run, a matter that is the key to any myopic business model. Stultz (2010, p. 80) admits to the regulatory incentives in place with the onset of the ratings based risk weighted and CRT orientation of Basel II which marked the development of synthetic securitization. By and large, there seems to have been a fundamental misunderstanding among a number of economists about the advanced state of the adoption of reduced capital requirements for retained RMBS on bank balance sheets with synthetic securitization and CRT in US banks following from the Joint Agencies Rule 66 Fed. Reg. 56914 and 59622, which became effective on January 1, 20025.
Blundell-Wignall and Atkinson (2008) quite rightly state: “understanding causality is a precondition for correct policy making” in their attempt to assess the impact of the Basel II incentives for capital reduction by banks and the CDS negative basis carry trade for the critical build up in 20067 of RMBS and CDS on US banks’ balance and off balance sheets that brought the US financial system to the brink of collapse. While they bring a wealth of evidence on regulatory incentives for the acceleration of RMBS assets on banks’ balance sheets, they do not attempt to develop a methodological framework to study causality. Extant statistical and econometric models fail to identify the threats to stability from such incentives for capital arbitrage among financial firms that lead to topological fragility of the CDS based risk sharing institutions. There has been growing structural concentration in the provision of credit risk guarantees often referred to as too interconnected to fail arising from the high concentration of financial links between a few key players. Using the US FDIC bank data on RMBS and CDS and holdings we will develop a multi-agent model for the US financial firms to see how regulatory authorities can monitor and assess the systemic risk implications from such a toxic build up.
This chapter addresses the need to develop new computational and simulation based methodologies to track bank balance sheet and off balance sheet activity of financial intermediaries in response to changes in regulatory policy and also due to competitive co-evolutionary pressures to grow market share. Markose (2005) has advocated the use of a complex adaptive system perspective, the sine qua non of which is strategic innovation or novelty production within a Red Queen type arms race between participants. Traditional policy related models, often in the stochastic control or dynamic programming framework ignore this facet of competitive co-evolution. As in other complex adaptive systems such as biological ones, the Red Queen competitive co-evolution is known to be rampant among market participants and between regulators and regulatees.
The implications ofthis for regulatory arbitrage endemic to the current financial crisis should be noted. Indeed, the nail in the coffin of large scale macro-econometric models came with the Lucas Critique on the capacity of a rule breaking private sector which can anticipate policy and negate policy or jeopardize the system by a process of regulatory arbitrage (see, Markose, 2005, Sections 3 and 4). Such strategic behaviour results in a lack of structural invariance of the equations being estimated, highlighting the restrictiveness of econometric modeling for policy analysis.Agent based computational economics or ACE using the acronym coined by Leigh Tesfatsion (see Tesfatsion & Judd, 2006) is based on object oriented programming that can produce agents that are both inanimate (e.g. repositories of data bases) as well as behavioural agents capable of varying degrees of computational intelligence. These range from fixed rules to fully adaptive agents representing real world entities (such as banks or consumers) in artificial environments, which can be replicas of, for instance, the financial system. Recently, many have emphasized the uses of ACE simulation platforms for digital mapping of the financial system, stress testing policy and for institutional design (see, Buchanan, 2009; Markose, 2011). These artificial environments can depict real time orientation, institutional rules, and also complex interactions. For the simulation framework to be useful for assessment of policy, financial firm level responses must be modeled in the context of prevalent market conditions and with automated access to balance sheet and off- balance sheet data to anchor the financial decisions being simulated. Further, the interactions of agents produce system wide dynamics that are not restricted to pre-specified equations, which have to be estimated using past data in econometric or time series approaches. In an agentbased model, each agent follows explicit rules or strategies under specified market conditions and a ‘probe’ monitors causal internal workings and also aggregates outcomes. In contrast, the main drawback of estimation based equation analyses is that structure changes from strategic behaviour and tracing of causal links are almost impossible to do. Finally, we aim to represent CDS financial obligations of the US banks in a financial network format to identify systemic risk consequences of topological structures showing concentration of interaction between a few highly interconnected banks.
To our best knowledge the IBM MIDAS project (see, Balakrishnan, et al., 2010) and the EC grant FP6 -034270-2 project of Markose and Giansante (see ACEfinmod.com) are the only known software technologies being developed for (US centric) large scale firm level financial database driven models for systemic risk analysis. The advantages of agent based financial models where agents and their interconnections are empirically determined by data bases is that they can give structural snap shots of the situation without needing large time series that statistical and econometric models need. In recent assessments of network analysis for systemic risk,6 this framework has been found to be useful in operationalizing the study on the propagation of financial contagion as a result of failure of counterparties, Haldane (2009). However, the pre 2007 financial networks literature has yielded mixed results. Firstly there were few studies on financial networks based on empirical bilateral data between counterparties that could establish ‘stylized’ facts on network structures for the different classes of financial products ranging from contingent claims and derivatives, credit related interbank exposures and large value payment and settlement systems. Where bilateral data on financial exposures was not available, both simulated and theoretical models assumed network structures to be either uncorrelated and random, Nier et al. (2007) or complete networks (see Upper & Worms, 2004; Upper, 2011). These approaches crucially do not have the too interconnected to fail characteristics which imply a highly sparse coreperiphery network structure. Only Craig and von Peter (2010) and Fricke and Lux (2012) who use empirical bilateral interbank data have highlighted the core-periphery network structure in financial systems. Markose etal. (2010) were among the first to show how such structures propagate contagion in a radically different way to random networks. Thus, while the stability of financial networks has been usually investigated using the classic Furfine (2003) algorithm, it is only recently that economists have renewed efforts to understand and quantify how contagion propagates in highly tiered and clustered financial networks which imply sparse matrices with heterogeneity in connectivity and exposures that can be modeled by power law distribution (see Moussa, 2011). Finally, the idea that nodes in the network which constitute financial intermediaries and other financial actors are themselves intelligent ‘ agents’ operating within constraints and incentives provided by the markets and regulations has not been fully operationalized yet. Markose (2011) has referred to models that aim to digitally map the financial system from large firm level data bases as Multi-Agent Financial Network (MAFN) models.
This chapter will focus extensively on the decision problem confronting the US FDIC banks involved in both CDS and RMBS markets in the 2006-7 period. We then show, on the basis of market shares of US banks in the CDS market, that it implies a too interconnected to fail network topology which is a source of systemic risk. The structural weakness in modern risk sharing institutions arising from too much concentration of market share among a few broker-dealers is a matter which was first raised by Darby (1994) in the case of derivatives markets in general. Many have since noted (see Persuad, 2002; Lucas, et al., 2007; Das, 2010; Gibson, 2007) that the benefits of CRT will be compromised by the structural concentration of the CDS market. Using financial network modelling we have dealt with these issues in Markose et al. (2012) in the case of the US CDS market and for the global derivatives markets in Markose (2012). This chapter will show how a MAFN simulation platform based on the US FDIC data base will combine both the stress tests for perverse incentives of Basel II CRT regulation and also the systemic risk from the financial network that arises from the CDS obligations of US banks. We note that in the repertoire of agent based models, the potential for systemic risk from regulatory incentives are the easiest to simulate. In the case for policy incentives for capital reduction, we set the banks to minimize capital as far as it is permitted by the rules of synthetic securitization and the market conditions given by the sub-prime ABX-HE index.
The rest of the chapter is organized as follows. Section 2 will set out regulatory conditions for capital reduction and also the costs of credit risk mitigation from CDS. The synthetic CDO structure referenced on the ABX-HE tranches, which will be replicated in the strategies of the bank agents, will be discussed. The questions being asked are as follows: could the US banks that were simultaneously involved in both CDS purchases and RMBS assets, have accumulated the quantities of these assets over the period of 2006 to 2007 Q 3 when the holdings of these peaked, solely through a process of c apital arbitrage permitted by the regulatory framework? How much did market conditions and CDS carry trade exacerbate the situation? How much leverage was involved in the context of CRT using CDS in the 2006-07 period?
In parallel, the key policy exercise is to see by how much US bank balance sheet holdings of RMBS and CDS may have been attenuated in the absence of Basel II type regulatory incentives in the 2006-7 period. In the spirit of investigating perverse incentives of a given regulatory framework, each bank’s initial position in these assets is taken as the starting point for the algorithms reflecting the terms and conditions of the regulation being implemented by bank agents. Then the capital saved and profits from the CDS carry trade are reinvested, revalued, and cumulated quarter by quarter under prevailing market conditions. In Section 4, the FDIC bank data on RMBS holdings and market data on bond yields and the CDS spreads from ABX-HE index is discussed. The equivalent CDO yield spreads are obtained from the weekly CDS/CDO Update Reports published by the Fixed Income Research team at the Japanese bank Nomura and based on the bank’s weekly CDO pricing pipeline between 2006Q1 and 2007Q3. The reason why the simulation is confined to the 2006-7 period is that the ABX-HE index, which gave market information for subprime RMBS CDO activity and CDS valuation, was operational only in this period. Section 5 gives the simulation results. We find that around 2006 Q1 the US FDIC banks saved some $20bn capital from Basel II CDS based CRT. What is remarkable is that the simulation results show that unless substantial leverage is applied, the $100bn increase in banks’ holdings of RMBS and structured CDO products over the 2006-07 period is unlikely to have happened. Further, substantial CDS purchases averaging about $300bn for each quarter of the 2006-7 for capital reduction was amassed on banks’ balance sheets for purposes of capital reduction on RMBS. CDS on RMBS was the fastest growing segment of the CDS market and failures to meet obligations arising from these derivatives led to the major taxpayer bailout of financial intermediaries in 2008 on grounds of being too interconnected to fail. Section 6 gives a brief discussion of the empirical network characterization of the CDS market and its systemic risk implications. This is followed by a concluding section on the future work needed to extend the scope of MAFN models beyond the example exercise conducted in this chapter to one of full automation of access to financial firm level data and as a computational platform for monitoring of systemic risks.
2. THE REGULATORY AND MARKET CLIMATE (2005-2007)
2.1. Capital Reduction for US Banks from Synthetic Securitization
In synthetic securitization and CRT, an originating bank uses CDS or guarantees to transfer the credit risk, in whole or in part, of one or more underlying exposures to third-party protection providers. In the typical synthetic securitization, the underlying exposures remain on the balance sheet of the originating bank, but the credit exposure of the originating bank is transferred to the protection provider or covered by collateral pledged by the protection provider. Under Basel I, since 1988, a standard 8% regulatory capital requirement applied to banks with very few exceptions for the economic default risk of assets being held by banks. In the run up to Basel II, and its precursor in the US which set out the capital treatment in the Synthetic Collateralized Loan Obligations guidance published by the OCC (OCC 99-43) and the Joint Agencies Rule 66 Fed. Reg. 56914 and 59622 which became effective on January 1, 2002, the 50% risk weight which implied a capital charge of 4% on residential mortgages could be reduced to a mere 1.6% through the process of synthetic securitization and external ratings which implied 5 times more leverage in the system. This strongly incentivized the use of CDS by banks, which began to hold more MBS on their balance sheets and also brought AAA players such as AIG, hedge funds and erstwhile municipal bond insurers called Monolines into the CDS market as protection sellers7.
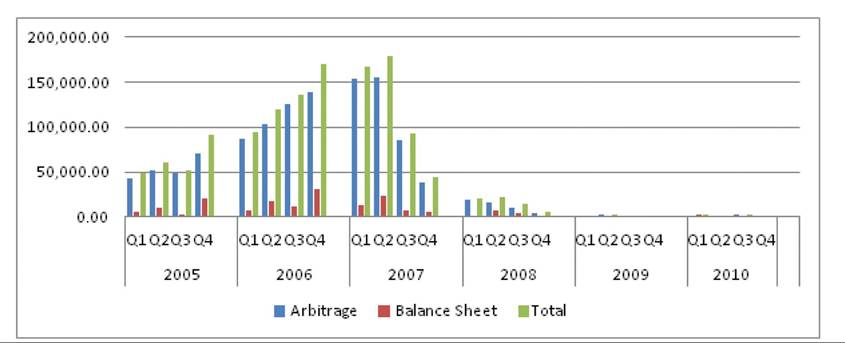
Figure 2 shows the growth of arbitrage and balance sheet CDOs in the period of 2006-2007 from about $50bn in 2005Q1 to over $160bn at its peak in 2007 Q2. In particular, the demand for subprime synthetic CDOs proved lucrative as their high yields contrasted well with the low cost of securing credit risk guarantees from insurers who had little regulatory capital in place. In 2006-2007, the opportunity for negative CDS basis trades has also been singled out (see Deng, et al., 2010; Hu, 2007) for the growth of arbitrage and balance sheet CDOs. Under conditions of a negative CDS basis, banks in particular enjoyed not only savings in capital from reduced risk weights; they also received a positive net return from a joint CDO and CDS position.
It is important to note is that as early as 2003 it became mandatory for FDIC banks and trusts to report their securitization activity with explicit breakdowns for financial structured products and also their CDS positions. Indeed, US Joint Agencies Rule 66 Fed. Reg. 56914 and 59622 did en-
Figure 2. CDO issuance (USD millions) 2005Q1-2010Q4 (Source: SIFMA)
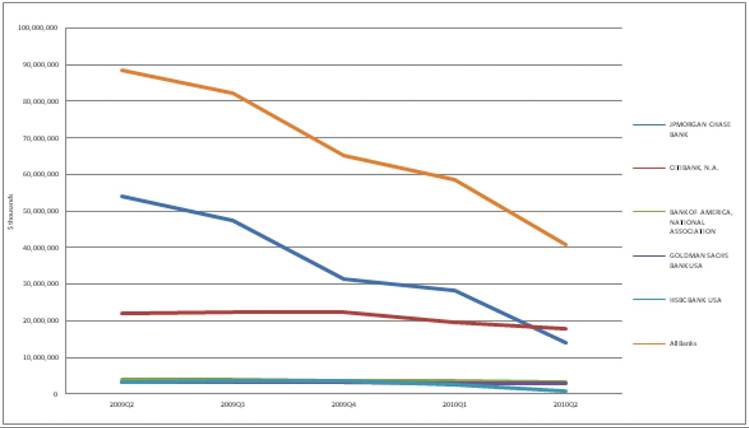
dorse the need for the capital reduction sought by banks through the use of CDS to be made public and transparent. However, the data in response to the question pertinent to assess policy incentives as to the amount of CDS protection taken out by banks and recognized as a guarantee for regulatory capital purposes has been reported in the FDIC Call Reports only from 2009 Q2. As seen from Figure 3, even in 2009 Q2 a substantial sum of £88.56 bn of CDS protection was purchased for regulatory capital purposes by reporting FDIC US banks.
By our calculations, which will be explained, this implies capital savings of a minimum of $2.13 bn.9 Note, JP Morgan was claiming the giant share of this, followed by Citibank. Also the RMBS assets on the balance sheets of these same banks in 2009 Q2 was about $510 bn making the underlying RMBS for which CDS protection was being purchased at about 17%. This was found to fall to about 4% by 2010 Q4.
Unlike remote SPV sales of RMBS, it is far from the case that synthetic securitization and CDS activity of banks was to escape capital regula-
tion. Indeed, it was fully in compliance with the regulation. For instance, Part V Sections 7 and 43 on synthetic securitization in the Federal Reserve Board Basel II Capital Accord Notice of Proposed Rulemaking (NPR) and supporting Documents (2006) 10 encourages the three following features that mark the 2007 crisis, as best practice in banks on how to reduce risk based capital. There was encouragement to use external ratings by so called Nationally Recognized Statistical Rating Organization (NRSRO) agencies so that securitizations can be retained on the bank’s own balance sheet with reduced risk capital requirements. The mainstay of the ratings based assessment of risk in banks is to assign the risk weight for claims against an obligor or reference assets according to (1) the credit rating of obligors or the reference assets based on at least two external ratings given by NRSROs, or (2) the credit ratings of the credit risk protection providers primarily in the context of credit default swaps. In fact, as seen from 1999 documents on the capital treatment described in the Synthetic Collateralized Loan Obligations guidance published by the OCC (OCC 99-43) and the Board (SR 99-32) in November 1999 and the extent to which it is affected by the 2002 Final Rule 66 Fed. Reg. 56914, it is clear that the latter expressly permits “inferred” ratings to apply to senior synthetic CMO tranches retained by banks11. In other words, as stated in Fed Reg. 59614, “the sponsoring banking organization no longer is required to purchase protection on the senior loss position in order to assign a 20 percent risk weight to that position. Rather, it can assign a 20 percent risk weight based on the inferred rating of the subordinate credit linked notes.”
Figure 3. Purchased CDS protection that is recognized as a guarantee for regulatory capital purposes by the top 5 banks and all reporting banks 2009Q2 to 2010Q28 (Source: FDIC Call Reports)
1.1. Synthetic RMBS Structure for Capital Arbitrage
Based on the above discussion, we aim to determine the capital saved through the process of using CDS for c apital arbitrage in the context of the rules for synthetic securitization. Consider the generic partially funded synthetic CDO structure depicted in Figure 2 based on an example in the 1999 OCC Bulletin 99-43α whereby, the originating bank’s reference portfolio consisting of $5bn in residential mortgage assets is divided into an unfunded $4.55bn (91%) super-senior position, a $400m (8%) funded mezzanine position and a retained $50m (1%) first loss/equity position. Note that a transaction of this form enables the sponsoring bank to significantly reduce its regulatory capital requirements. Using the 2002 Final Rule 66 Federal Regulation No. 56914, we assign a 20 percent risk weight to the super senior position based on the inferred rating of the subordinate credit linked notes. This follows from the assumption of the secure funded nature of the mezzanine tranche. The credit exposure on the $400m mezzanine tranche is insured by buying protection in form of CDS from the SPV or CDO trust, which funds the exposure by issuing Credit Linked Notes (CLN) to investors. The CDS on each of the obligors in the reference portfolio are structured to pay the average default losses on all senior unsecured obligations of defaulted borrowers. The notional value of the credit linked notes issued typically is set at a level sufficient to cover some multiple of expected losses, but well below the notional amount of the reference portfolio being hedged. The proceeds from the sale of these notes are then invested in high-grade government securities or other eligible collateral as defined under the Basel Accords. This collateral is pledged to the originating bank in exchange for the $400m reference exposures should a credit event occur.
If the funding behind the mezzanine tranche involves Treasury bonds or cash then it has zero capital weight though the bank incurs the cost of the CDS spread. This may be sufficient for the senior tranche to be allowed a 20% risk weight reduced from either a 50% or 100% without the bank having to incur CDS purchases on the senior tranche. The final $50m first loss exposure is retained and requires a 100% risk weight as it is assumed to be unrated.
In what follows we will assume a 20% risk weight for the senior tranche and a zero risk weight for the funded mezzanine tranche. However, as we aim to replicate the ABX-HE index structure, the reference assets of the senior tranche is assumed to be 40% and that of the mezzanine one to be 60%13. The mezzanine tranches will follow sub-indexes with ratings of AA, A, BBB, and BBB-of the ABX-HE index. The bank will optimize ownership of those sub-indexes that yield the largest CDS basis return. This will be explained below.
2. SIMULATION MODEL FOR REGULATORY CAPITAL REQUIREMENTS WITH CDS CREDIT RISK MITIGANT
2.1. CDS Capital Arbitrage Model
Let ε and θi, respectively, denote the 8% regulatory capital requirement and the regulatory risk weight on the CDO tranche i without the Credit Risk Mitigant (CRM) and θi crm is the risk weight commensurate with credit risk mitigant. The latter is assumed to be issued by an AAA rated company in the form of CDS cover. The savings in risk capital given by ε(θi - θi crm) in basis points must in principle exceed the net cost of purchasing CDS and acquiring the CDO tranche. For this the CDS spread λit at time t has to be contrasted with the CDO bond spread given as the yield minus the risk free rate (y - rt). This condition for the profitability of CDS based capital reduction for structured RMBS reference assets is as follows:
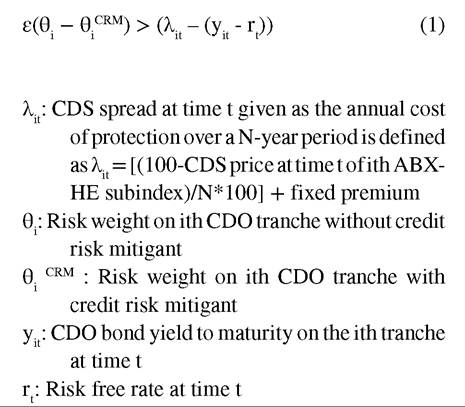
Capital saved with CDS based CRT from an AAA guarantor on the senior RMBS tranche is 240 basis points (which is 400 basis points less 160 basis points) and on the mezzanine tranche with zero risk weight, all of the 400 basis points is saved. In a period of zero to negative yields on bonds and high interest rates, the regulatory capital arbitrage via CDS activity may be naturally curtailed as the CDS basis becomes positive. Indeed, Equation (1) suggests that the regulatory capital saving incentives are so strong that only in the case of the CDS basis exceeding over 400 basis points will this activity be curtailed.
3.2. CDS Carry Trade: Mechanism Explained
The market for a credit derivative and the cash market for the underlying bond of the same maturity need to be aligned to avoid mispricing and arbitrage opportunities. In principle, the CDS spread which reflects the price of credit risk of the bond, as an initial approximation, should be equal to the bond spread for a bond with a given maturity (Duffie, 1999; Hull, et al., 2004). The bond spread defined as the yield to maturity minus the risk free rate (yt - rt) includes the price of credit risk of the issuer of the bond while the CDS spread could also include counterparty risk of the CDS protection seller. The so called CDS basis given on the right hand side of (1) is the difference between the CDS spread, λt and the bond spread (yt - rt). Under conditions of negative basis, viz. yt - λt > rt, an investor in a self-financing strategy buys the bond and the CDS cover on it by borrowing at a risk-free rate. In so doing he locks in the carry trade profit equal to ((yt - rt) - λt). If this strategy is widely adopted, the bond price increases, leading to a fall in its yield and an increase in the price of CDS protection, which ultimately cancels out the observed divergence. Conversely, if yt - λt < rt, the investor should sell the bond (if possible), sell the CDS and invest at a risk-free rate, which ultimately restores equilibrium14.
It is clear from (1) above that under conditions of a negative CDS basis, banks that seek to reduce capital on RMBS assets on their balance sheet through synthetic securitization have an added bonus in the form of the carry trade profits. The exceptional growth of arbitrage CDOs in 2006 and early 2007 is because the CDO tranches offered more yield than cash assets such as corporate bonds with the same ratings while the CDS spreads on the CDO tranches were underpriced. The latter was specially the case for BBB and BBB- tranches. Hamerle et al. (2009) maintain that the demand for CDO tranches arose because investors were guided solely by the tranches’ rating and ignore the increased systematic risk for pricing.
3.3. Agent-Based Model of Capital and CDS Basis Arbitrage Trade Implementation
The regulatory climate, the ensuing rise in CDS market liquidity and the creation of numerous CDS indices provide the underpinnings of the CRT gaming of banking regulation. This regulatory gaming allows banks to benefit on two fronts, firstly from leverage based on reduced capital charges against assets held on their balance sheets as defined in Equation 1. Secondly, as holders of the credit exposures, banks are also able to gain additional per-tranche basis or carry-trade income from holding such assets and buying credit protection against them. Using Equation (1) we derive the initial per-tranche gain or loss, πit:
Here Xi is the $ value of the underlying tranche. It is assumed that the strategy of capital reduction using CDS risk mitigant and the negative CDS carry trade proceed simultaneously when conditions for both overlap. When a negative basis does not prevail but the capital arbitrage is still lucrative, then (2) above becomes the net income from the strategy. Setting i= 1 to be the senior tranche and i= 2 to be the mezzanine tranche, we assume that at time t the net profit from t-1is reinvested between the 2 tranches in terms of 40% and 60%.15 The mezzanine tranche is then invested in the ABX-HE ratings band that provides the greatest return in terms of CDS basis at time t. Positions are assumed to be held to maturity where the maturity dates follow the vintage of the selected ABX-HE tranche. In the simulation, two factors will affect the growth of banks’ holdings of RMBS
assets. These are ABX-HE prices and the use of leverage. The baseline growth in balance sheet holdings of RMBS in the case of no leverage is given by the following: 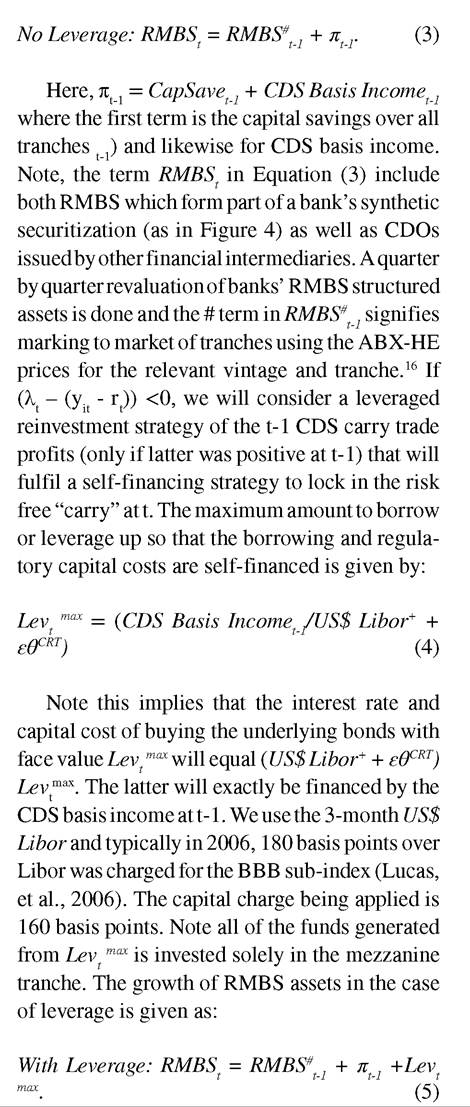
Figure 4. Partially funded hybrid synthetic CDO RMBS structure ($5 bn) (Source: Adapted from OCC Bulletin 99-43a: Capital Interpretations Synthetic Collateralized Loan Obligations12)
3. DATA USED FOR SIMULATION
3.1. The FDIC Bank Data
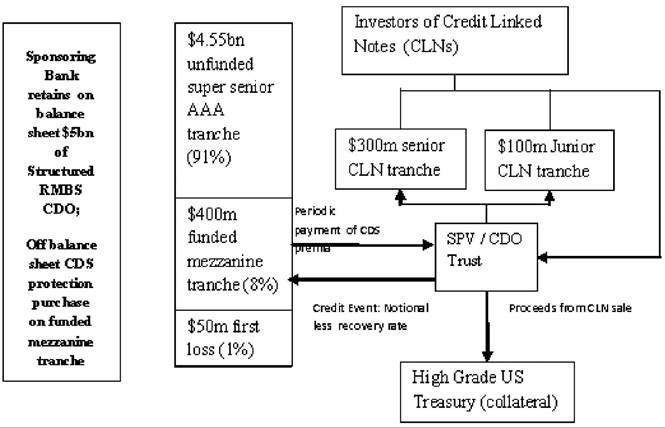
The bank data used in the model presented here is taken from the Thrift/Call Reports of FDIC insured banks most active in CDS market, as reported by US operating banks to the Federal Deposit Insurance Corporation (FDIC). This data is available to the public either in form of individually submitted reports or in form of quarterly bulk reports collected into tab delimited CSV files. For each reporting quarter between 2002Q1 and 2010Q2 these tab delimited CSV files were imported into a single MySQL database from which the agent data is extracted based on CDS market participation conditions. In particular, the criteria used to determine the banks for which data is extracted is that they have a record of CDS credit protection purchases at any point during the 2002Q2 and 2010Q1 period. The RC-Codes for the Thrift/ Call report items corresponding to mortgage backed securities held on balance sheet, credit default swap protection purchases and mortgage backed securitisation activity of the banks are then extracted (see Figure 5)17.
At the individual bank level, wide variations can be observed in the FDIC data on RMBS holdings over the 2002Q1 and 2010Q2 decade. However, for the period 2006- 2007 Q3, all banks in our sample with the exception of Bank of America showed a steady and in some cases very large increase in balance sheet holdings of RMBS. The largest RMBS holder, Bank of America, saw a rapid growth in its holdings from US$62.4bn in 2002Q1 to US$211.9bn by 2005Q2. From which point its holdings fell to US$146.6bn by 2007Q1.
Also, note that increase of Citibank’s RMBS holdings from a negligible amount in 2006 Q1 to over $100bn in 2007 Q1 coincided with its strategic restructuring of 200618. JPMorgan from an initial decline in its holdings of US$56bn in 2003Q2 to US$21.18bn by 2005 Q4, substantially increased its holdings over the next 2 year period reaching US$79bn by 2007Q2. This dipped to US$66.7bn in 2007Q4 before rebounding to a height of US$195.4bn by 2009Q3. For banks outside of the Top 12, holdings declined from
Figure 5. Total balance sheet holdings of RMBS vs. structured MBS by all banks in sample (2002 Q1 - 2010Q1) (Source: FDIC Call Reports)
the 2004Q1 peak of US$167bn to US$111.9bn in 2006Q2, then witnessed an increase to US$172bn by 2007Q3 before falling back to early 2006 levels by 2008Q1.
3.2. The Bond Spread and
CDS Spread Data
The data relating to the structured finance bond spread is extracted from the weekly CDS/CDO Update Reports published by the Fixed Income Research team at the Japanese bank Nomura and based on the bank’s weekly CDO pricing pipeline between 2006Q1 and 2007Q3. Of these, only those CDOs consisting of 50% or more residential mortgage or home equity backed notes are considered and factored for a spread over the appropriate USD 3month LIBOR rate. CDS spreads are taken as those implied in the five sub-indices based on the benchmark rating levels (AAA, AA, A, BBB, and BBB-) of reference obligations of the ABX.HE index launched by Markit in January of 2006. In the ABX.HE index, for each year 2 vintages were constructed on selected reference subprime RMB S issued 6 months prior to date of the vintage. The reinvestment strategy given in Section 3.3 for capital saved and profits from carry trade strategies at the end of each quarter is based on a time series of CDS spreads constructed in the following way: 2006Q1 and 2006Q2 CDS spreads are based on the ABX.HE 2006-01 indexes, 2006Q3 and 2006Q4 spreads are based on the ABX.HE 2006-02 indexes and the 2007Q1, 2007Q2 and 2007Q3 spreads are based on ABX.HE 2007-01 indexes. The resulting CDS-spreads, CDO-bond spreads and CDS-basis are plotted in Figures 6 and 7. Table 1 gives the CDS basis of all ABX. HE tranches for the sample period.
Over the period of this simulation, the trend was to move from a negative CDS-basis toward a positive CDS basis. Spreads on the BBB-rated tranche of the ABX.HE, for instance, had risen from 121bps in 2006Q1 to 1929bps by 2007Q2, whereas the spreads on the underlying RMBS- CDOs had only risen from 351bps to 602bps over the same period, resulting in a CDS-basis change from -230bps at 2006Q1 to 1326bps at 2007Q2.
What can be seen in Figure 8 and Table 1 is that in 2006 Q1and Q2, the BBB tranche has the largest negative basis of about 240 and 200 basis points while in 2006 Q3 and Q4 the BBB- tranche yielded the largest negative basis of over a 100
Figure 6. RMBS assets top 5 FDIC banks (Source: FDIC Call Reports)
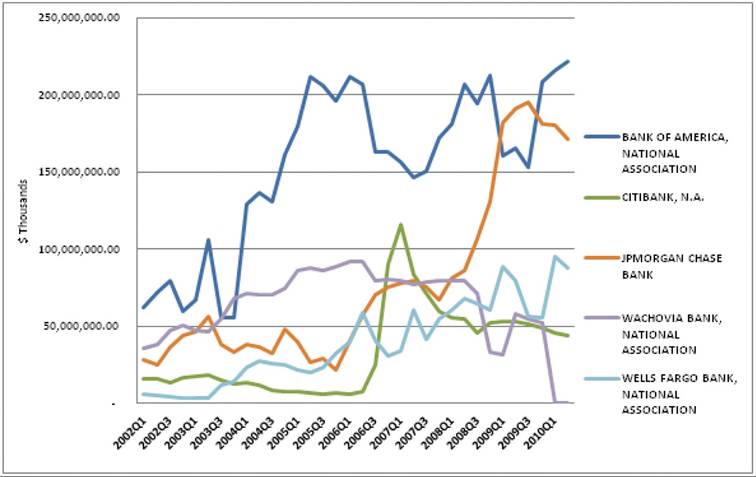
Figure 7. ABX.HE index vs. RMBS-CDO bond spread (2006Q1 to 2007Q3) (Source: Nomura, Markit [assumes 35% Constant Prepayment Rate])
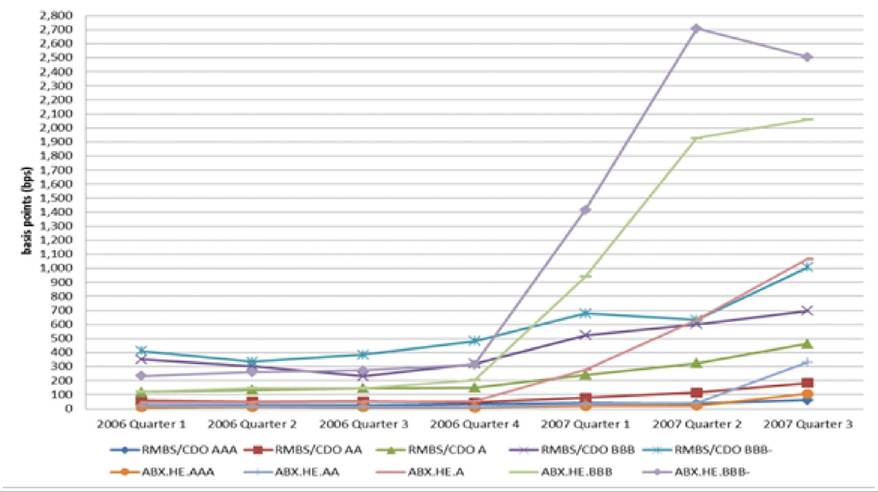
Table 1. CDS basis estimated as CDS spreads minus CDO bond spreads
| AAA | AA | A | BBB | BBB- | |
| Q1 2006 | -15.8 | -37.9 | -73.52 | -230.05 | -177.84 |
| Q2 2006 | -14.46 | -33.31 | -86.15 | -156.86 | -74.82 |
| Q3 2006 | -17.19 | -38.47 | -94.29 | -84.81 | -113.08 |
| Q4 2006 | -24.79 | -31.16 | -91.02 | -86.22 | -101.96 |
| Q1 2007 | -23.21 | -44.52 | 36.42 | 419.21 | 736.22 |
| Q2 2007 | -15.92 | -73.92 | 307.47 | 1,326.93 | 2,075.43 |
| Q3 2007 | 46.6 | 145.97 | 604.87 | 1,362.99 | 1,498.71 |
Source: CDS Spreads ABX-HE Index and CDO Bond Spreads from Nomura Fixed Income Research
Figure 8. CDS basis (2006Q1 to 2007Q3)
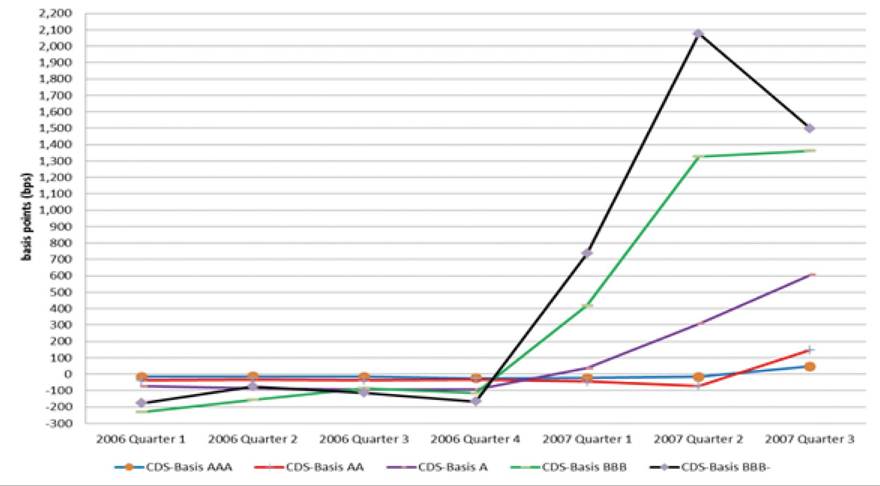
basis points. Finally, in 2007, the AA tranche yielded in small negative basis before CDS basis turned positive.
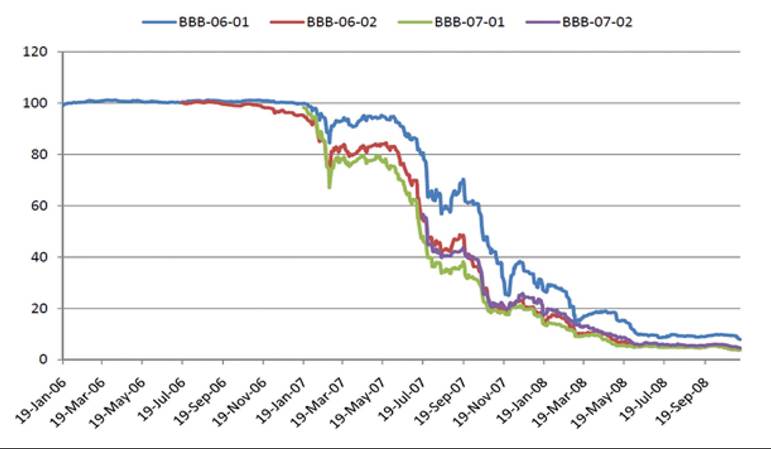
The revaluations of banks holdings of RMBS assets in this period are primarily governed by the behaviour of the prices for the BBB and BBB- tranches for the ABX-HE indexes, which started falling from November/December 2006. Up until 2006 Q4, the price of subprime synthetic RMBS was trading slightly above and close to par for the ABX.HE 2006-01 Index for all sub-indexes, after which there were substantial markdowns going forward, and the ABX-HE vintages for 2007-01 and 02 started with deep discounts for the lower tranches. This has been discussed at length by many (see, Gorton, 2009; Stanton & Wallace, 2009). The ABX-HE index prices for the BBB tranche that dominated as the most lucrative one for purposes of carry trade in 2006 is given in Figure 9. In the simulation, from 2006 Q4 end, we will apply the downgrades on the mezzanine tranches as needed.
Figure 9. The ABXE-HE index prices for BBB tranche 2006 Q1- 2007 Q4 (Source: Markit)
4. AGENT-BASED SIMULATION RESULTS
4.1. Growth of RMBS Holdings by FDIC Banks from Capital Arbitrage
The multi-agent micro-simulation methodology that aims to see how banks will respond to regulatory incentives and other well known arbitrage opportunities given market conditions starts the simulation off at an initial date at which their balance sheet data anchors their strategies. At 2006Q1, the 26 banks that the FDIC data base presents as having both RMBS and CDS activities were found to have $602.34 bn RMBS assets. Thereafter, the agents are only given the market related costs of leverage and the CDS basis and price data at the end of each quarter (items 8-9 in Table 2). The rule based strategies given in Section 3.3 are implemented for each bank at the beginning of the each quarter. The simulation outputs such as the returns/profits of the strategies are tallied up at the end of the same quarter and so are the banks’ balance sheet RMBS holdings and off balance sheet demand for CDS purchases.
Where applicable the balance sheet RMBS holding are revalued as dictated by the ABX-HE index prices. This is set out in row 3 of Table 2. Using no extraneous assumptions except those driving capital arbitrage and CDS negative carry trade, we see in Figure 10 that the simulation in the case with leverage almost exactly mirrors the actual RMBS build up on bank’s balance sheets.
The breakdown of the results is reported in Table 2. We find that the initial realized aggregate capital savings of $20.23 billion in 2006 Q1 from capital arbitrage which corresponded to CRT rules, helped kick start the CDS carry trade which netted $8.31 billion at the best negative basis for the BBB sub index of the mezzanine tranche. What is clear is that a leveraged self-financing reinvestment of the carry trade profits of $8.31 billion produced a total of $114.367 billion of funds generated in sequence (see Table 2 row 6), for the duration of the negative basis. In other words, substantial leveraging is needed for the US banking sector to grow their RMBS assets from $0.6trillion in 2006 Q1 to about $0.7 trillion in 2007 Q2. Without leverage, there is no explosive growth as seen in Figure 10. The down ward trend in RMBS hold-
Table 2. Breakdown of simulated results 2(X)6Q1 to 2007Q3 ($bns unless otherwise stated)
| 2006Q1 | 2006Q2 | 2006Q3 | 2006Q4 | 2007Q1 | 2007Q2 | 2007Q3 | |
| 1.FDIC Total RMBS | 602.335 | 635.666 | 628.525 | 705.147 | 719.629 | 709.676 | 692.162 |
| 2. SimulatedTotal RMBS Bank Assets Unleveraged Leveraged (#) | 602.335 602.335(#) | 622.574 622.574(#) | 631.566 631.845(#) | 631.595 728.136(#) | 631.596 745.487(#) | 631.596 724.452(#) | 631.596 680.573(#) |
| 3. Price Revaluation RMBS Leveraged case only | NA | NA | NA | NA | -5% BBB 06-01 - 18.96 | -10% BBB 06-01 - 37.91 | -20% BBB 06-01 75.82 |
| -25% on BBB- 06-02 = -4.29 | -10% BBB- 06-02 6.22 | -40% BBB- 06-02 13.96 | |||||
| -10% AA 07-01 = 0.03 | |||||||
| Total Loss = -23.24 | Total Loss = -44.13 | Total Loss = -89.81 | |||||
| 4.Gross Capital Savings at Quarter End | 20.23819 | 0.680 | 0.023 | 0.0008 | 0 | 0 | 0 |
| 5.Profit Negative CDS-Basis Unleveraged Leveraged (#) | N.A | 0.279 8.31220(#) | 0.0064 1.503(#) | 0.0002 0.194(#) | 0 0.0223(#) | 0 0.001(#) | 0 0 |
| 6.Leveraged funds from Negative CDS-Basis | NA | NA | 94.75921 | 17.156 | 2.187 | ||
| 7. CDS buy on 22mezzanine Tranche (outstanding) | 361.401 | 373.544 | 379.107 | 436.881 | 447.292 | 434.824 | 408.34 |
| 8.Tranche on which CDS purchased in carry trade | BBB (vintage 2006-01) | BBB (vintage 2006-01) | BBB- (vintage 2006-02) | BBB- (vintage 2006-02) | AA (vintage 2007 01) | AA (vintage 2007 01) | AA (vintage 2007-02) |
| 9.CDS-Basis (bps) | -230.05 | -156.86 | -113.08 | -101.96 | -44.52 | -73.92 | 145.97 |
| 10.US $ 3 month Libor + 180 bp + 160 bp capital charge | 8.39% | 8.91% | 8.77% | 8.76% | 8.87% | 8.76% | 9.02% |
ings in the simulated data in 2007 Q1-Q2 come entirely from the downgrades primarily on the BBB and BBB- subindexes, which were the most lucrative in the CDS trade in the earlier quarters of 2006. Table 2 row 3 explains this.
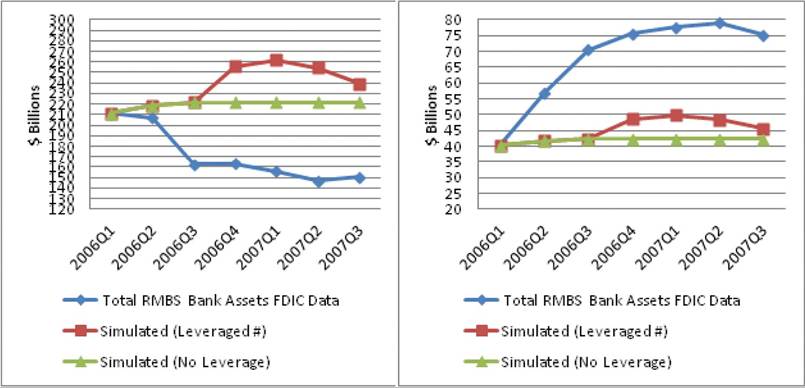
When considering how each of the banks fares, two typical cases stand out. Banks that were well established as holders of RMBS prior to 2006, such as B ank of America, suffer large downgrades in 2006 on their pre-2006 holdings, as shown in
Figure 10. Actual (FDIC data) and simulated results for banks ’ holdings of RMBS assets (2006Q1-2007Q3)
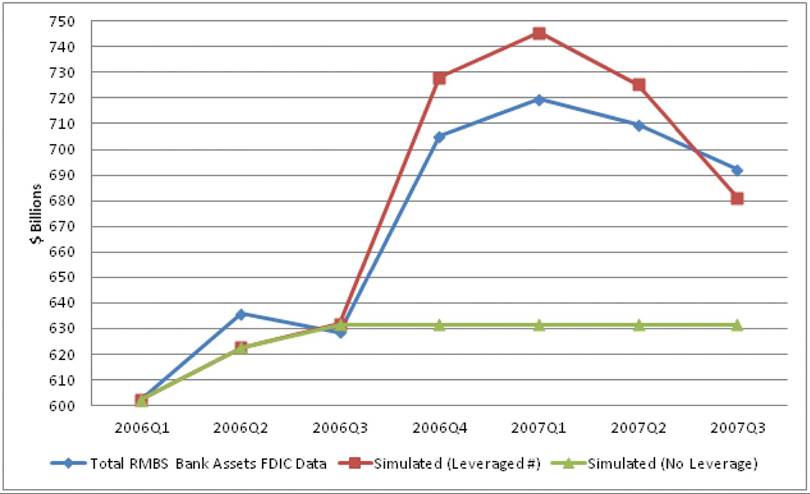
Figure 11a. This cannot be accounted for in the model that only has access to the ABX-HE price data. In contrast, JP Morgan, in Figure 11b, which
aggressively doubles its holdings from $40 billion to $75 billion by 2007Q1, the leverage being applied exceeds the one used in the simulation.
Figure 11. a) Bank of America RMBS holdings; b) J.P. Morgan RMBS holdings
5.2. Simulated Growth of CDS Demand for Capital Reduction and Network of CDS Obligations of US Banks
In Figure 3, we saw that even in 2009 Q2 FDIC banks reported quite substantial demand for CDS for purposes of capital reduction from CRT. The upshot of the simulation above is that the US banks accumulated in each quarter between $361.4 billion in 2006 Q1 to $448.6 billion in 2007 Q3 (see Table 2, row 7) of gross notional of CDS purchases in the form of credit risk mitigants to reduce capital. Note, the majority of the CDS gross notional outstanding in each quarter is bespoke and arising from pre 2006 synthetic securitization. Only about $100 bn of CDS, in keeping with our carry trade strategy, is on the ABX-HE index per se23. Remarkably, the revaluation item in Table 2 row 3 shows that in 2007Q3 a loss of $80 bn on underlying RMBS implies that all of the RMBS assets worth around $157 bn that the banks took on its balance sheets in the period 2006-07Q3 using CRT had lost all of its value. This must have triggered CDS contracts, at a minimum, with a similar net fair/market value. Of all the CDS market participants, because of the CRT scheme, banks faced threat of insolvency from double failure of both the reference RMBS assets on their balance sheets and that of their CDS protection sellers. It was the inability to meet CDS obligations by key CDS protection sellers on subprime related MBS and CDOs that led to implicit or explicit taxpayer bail-outs on the premise that these financial entities were too interconnected to fail.
As already noted, only a few, 26-32, FDIC US banks were involved in the US CDS market and the FDIC data gives their activities in their capacity as national associations rather than as global banks. Our simulations (See Table 2 row 7 and Table 3 row 2), show that CDS on RMBS contributes to only 13% of gross notional of CDS in 2006Q1 which then fell to 7% in 2007Q2.
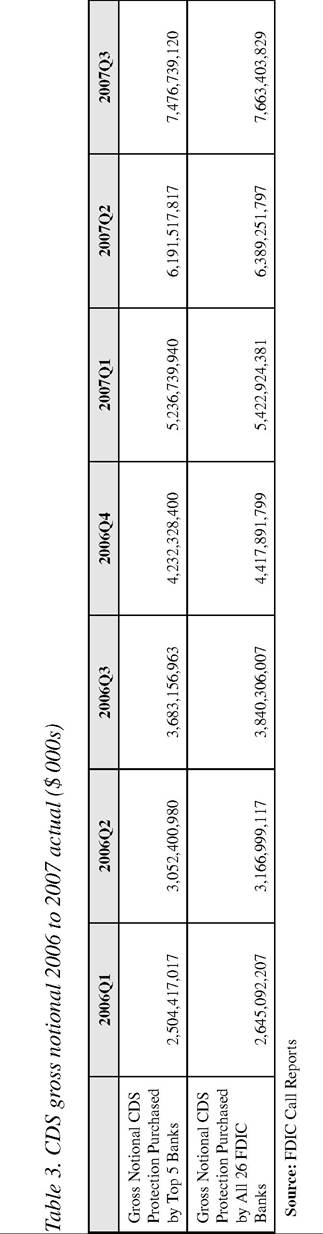
With CDS on RMBS being the fasted growing segment of credit derivatives which had gross notional valued for FDIC US banks at $2. 645 Trillion in 2006 Q1 and rising to $7.663 Trillion in 2007 Q3 (see Table 3), we will complete our analysis by coming to the heart of the rationale of CDS based CRT in Basel II and its US precursor in the Joint Agencies Rule 66 Federal Regulation No. 56914. The premise was that credit protection is spread across those better placed to do this and hence AAA financial institutions primarily in the US began to get involved in this activity. However, similar to the argument made by Darby (1994) about derivatives markets in general, many (see Lucas, et al., 2007; Das, 2010; Gibson, 2007) have noted that the benefits of CRT will be compromised by the structural concentration of the CDS protection providers. Few have provided the empirical evidence for the systemic risk consequences of what is called too interconnected to fail which arises from the heavy concentration of CDS market activity of upwards of 95% in 2006 Q3 to over 97% in 2007 within the same set of only 5 counterparties.
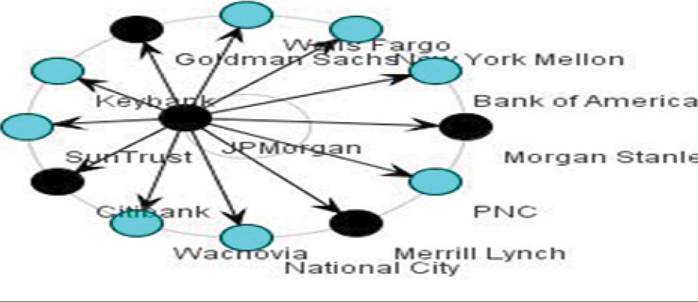
We will use the Markose et al. (2010, 2011)24 CDS network simulator which runs on the FDIC data base. The CDS network in Figure 12 is for the post Lehman 2008 Q4 period, when the network concentration was even greater than in 2007 Q4. In the empirical mapping of the CDS network based on the 26 FDIC US banks involved in the US CDS market along with the non-bank Monoline and hedge fund CDS market participants (given a calibrated 30% market share as net protection sellers), we see that the concentration of CDS market share in 5 top banks imply very high density of network connections among these banks in terms of bilateral interrelationships and the triangular clustering among them highlights a tiered structure. This can be seen in Figure 1225. The highly asymmetric nature of the empirical CDS network is manifested in the large kurtosis or fat tails in degree distribution which is characterized by a few (two banks in this case) which have a relatively large number of in degrees (up to 17) while many have only a few (as few as 1). In Figure 12, we have colour coded the net sellers (pink), the net buyers (light blue), and sole buyers (dark blue).
Figure 12. Empirically constructed CDS network for US banks and US non-banks(triangle): Empirical small world initial network (FDIC call report data of2008 Q4) (Source: Markose et al. (2010))
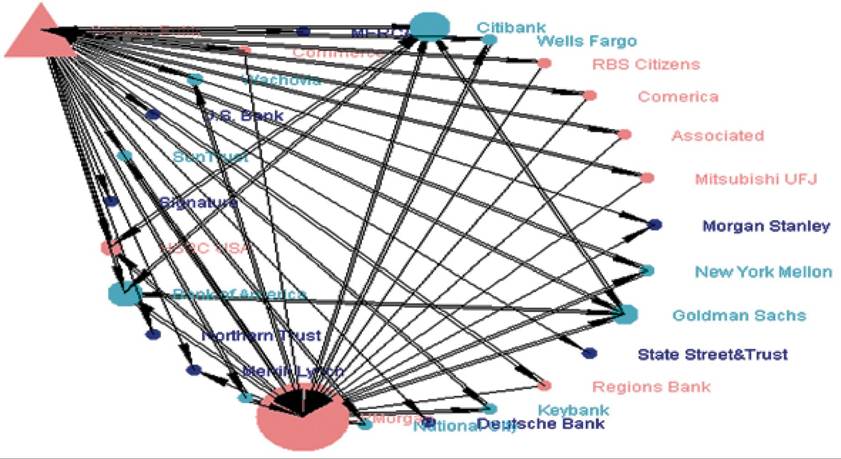
These networks manifest very different propagation of systemic risks from counterparty default than do random graphs which have been mistakenly been used for financial network modelling (see Nier, et al., 2007, for an example of simulations using random networks; and see Craig & von Peter, 2010, for an empirical study of the presence of tiered financial networks with market share concentration).
Using the Tier 1 capital reported by these banks in the FDIC call reports, we find that default of any of the top 5 banks based on their bilaterally netted fair value CDS obligations will result typically in the failure of those banks that are highly interconnected amongst themselves. The contagion stops at this point with it being confined to the top hierarchy (as shown in Figure 13) but in the spirit of being too interconnected to fail, the top banks (black nodes in Figure 13) are brought down when any other member of this group collapses. Clearly, the implicit socialized losses of capital from bank failure with such a topological concentration of counterparties with high CDS market share is very large as top banks also account for some 43% of Tier 1 capital ($430 bn) of the 26 banks in the sample.
6. CONCLUSION
This chapter has provided an exemplar of how publicly available financial firm level FDIC type data bases are to be accessed and ‘fed’ into Multi-Agent Financial Network (MAFN) models to help monitor perverse incentives from policy and systemic risk from a topological perspective especially in risk sharing derivatives institutions.
We fully concur with the Blundell-Wignall and Atkinson (2008) dictum that “understanding causality is a precondition for correct policy making.” The question is what methodologies can investigate causality especially in the context of the impact of policy incentives? We have argued that in the design of robust financial regulation a more rigorous ‘wind tunnel’ testing platform and also a means of monitoring policy for perverse incentives in an ongoing way is needed over and above what extant macro or cross sectional econometric models can achieve. In the latter equations have to be estimated, while in ACE the cost benefit calculations are algorithms for banks to implement. Permissible capital arbitrage refers to the least amount of regulatory capital that a bank can hold given market conditions and the myopic cost benefit analysis. At least since the BCBS paper of Jackson et al. (1999) on the impact of the Basle Accord capital requirements on bank behaviour, numerous empirical studies based on econometrics or simple charts and graphs have been undertaken. Few if any of these papers make assessments, in any joined up way, of the impact of regulatory incentives for banks to reduce capital from 8% to 1.6% through the use of CDS. Certainly, the development of large-scale computational agent based models that can directly access data from the financial databases was not considered. From a data stand point MAFN models could have been set up for the US banks from 2003 when FDIC Call Reports had publicly available data on all RMBS holdings (broken down in some detail) and CDS activity (not broken down into product classes). However, the data on the crucial question on purchased CDS protection that is recognized as a guarantee for regulatory capital purposes (FDIC Call Report code RCFDG404) did not get reported till 2009 Q2.
Figure 13. Instability propagation in clustered CDS network (NB: Black nodes denote failed banks with successive concentric circles denoting the q-steps of the knock on effects. Here q is 1. Source: Markose et al. (2010))
In agent-based models, rule following behaviour as in complying with the regulation and the conduct of carry trade activity are relatively easy to implement. This is because unlike fully-fledged adaptive behaviour, agents’ strategies, intelligence, and autonomy are limited to following the letter of the law and strictly verifying conditions for which the most profitable arbitrage applies. The modeler, however, faces the challenge of understanding the regulation, provide market conditions for the triggers that need to be followed in a carry trade and then implement the agents’ strategies in an algorithm. We have confined the simulation to the 2006-07 period and restricted the maximum of capital savings in the context of replicating the ABX-HE index. We reiterate that the pursuit of CDS negative carry trade was not the main objective of the banks’ strategy but the side effects of the pursuit of capital reduction from the CRT scheme of Basel II. There is clear evidence that the bonanza of the rapid growth of banks’ holdings of RMBS and CDS purchases during the 2006-7 period required capital savings from CRT, which we estimate to be about $20bn. The simulation shows that with the application of leverage, RMBS assets for the 26 FDIC banks (viz. those that also reported CDS purchases) peaked at about $750bn in 2007 Q1 (see Table 2 row 2). Maximizing capital savings and minimizing risk- weighted assets are two sides of the same coin. The $750bn or so of banks’ RMBS assets in 2007 Q1, which we simulated given the regulation on risk weighting, implies risk weighted assets of $60 bn and a meagre Tier 1 capital of $4.8 bn. The fact that $4.8 bn constitutes 8% of risk weighted assets is highly misleading when it is less than 1% of total assets. The latter, ofcourse, corresponds to the buffer needed to cover for probable losses from AAA assets.
Gibson (2007) said: “One fundamental reality of credit derivatives is that they do not eliminate credit risk. They merely shift it around. As a result, when the credit cycle turns and default rates rise, someone, somewhere, will lose money.” Basel II and III scheme of CRT suffers from the fallacy of composition in that removing credit risk from banks’ balance sheets which is good thing from the perspective of the bank (at least for capital savings and short run asset expansion)-the systemic risk consequences of high concentration of counterparties was not quantitatively modeled and visualized. The automated Markose et al. (2010, 2011) network visualizer that uses concentration and market share statistics to calibrate the degree distribution and the actual fair value flows show that Gibson (2007) is far off the mark about who will lose money and the nature of systemic risk. Quite simply a threat to any of the top 5 US banks is an immediate threat to the other four. The network topology where the very high percentage of exposures is concentrated among a few highly interconnected banks implies that they will stand and fall together. Hence, the implied socialized losses are very large and the CDS network structures cannot be supported by a capital base, which is eroded by CRT leveraged asset growth.
In a data base driven multi-agent model of the US financial sector, a banks’ balance sheet and off balance sheet activities is a vector and form multi-level networks. For instance, even for purposes of this simulation, as noted by Gorton (2009a) the leveraged funds used by banks (and non-banks) was raised in the repo market. It will be interesting to see how the FDIC banks’ repo data will fit in with the simulated demands for leveraged funds from this exercise. Full developments of large-scale MAFN models as hyper-networks (see, Johnson, 2006, 2011) are only at its infancy. Integration and automation of financial data bases in an ACE framework aims to transform the data from a document or record view of the world to an object-centric view (see Balakrishnan, et al., 2010), where multiple facts about the same real-world financial entity are accessed to give a composite visualization of their interactions with other such entities in a scalable way. Based on the above discussions, for purposes of monitoring impact of policy and to detect perverse incentives, we recommend a financial data base driven, constructive or computational modeling of strategies, regulatory frameworks and the analysis of the stability of financial systems done in terms of network stability.
References
Acharya, V., & Richardson, M. (2010). Causes of the financial crisis. Critical Review, 21(2), 195-210. doi:10.1080/08913810902952903
Alessandri, P., & Haldane, A. (2009). Banking on the state. Paper presented at the Federal Reserve Bank of Chicago, 12 International Banking Conference. Chicago, IL.
Balakrishnan, S., Chu, V., Hernandez, M., Ho, H., Krishnamuthy, R., & Liu, S. et al. (2010) Midas: Integrating public financial data. In Proceedings of the 2010 International Conference on Management of Data. Management of Data.
Blundell-Wignall, A., & Atkinson, P. (2008). The subprime crisis: Causal distortions and regulatory reform. In P. Bloxham & C. Kent (Eds.), Lessons from the Financial Turmoil of 2007 and 2008, Proceedings of a Conference held at the H.C. Coombs Centre for Financial Studies. Kirribilli, Australia: Reserve Bank of Australia.
Brunnermeier, M., Crockett, A., Goodhart, C., Persaud, A., & Shin, H. (2009). Thefundamental principles offinancial regulation. Geneva Reports on the World Economy 11. Geneva, Switzerland: International Center for Money and Banking Studies.
Buchanan, M. (2009). Meltdown modelling: Could agent-based computer models prevent another financial crisis? Nature, 460, 680-682. doi:10.1038/460680a PMID:19661889
Buiter, W. (2009). The unfortunate uselessness of most ‘state of the art ’ academic monetary economics. Retrieved from http://www.voxeu.org/index. php?q=node/3210
Cannata, & Quaglianello. (2009). The role of Basel II in the subprime financial crisis: Guilty or not guilty? CAREFIN Working Paper 3.09. Bocconi, Italy: University of Bocconi.
Choudhry, M. (2004). The credit default swap basis: Analysing the relationship between cash and synthetic credit markets. Journal of Derivatives Use. Trading and Regulation, 10(1), 8-26.
Choudhry, M. (2005). Further observation on the credit default swap basis: An illustration of the impact of supply and demand in the structured finance market. Retrieved from http://www. YieldCurve.com
Choudhry. (2006a). The credit default swap basis: Illustrating positive and negative basis arbitrage trades. Retrieved from http://www.YieldCurve. com
Choudhry. (2006b). The credit default swap basis. London, UK: Bloomberg Press.
Colander, D., Howitt, P., Kirman, A., Leijon- hufvud, A., & Meherling, P. (2008). Beyond DSGE models: Toward an empirically based macroeconomics. The American Economic Review, 98, 236-240. doi:10.1257/aer.98.2.236
Craig, B., & von Peter, G. (2010). Interbank tiering and money center bank. BIS Working Paper No. 322. Basel, Switzerland: BIS.
Darby, M. (1994). Over the counter derivatives and systemic risk to the global financial system. NBER WP No. 4801. NBER.
Das, S. (2010). Credit default swaps - Financial innovation or financial dysfunction. Banque De France Financial Stability Report, No. 14, Derivatives. Paris, France: Banque de France.
Deng, Y., Gabriel, S., & Saunders, A. (2010). CDO market implosion and the pricing of subprime mortgage- backed securities. Journal of Housing Economics, 20(2), 68-80. doi:10.1016/j. jhe.2010.10.001
Duffie, D. (1999). Credit swap valuation. Financial Analysts Journal, 55, 73-87. doi:10.2469/ faj.v55.n1.2243
Eichengreen, B. (2010). Globalization and the crisis. CESifo Forum, 11(3), 20-24.
European Central Bank. (2004). Credit risk transfer by EU banks: Activities, risks and risk management. Frankfurt, Germany: Banking Supervision Committee of the European System of Central Banks.
Federal Reserve Board. (2006). Basel II capital accord: Notice of proposed rulemaking (NPR). Retrieved from http://www.federalreserve.gov/ generalinfo/basel2/npr_20060905/npr/section_1. htm
Fricke, D., & Lux, T. (2012). Identifying a coreperiphery structure in the Italian interbank market. Kiel, Germany: Kiel Institute for the World Economy.
Gibson, M. (2007). Credit derivatives & risk management. Financial and Economics Discussion Paper 2007-47. Washington, DC: Federal Reserve Board.
Goderis, B., Marsh, I. J., & Wagner, W. (2007). Bank behaviour with access to credit risk transfer markets. B ank of Finland Discussion Paper4/2007. Helsinki, Finland: Bank of Finland.
Gorton, G. (2009). The subprime panic. European Financial Management, 15(1), 10-46. doi:10.1111/j.1468-036X.2008.00473.x
Gorton, G., & Metrich, A. (2009). Securitized banking and the run on repo. NBER Working Paper 15223. Retrieved from http://econpapers. repec.org/RePEc:nbr:nberwo:15223
Haldane, A. G. (2009). Rethinking the financial network. Paper presented at the Financial Student Association. Amsterdam, The Netherlands.
Hamerle, A., Liebig, T., & Schropp, H.-J. (2009). Systematic risk of CDOs and CDO arbitrage. Deutsche Bundesbank Discussion Paper Series 2: Banking and Financial Studies No 13/2009. Berlin, Germany: Deutsche Bundesbank.
Hellwig, M. (2010). Capital regulation after the crisis: Business as usual? CESifo DICE report. Journal for Institutional Comparisons, 8(2).
Hu, J. (2007). Assessing the credit risk of CDOs backed by subprime securities: Ratings analysts’ challenges and solutions. Mimeo Senior VP of Moodys. New York, NY: Moodys.
Hull, J., Predescu, M., & White, A. (2004). The relationship between credit default swap spreads, bond yields, and credit rating announcements. Journal of Banking & Finance, 28(11), 27892811. doi:10.1016/j.jbankfin.2004.06.010
Jackson, P., Furfine, C., Groenveld, H., Hancock, D., Jones, D., & Perraudin, W.... Yoneyama, M. (1999). Capital requirements and bank behaviour: The impact of the Basel Accord. Working Paper Number 1. Basel, Switzerland: Basel Committee on Banking Supervision.
Johnson, J. (2006). Hypernetworks for reconstructing the dynamics of multi-level systems. Paper presented at European Conference on Complex Systems. Oxford, UK.
Johnson, J. (2011). Hypernetworks in the science of complex systems. New York, NY: World Scientific Publishing.
Jones, D. (2000). Emerging problems with the Basel capital accord: Regulatory capital arbitrage and related issues. Journal of Banking & Finance, 24, 35-58. doi:10.1016/S0378-4266(99)00052-7
Lall, R. (2009). Why Basel II failed & why any Basel III is doomed. Working Paper 2009/52. Oxford, UK: Oxford University.
Lucas, D., Goodman, L. S., & Fabozzi, F. (2007). Collateralized debt obligation and credit risk transfer. Yale ICF Working Paper No. 07-06. New Haven, CT: Yale University.
Markose, S. (2011) Multi-agent financial network analyses for systemic risk management post 2007 financial crisis: A new complexity perspective for G10 and BRICs. Paper presented at the Reserve Bank of India Financial Stability Division. New Delhi, India.
Markose, S. (2012). Systemic risk from global financial derivatives: A network analysis of contagion and its mitigation with super-spreader tax. Unpublished.
Markose, S., Giansante, S., & Shaghaghi, A. R. (2011). Too interconnected to fail: Financial network of US CDS market: Topologicalfragility and systemic risk. Unpublished.
Markose, S. M. (2005). Computability and evolutionary complexity: Markets as complex adaptive systems (CAS). The Economic Journal, 115, F159- F192. doi:10.1111/j.1468-0297.2005.01000.x
Markose, S. M., Giansante, S., Gatkowski, M., & Shaghagi, A. R. (2010). Too interconnected to fail: Financial contagion and systemic risk in network model of CDS and other credit enhancement obligations of US banks. Essex, UK: University of Essex.
Moussa, A. (2011). Contagion and systemic risk in financial networks. (PhD Dissertation). New York, NY: Columbia University.
Nier, E., Yang, J., Yorulmazer, T., & Alentorn, A. (2007). Network models and financial stability. Journal of Economic Dynamics & Control, 31(6), 2033-2060. doi:10.1016/j.jedc.2007.01.014
Persuad, A. (2002). Where have all the financial risks gone? Retrieved from http://www.gresham. ac.uk/lectures-and-events/where-have-all-the- financial-risks-gone
Stanton, R., & Wallace, N. (2009). ABXE-HE indexed credit default swaps and the valuation of subprime MBS. Fisher Center Real Working Paper. Berkeley, CA: University of California.
Stulz, R. (2010). Credit default swaps and the credit crisis. The Journal of Economic Perspectives, 24(1), 73-92. doi:10.1257/jep.24.1.73
(2006). InTesfatsion, L., & Judd, K. (Eds.). Handbook of computational economics: Vol. II. Agentbased computational economics. Amsterdam, The Netherlands: Elsevier.
Upper, C. (2011). Simulation methods to assess the danger of contagion in interbank markets. Journal of Financial Stability, 7(3), 111-125. doi:10.1016/j.jfs.2010.12.001
Upper, C., & Worms, A. (2004). Estimating bilateral exposures in the German interbank market: Is there a danger of contagion? European Economic Review, 48(4), 827-849. doi:10.1016/j. euroecorev.2003.12.009
Wieland, V. (2010). Model comparisons and robustness: A proposal for policy analysis after financial crisis. In R. M. Solow, & J.-P. Touffut (Eds.), What’s Right with Macroeconomics? Cheltenham, UK: Edward Elgar.
ENDNOTES
Alessandri and Haldane (2009) have estimated US, UK, and European tax payer bailout of key financial intermediaries since 2007 and prior to the May 2010 Eurozone sovereign debt crisis to have reached unprecedented amounts of over $14 trillion. Of the $8.5 trillion mortgage backed securities (see Figure 1) over 85% of outstanding $2 Trillion CDOs at its peak in 2007 (see, Figure 2) was collateralized by MBS and about half of this was subprime RMBS. Gorton (2009, Table 4) shows how of the total of $2.5 trillion subprime mortgages since 2001, $1.25 trillion was originated in 2005-6 alone and over 85% was securitized. Note this is in addition to the $142 billion of RMBS purchased by the US Treasury Department during October 2008 - December 2009.
CDS involve a bilateral contract between a buyer and the CDS protection seller who pays the buyer the gross notional value of the reference asset less the recovery rate at the time of the credit event, which is typically default. The CDS buyer pays periodic premia called the CDS spread.
Cannata and Quaglianello (2009) seem to have some misconceptions about the factors behind the genesis of the modifications to Basel I with risk weighted capital requirements and the role of the US in initiating them as early as 1999, as they go on to state: “Basel II, our suspect, was not on the crime scene or, rather, showed up later. In the United States, the epicentre of the financial crisis, the introduction of the new prudential discipline has been postponed (so far) to 2010 and will involve a limited number of banks. In Europe, the actual use of the new rules was very limited in 2007, when the crisis erupted. Indeed, most banks exploited the provisions of the Capital Requirements Directive (which implemented Basel II in the EU) which allowed them to defer to 2008 the application of the new Framework.... The financial turbulence occurred under the “old” Basel framework, making very palpable its shortcomings, particularly its low risk-sensitivity and the scarce adaptability to financial innovation.” Lall (2009) and Blundell-Wignall and Atkinson (2008) say banks began to adapt to the new regulatory incentives from 2004.
Network models have been scrutinized for their use in financial contagion and crisis management at the recent ECB Workshop on Recent Advances in Modelling Systemic Risk Using NetworkAnalysis, 5 October2009 and at the IMF Workshop On Operationalizing Systemic Risk Monitoring 26-28 May 2010. See also the June 2010 Conference
Report on Frameworks For Systemic Risk Monitoring organized by Alan King, John Lietchy, Clifford Ross, and Charles Taylor. Sheri Markose and Simone Giansante were contributors to the first two workshops and are currently involved in MAFN models for the digital mapping of the Indian financial
10
system to monitor system risk. See also Markose (2012) which is based on the talk at the IMF on 7 December 2011 on “Systemic Risk From Global Financial Derivatives: A Network Analysis of Contagion and Its Mitigation With a Super-spreader Tax.” Here, it is shown how negative externalities in the way of systemic risk from the failure of highly interconnected financial intermediaries can be measured and penalized using the eigenvector centrality measure. These sources can be referred to for details on financial networks, which are omitted in this chapter.
The 2006 Q 4 BIS Report on CDS protection buyers and sellers showed that 49% of protection selling in the CDS market was done by non-bank entities. At the end of 2007, the capital base of Monolines was approximately $20 bn and their insurance guarantees are to the tune of $2.3 tn implying leverage of 115.
The FDIC Call Report code for this is RCFDG404.
Assuming a capital charge of 4% on RMBS assets without CDS cover, the capital charge is 1.6% with AAA CDS cover, the savings are 240 basis points. How much asset accumulation can be leveraged from this capital savings depends on the capital charge and the interest rates. This is discussed in Section 3.3.
Fed Reserve Board Basel II Capital Accord Notice of Proposed Rulemaking (NPR) and Supporting Board Documents Draft Basel II NPR - Proposed Regulatory Text - Part V Risk-Weighted Assets for Securitization Exposures March 30, 2006 http://www. federalreserve.gov/GeneralInfo/basel2/ DraftNPR/NPR/part_5.htm. See also Federal Register Vol. 71, No. 247, Dec 2006, Proposed Rules and Basle Committee for Banking Supervision.
11
12
13
14
15
16
The answer to question C regarding US FRB supervisory rule No. SR 99-32 dated 15 November 1999 in its final form which was implemented in January 2002 gives an explanation of the capital treatment of synthetic collateralized loans. This can be found at www.federalreserve.gov/board- docs/srletters/2002/SR0216a1.pdf.
The related document is Capital Interpretations Synthetic Collaterized Loan Obligations at http://www.occ.treas.gov/news- issuances/bulletins/1999/bulletin-1999-43. html
In a Moody’s report, Hu (2007) notes that the AAA tranche of the CDO accounts for 85% of the dollar value starting from about 1999.
Choudhry (2004, 2006a, 2006b) provides strong evidence of continuous arbitrage opportunities in the credit risk markets in general. For example as of October 2006, a third of the 150 actively traded US corporate bonds studied had a negative CDS basis of above 10bps with some trading at a basis in excess of 30bps. Choudhry (2005), further notes that whilst positive basis tend to exist in conventional credit markets, prolonged negative basis are prevalent in structured finance and asset-backed securities markets. This allocation follows the typical ABX-HE tranche allocations at issuance where the senior tranche equates to the AAA rated band. See Table 4 in Stanton and Wallace (2009). This assumption is also made by Nomura Fixed Income Research in the release “The CMBX: The Future is Here” March 23, 2006. We will only revalue using the ABX-HE prices, the tranches constituted post 2006. The pre-2006 tranches which suffered downgrades especially for the vintages of 1999-2001 (see, Hu, 2007) will not be revalued in the 2006-7 period. This will cause overvaluations of RMBS holding for
17
18
19
20
early entrants to the structured finance CDO market such as Bank of America and HSBC. In the Appendix, we give the FDIC Schedules and codes from which the data was extracted. Note during this period there was also an explosion in both RMBS issuance and reported residential loan origination by Citibank, N.A. RMBS issuance by Citibank increased from US$1.3bn in 2006Q3 to a peak of US$579.5bn by 2007Q1. The total notional outstanding on residential mortgage loans over the same period rose by over ten times its 2006Q3 level of US$20.2bn to its 2007Q4 peak of US$205.7bn. This coincided with the massive restructuring which commenced in October of 2006 and saw the consolidation of Citibank, FSB, Citibank (West) FSB, formerly California Federal Bank and Golden State Bank, Citibank, Texas, N.A., Citibank Delaware, Citibank Banamex USA formally California Commerce Bank and Citicorp Trust, N.A. (California) into Citibank, N.A. Prior to this restructure Citibank, N.A., the original Citibank, had primarily served New York State and the New York metropolitan area.
The $20.238 bn capital is released from use of CDS on the assumption that RMBS is structured in a 40/60 ratio in senior and mezzanine tranches, resulting in a 240 basis point savings in the first and a 400 basis point savings for the second.
The carry trade profit is calculated for the mezzanine tranche which is 60% of $602.335
21
22
23
24
viz. $333.90 bn. The negative basis is on this is -230 basis points (row 10 in Table 2) which gives $8.31 bn as profits at the end of 2006 Q2.
$94.759bn is the self-financing leverage generated from the $8.31bn profits (see, row 6 of Table 2) by dividing it by the cost of leveraging which is 8.91%in 2006 Q2.
The figures for Table 2 row 6 is obtained by taking 60% of the leveraged RMBS items in row 2.
In principle, CDS purchased for CRT by banks replicating ABX-HE tranches should not be offset bilaterally with a mirror CDS sale with their CDS protection seller and hence the gross notional applies. Stanton and Wallace (2009) Table 1 report the total 2006-07 CDS gross notional on the ABX- HE to be around $146 bn.
Markose et al. (2011) use the same calibration for network connectivity as in Markose et al. (2010) based on market shares of CDS gross notional of banks but the bilateral flows between banks are determined by Gross Negative Fair Value for CDS payables and Gross Positive Fair Value for receivables
given in FDIC Call Reports for each of these banks.
We found empirical the clustering coefficient to be around 92% and the connectivity (i.e. probability of any two banks being connected to be 12%).
This work was previously published in Simulation in Computational Finance and Economics, edited by Biliana Alexandrova- Kabadjova, Serafin Martinez-Jaramillo, Alma Lilia Garcia-Almanza, and Edward Tsang, pages 225-254, copyright 2013 by Business Science Reference (an imprint of IGI Global).
APPENDIX
Items 1 and 2 listed under Schedules RC-B relate to the on balance sheet holdings of RMBS securities by the banks. These are the vanilla pass-through notes as well as the structured notes such as collateralised mortgage obligations held by the banks. Item III Schedule RC-L - Derivatives and Off-Balance Sheet Items starting from RCFDA535 gives the CDS data for the FDIC banks.
1. Schedule RC-B: Securities
Item:
Item 4: Mortgage-backed securities (MBS)
Subsection:
a. Residential mortgage pass-through securities
Description:
1. Guaranteed by GNMA
2. Issued by FNMA and FHLMC
3. Other pass-through securities
(Column B) Held-to-maturity Fair Value
(Column D) Available-for-sale Fair Value
2. RC-Code(s): RCFD/RCON1699, RCFD/RCON1702, RCFD/RCON1705, RCFD/RCON1707, RCFD/RCON1710, RCFD/RCON1713
Subsection:
b. Other residential mortgage-backed securities (include CMOs, REMICs, and stripped MBS):
Description:
1. Issued or guaranteed by FNMA, FHLMC, or GNMA
2. Collateralized by MBS issued or guaranteed by FNMA, FHLMC, or GNMA
3. All other residential MBS
(Column B) Held-to-maturity Fair Value
3. Schedule RC-L: Derivatives and Off-Balance Sheet Items
Item:
Item 7: Credit derivatives
Subsection:
b. Notional amount of credit derivatives on which the reporting bank is the beneficiary (2002Q2 to 2005Q4)
RC-Code(s): RCFDA535
Item:
Item 7: Credit derivatives
Subsection:
a. Notional amounts: (2006Q1 to 2010Q2)
Description:
1. Credit default swaps
RC-Code(s): RCFDC/RCONC969
Subsection:
b. Gross fair values: Gross positive fair value
RC-Code(s):RCFDC/RCONC221
Subsection:
c. Notational amounts by regulatory capital treatment
Description:
All other positions: Purchased protection that is recognized as a guarantee for regulatory capital purposes
RC-Code(s): RCFDG/RCONG404
Section 3
Organizational and Social Implications
This section considers risk in Banking, Finance, and Accounting, and how the human element of financial decisionmaking can both support and hinder the process. Ultimately, finance relies on people: the investors and professionals who make everyday decisions that have the potential to change the economies of nations. Only with careful consideration of risk, investor perceptions, and technological integration in portfolio management can international firms thrive in a global, multicultural environment. In these 16 chapters, readers will find an in-depth discussion of some of the most pressing organizational and social implications of Banking, Finance, and Accounting.
592