Chapter 61 An Uncertain Decision Making Process Considering Customers and Services in Evaluating Banks: A Case Study
Fatemeh Akbari
Mazandaran University of Science and Technology, Iran
Hamed Fazlollahtabar
Iran University of Science and Technology, Iran
Iraj Mahdavi
Mazandaran University of Science and Technology, Iran
ABSTRACT
In today’s changing environment two properties are required to service namely good relation with customers and service quality.
Nowadays no organization can get great achievement unless it can attract sufficient customers providing better service quality is important for service firms. This paper proposes a novel combined approach utilizing group decision making process to evaluate and rank criteria influencing the customer relationship management and service quality of four banks in Iran based on fuzzy decision making trial and evaluation laboratory (Fuzzy DEMATEL) and fuzzy analytic network process (Fuzzy ANP). Defuzzification of decision makers’ judgments is handled by Converting Fuzzy data into Crisp Scores (CFCS) method. Fuzzy DEMATEL is applied to deal with inner dependencies among criteria. Fuzzy ANP is used to compute final ranking of four banks as an empirical example. An empirical study is presented to illustrate the application of the proposed method.DOI: 10.4018∕978-1-4666-6268-1.ch061
.
1. INTRODUCTION
The financial stability of a country is an important prerequisite towards economic growth. If a country wishes to attract investments must have a solid and profitable banking branch of the financial services industry (Goosen et al. 1999). The banking branch of the financial services industry, are central to the overall performance of the economy and perform functions which affecting all aspects of other sectors of the economy. The fact banks have a fragile and risky structure makes it inevitable to follow-up their structures and their efficiencies continuously. Banks’ non-financial performances through the criteria such as service quality, customer satisfaction are also important and must be measured for all stakeholders for more profitability.
Hussain and Gunasekaran (2002) summarized some main reasons for non -financial performance. These reasons are as follows: competition pressure, technological and economic developments, and legal regulations within top managements, socioeconomic and political situation, top management and corporate culture. One of the important tools of the management’s control function based on nonfinancial performance is the measurement of service quality to improving performance and upgrading customer satisfaction.
Many service firms experience problems with their service quality because unique nature of service is not physical. In order to minimize these problems, it is necessary to truly understand the terms quality, service quality and the dimensions of service quality. Additionally, it is obvious that superior CRM (customer relation management) may possibly increase firms’ levels of service quality. Therefore, firms must to equip themselves with the necessary knowledge regarding this new business concept. Through effective CRM strategies and high levels of service quality, customers will receive the manner and level of service delivery for increasing the success of the service provider.
1.1. Customer Relation Management
As CRM is a strategic approach incorporating a process of maintaining valuable, long term relationships with clients, it provides the firm with an enhanced opportunity to understand its clients (Christopher et al., 2002). An improved opportunity for organization to understanding their clients is provided by CRM strategy and it is an efficiency approach incorporating long term relation with clients (Christopher et al., 2002). The relationship between a bank and its clients is very important to both parties, as the bank is entrusted with a scarce resource of the client, which must be managed in the client’s best interest to ensure support for the bank (Goosen et al. 1999). Gosney and Bohem (2001) get reasons that a CRM strategy has numerous aspects but the basic theme is for a company to become more customer-centric.
Anton and Petouhoff (2001) found that primary reason that customers don’t have desire to keeping on doing business with a particular company is a poor customer service.It is therefore important for banks to gain knowledge regarding the variables that can possibly influence its CRM. (Gilbert & Choi., 2003) advocates: “In banks a successful CRM strategy cannot be implemented by only installing and integrating software packages. If a bank develops and sustains a solid relationship with its customers, its competitors cannot easily replace them and therefore this relationship provides for a sustained competitive advantage.”
Most researchers have considered using CRM for improving financial services. Peppard (2000) integrated information technology and CRM for improving banks’ services. Rigby and Ledingham (2004) studied a broad range of companies that they have had a successful CRM system and defined important key factors for implementing CRM strategy in organizations. Reinartz et al. (2004) conceptualized the process of CRM implementation and showed CRM process is positively linked to performance. Kim et al. (2010) emphasized technology for the successful implementation of an enterprise wide CRM strategy in retail banks.
1.2. Importance of Service Quality
More choice and awareness is growing therefore customer expectations are increasing and they demand better service quality. The quality of service has become a strategic instrument for evaluating the firms’ performance and also it is one of the most dominant themes of research in services (Fisk et al., 1993; Donnelly et al., 1995).In fact, service quality has become a great differentiator, the most powerful competitive weapon which many leading service organizations possess (Berry et al., 1988).
The key purpose of service quality is managing clients by identifying, satisfying and retaining the most profitable clients and generating better results for firms. Parasuraman etal. (1985) revealed that consumers generally use similar criteria in evaluating service quality in special industry.
These service quality perceptions result from a comparison of clients expectations with actual service performance. Rust and Oliver (1994) emphasized that understanding how customers view service quality is essential to the effective management of a service firm (Fazlollahtabar et al., 2012; Jaggi et al., 2011; Jajimoggala et al., 2011).Banks have come to accept the view that it is the quality of service that may better recognize them over the long run and because of this, the correct appraisal of bank service quality will be a necessary topic. Service quality impact the operation of banks, because service quality conditions influence a firm’s competitive advantage by identifying, satisfying and retaining clients and with this comes profitability (Morash & Ozment, 1994).
Researchers documented several approaches for measuring customer perceptions of service quality and satisfaction with banks (Avkiran, 1994; Bahia & Nantel, 2000; Cronin & Taylor, 1992). Some scholars and practitioners have applied this instrument in retail banking sectors (Taylor & Baker, 1994; Lam, 1995; Newman, 2001; Clemes & Zhang, 2010).
The review of literature reveals that banks face many challenges and they are influenced by many different variables. Banks’ success, and therefore the growth of the national economy, may depend on their levels of CRM and service quality, which in return may be influenced by other criteria. As a consequence in this paper we consider both customer relationship management and service quality with their related factors.
As previously mentioned, it is clear that evaluating banks is important and complex because this problem needs the number of attributes. These attributes may be intangible or non-monetary beside the monetary goals. This problem is very important for managers. The multi-criteria decision making (MCDM) approach is appropriate for evaluating service quality expectation. In such a system like banking that has decision units including several inputs and outputs, all criteria which might influence the performance must be integrated and examined at the same time and in the same system.
Although it seems quite simple and feasible, it is most of the time impossible to settle all the criteria on the same basis and turn them into a joint unit which can refer to the same value. By the help of MCDM methods, manager is able to acquire quick information (feedback) about advantages of the asset allocation. Consequently, every specific requirement of a contract can be reflected by the applied methods (Sharkey et al., 2011; Khalili-Damghani et al., 2012; Strang, 2012).Most researchers have employed techniques in both crisp and fuzzy environment and also this technique has become a popular and common tool in literature at least in this problem. Sccmc et al. (2009) proposed a fuzzy multi-criteria decision model to evaluate the performances of Turkish banks.Some authors used the multi criteria decision method for the measurement of bank performances and examined the relation between financial and operating performances. (Lee et al., 1995; Suwignjo et al., 2000; Wang et al., 2004; Frei and Harker, 1999). Yurdakul and I' (2004) analyzed the bank performances using AHP with the financial and non-financial performance criteria in credit risk assessment. Albayrak and Erensal (2005) analyzed the financial and non-financial performance criteria for the performance evaluation of Turkish banks using fuzzy MCDM.
The usual AHP method has often been criticized, due to its use of unbalanced scale of judgments and its inability to sufficiently handle the uncertainty and imprecision in the pair-wise comparison process (Deng, 1999). Therefore, for solving this difficulty many AHP methods and applications are proposed in fuzzy environment titled fuzzy analytical hierarchy process (Fuzzy AHP) by different authors. For example, Che et al. (2010) used fuzzy AHP for making bank loan decisions to choose the important index in loaning evaluation, establish one complete and efficient loaning decision-making module with its weights.
Research indicates customers are vital for business and banking industry in Iran has to go a long way in meeting the changing needs and demands of customers.
These dissatisfactions have many reasons from economical to political, principles to complicated tools for customer satisfaction, from legislation to implementation. By reviewing literature of the CRM and service quality practices the scholar would be able to find out suitable tools and techniques which would improve banking sector performance.However, the service quality expectation is always approached in uncertain environment and is highly affected by subjective judgments that are vague and imprecise. On the other hand, MCDM methods are often criticized for their inability to adequately deal with the uncertainty and imprecision associated with the mapping of the decision makers’ perception to crisp numbers (Deng, 1999; (Sodenkamp & Suhl, 2012; Jenab et al., 2012).
Recently, there have been many approaches to cope with the uncertainty environment. (Taylor & Baker, 1994; Secme et al., 2009; Clemes et al., 2010; Alam et al., 2009).
Many traditional MCDM techniques in crisp or fuzzy environment are based on independence assumption, but each individual criterion is not always completely independent (Leung et al., 2003).In other words, in real circumstances most criteria are basically dependent. The Analytical Network Process (ANP) method proposed by Saaty (1996) overcomes this problem and solves the interactions among elements. In ANP method relation of inner dependences are not complete and perfect. So, Decision Making Trial and Evaluation Laboratory (DEMATEL) method which was by proposed Fontela and Gabus (1976) can be used to consider the inner dependences among criteria.
However, this research differs from prior studies, as it considers inner relation between criteria the possible influence of CRM on service quality in banking institutions in public and private banks in Iran.
As the use of combined fuzzy DEMATEL and fuzzy ANP has several advantages this study seeks to review the bank service quality dimensions and introduce an integrated fuzzy DEMATEL and fuzzy ANP approach for prioritizing these dimensions according to customers’ expectations and perception and measurement of service quality of four Irans’ banks.
Fuzzy ANP is used to compute final ranking of the four banks. Fuzzy DEMATEL is applied to deal with inner dependencies among criteria. Also, an empirical study is presented to illustrate the application of the proposed method.
Remainder of this paper are structured as follows: Section 2 gives factors; Section 3 describes the proposed methodology based on Fuzzy DE- MATEL and Fuzzy ANP; In Section 4, fuzzy set theory, CFCS defuzzification method, fuzzy ANP and fuzzy DEMATEL are described; In section 5, the proposed methodology is applied; and finally, Section 6 concludes our work.
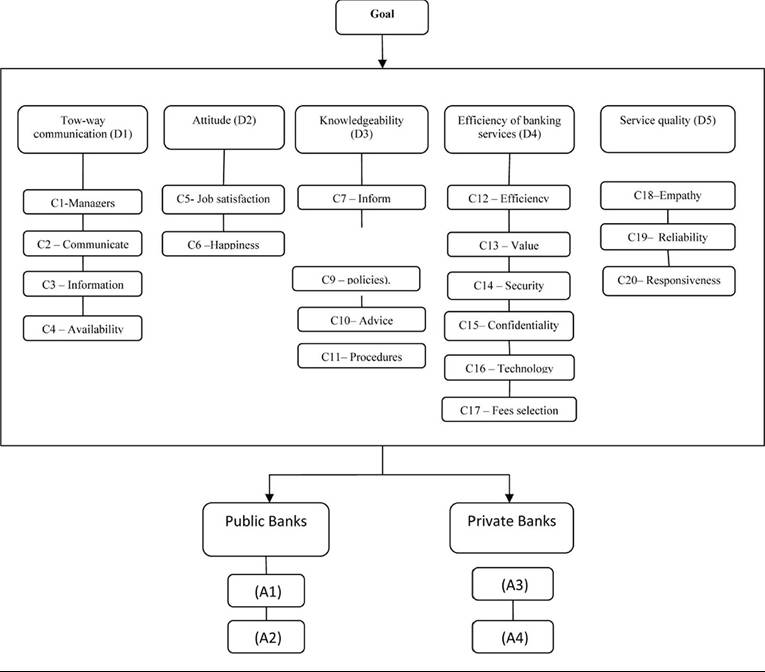
2. CRITERIA INFLUENCING CUSTOMER RELATIONSHIP MANAGEMENTAND SERVICE QUALITY
In order to make certain high levels of customer relationship management and service quality, a number of factors that can influence the quality of the CRM strategies and service quality of a service firm, need to be analyzed.
Rootman et al. (2006) investigated factors that influence the customer relationship management (CRM) of banks from employees’ perspectives. Rootman (2006) applied criteria which affect in CRM and service quality of banks and as a result we consider factors based on these criteria. Final, this research considers specific 21 criteria gained by the interview of 10 experts.
Rootman (2006) proposed that customer relationship management can possibly be influenced by the following specific factors:
1. Tow-way communication;
2. Attitude;
3. Knowledgeability;
4. Efficiency of banking services.
Service quality can possibly be influenced by customer relationship so we consider 5 group criteria as (D1, D2, D3, D4, D5).
2.1. Tow-Way Communication
Duncan and Moriarty(1998) considered retailerconsumer relationships, they showed that: “ different relationship marketing tactics have a differential impact on consumer perceptions of a retailer’s relationship investment; it demonstrates that perceived relationship investment affects relationship quality, ultimately leading to behavioral loyalty; and it reveals that the effect of perceived relationship investment on relationship quality is contingent on a consumer’s product category involvement and proneness to engage in retail relationships.” Also they pointed that bank employee’s role has shifted to financial counseling, which involves the processes oflistening, adjusting and matching (Duncan & Moriarty, 1998).
Christopher et al. (1993) explained that service providers should listen to clients and need to design and provide a service that will lead to continued value exchanges between the two customers and.
These processes require bank employees to possess communication, listening and persuasion skills. Specifically, in the banking branch of the financial services industry, banks can communicate with clients through a variety of media. Rootman (2006) specified subcriteria for this factor and we consider four of these subcriteria based on experts’ opinion. These subcriteria are:
C1: Customer relationship with bank depends on whether senior managers are always available for appointments (managers);
C2: Customer relationship with bank depends on whether bank’s employees communicate effectively (communicate);
C3: Bank regularly informs customers of new or important banking information through various media (information);
C4: Bank regularly informs when certain services will be available and/or unavailable (availability).
2.2. Attitude
The effective management of people takes place in the context of the wider environmental setting, including the changing patterns of organizations and attitudes to work (Mullins, 1996). In organization, attitudes are evaluative statement and they have considerable role because they affect job behavior (Robbins, 1998). Attitude can be described as a tendency to respond in a specific way, based on positive or negative beliefs regarding objects, people and situations (Mullins, 1996). As result, this factor might influence the degree of CRM and upgrade client-firm relationships.
Rootman (2006) explained subcriteria and we select three criteria of them. These subcriteria are:
C5: employees of bank appear satisfied with their jobs (job satisfaction);
C6: relationship with bank depends on whether the employees of bank appear really happy and without stress (happiness).
2.3. Knowledgeability
Rootman et al.(2006) revealed that knowledgeability of bank employees have significant impact on the effectiveness of the CRM strategies of banks. In a banking institution, employees’ academic knowledge will depend on their perception and ability to fully understand banking procedures, policies, products and services.
Banking employees’ knowledge will depend on their ability to practically implement banking sequence of instructions and perform tasks regarding banking service delivery through the relevant banking systems. The above implies that an employee should have technical, product and firm knowledge (Walker, 1990).
Rootman et al. (2006) considered follow subcriteria that they are:
C7: Relationship with bank depends on whether employees of bank can inform customers on banking products and services (inform);
C8: The employees of bank have extensive knowledge regarding the banking products and services (knowledgeable);
C9: Relationship with bank depends on whether the employees can inform customers of banking policies and procedures (policies);
C10: Customers will have a better relationship with bank if the employees of bank can advise them on banking products and services (advise);
C11: Bank knows the bank’s procedures of delivering services (procedures).
2.4. Efficiency of Banking Services
Efficiency is defined as the degree to which tasks or activities are performed correctly and as desired (Marx et al., 1998).
A bank needs to ensure that its employees conduct their tasks and responsibilities in an efficient manner. This would result in resources being utilized efficiently and tasks being performed successfully. (Rootman et al., 2006). Asubonteng (1996) concentrated on the appraisal of the productive efficiency of bank branches,and this paper revealed that operations are characterized by the effort made by management to follow the banks’ corporate targets. The tangible part of this effort can be assessed by the operating efficiency of the branch while the intangible part is summarized by the quality of the provided services. The assessment of branch efficiency is pursued using data envelopment analysis methods enhanced by the value judgments of individual branch managers (Athanassopoulos, 1997). Thus, the efficiency of services may influence a bank’s CRM. The subcriteria are:
C12: Customer relationship with bank depends on the efficiency of its banking services (efficiency);
C13: Relationship with bank depends on whether it provides value for money (value);
C14: Relationship with bank depends on whether it implements strict measurements to ensure the security of funds (security);
C15: Customers will have a better relationship with bank if they know that customers bank treats information exchanged confidentially (confidentiality);
C16: If bank provides technologically advanced services, e.g. internet banking, customers will have a better relationship with bank (technology);
C17: Customers selected bank based on its fees for services (fees selection).
2.5. Service Quality
Service quality can be measured by identifying the gaps between customers’ expectations of the service to be rendered and their perceptions of the actual performance of the service. It is the most frequently used model to measure service quality (Mattson, 1994).For assessing a competent service firm, there are several service quality criteria to be approached. Parasuraman et al (1985) formulated a service quality model and identified dimensions such as tangibles, reliability, responsiveness, competence, courtesy, credibility, security, communication, understanding, and access in the original model and using in-depth interviews of executives and focus group interviews of consumers.
Parasuraman et al. (1988) considered ten dimensions were condensed into five tangibles, reliability, responsiveness, assurance, and empathy. Table 1 shows numerous researchers have confirmed the applicability of various dimension in different sectors. In this study Criteria which are considered are:
C18: Individualized attention from bank to its clients of service (Empathy);
C19: Bank can perform the service dependably and accurately (Reliability);
C20: The willingness to help clients and to provide prompt service refers to responsiveness dimension of a bank service (Responsiveness).
3. THE PROPOSED METHODOLOGY
In this section a methodology based on combined Fuzzy DEMATEL and Fuzzy ANP for investigation and ranking banks is proposed. The overall schema of proposed algorithm depicted in Figure 1. All of these steps will be implemented in an empirical study and described in further in detail.
This methodology consists of following steps:
Step 1: Determining goal of problem.
In the first step goal of problem and final output of decision process is defined.
Table 1. A summary of the considered dimension by previous studies
| Author | Year | Main Characteristics | Application |
| Parasurman et al | 1985,1988 | 5 -dimensions | Different type of services |
| Gabbie and Neill | 1996 | 5 -dimension | Hotel industry |
| Parasurman et al | 1985,1988 | 5 -dimensions | Different type of services |
| Mehta and Durvasula | 1998 | 5 -dimensions | business-to-business |
| Carman | 1990 | 4 -dimensional | Different type of services |
| Bolton and drew | 1991 | 4- dimensional | Telephone services |
| Cronin and Taylor | 1992 | 5 -dimensional | Different type of services |
| Teas | 1993 | 5- dimensional | Retail stores |
| Babakus and Boller | 1992 | 2 -dimension | Different type of services |
| Lam | 1995 | 1-dimensional | Health care industry |
| Nadiri and Hussain, | 2005 | 2-dimensional | Hotel industry |
| Evangelos et al | 2004 | 2-dimensional | Insurance study |
| Karatepe and Avci | 2002 | 2-dimensional | Hotel industry |
| Ekinci et al | 2003 | 2-dimensional | holiday market |
| Rootman et al | 2006 | 5-dimensional | Bank |
Figure 1. Diagram of proposed methodology
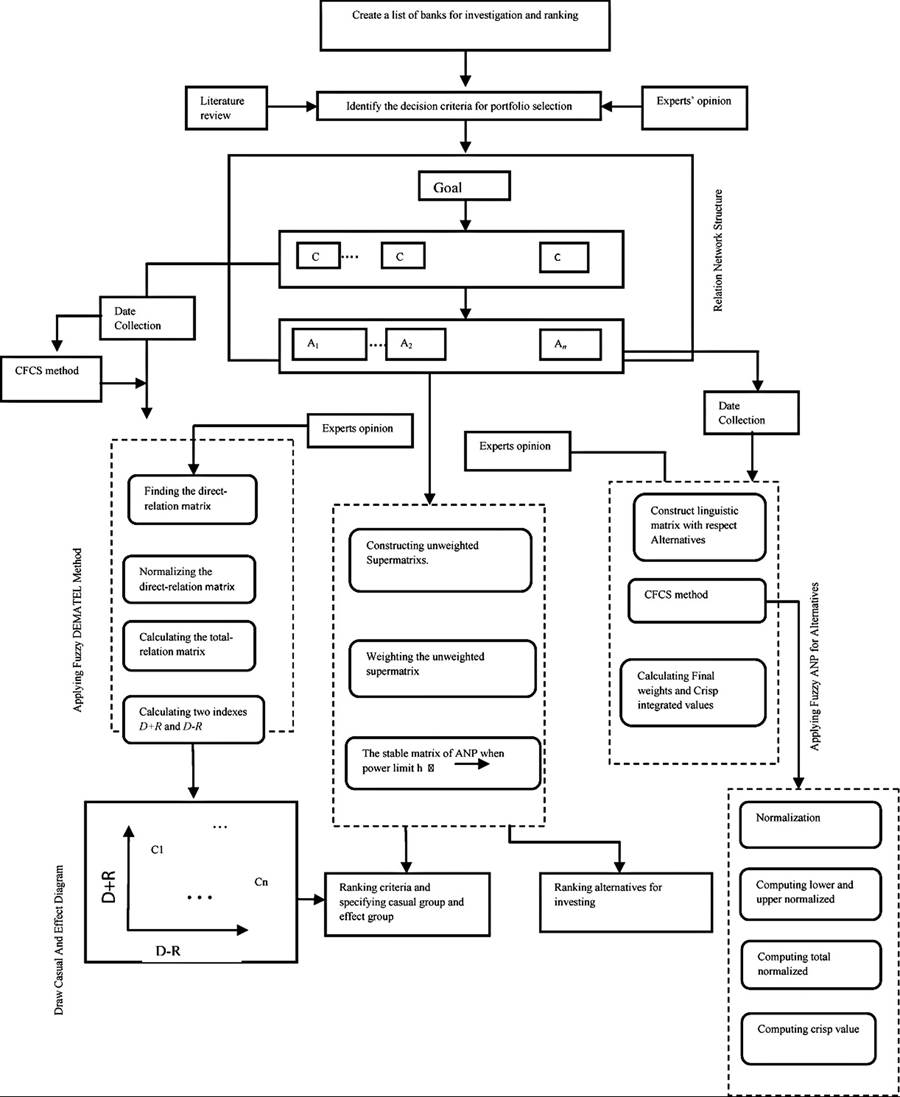
Step 2: Creating a list of banks for investigation.
Alternatives are specified based on goal.
Step 3: Identification evaluation criteria.
The organization should specify criteria for evaluating these alternatives by interviewing with experts and managers.
Step 4: Constructing relation network structure.
Based on results obtained from above steps, the network scheme for evaluating criteria and ranking alternatives according to service quality and customer relation management will be constructed. We also consider relation and dependency among criteria.
Step 5: Collecting data.
In this step, the pair- wise comparisons matrices will be obtained by using experts’ judgments. These matrices are the pair wise comparisons of criteria related to the goal, and the pair- wise comparisons of alternatives related to each criterion separately.
Step 6: Collecting data related to criteria based on their inner relation.
In this step, using questionnaires and filling them by using experts’ judgments based on linguistic variables, pair wise comparisons in terms of influence among criteria for each expert are separately constructed.
Step 7: Converting data of step 5 to fuzzy numbers based on the scales are mentioned in Table 3;
Step 8: Defuzzyfication of matrices which are obtained from step 7 by CFCS method;
Step 9: Aggregating matrices of step8 and applying fuzzy ANP for calculating crisp integrated values and final weights for twenty one main criteria with respect to goal and crisp integrated values and final weights for alternatives with respect to each criterion;
Step 10: Converting data from step 6 to fuzzy numbers based on scales and constructing pair-wise inner dependencies’ matrices;
Step 11: Defuzzyfication of matrices of step 10 by CFCS method;
Step 12: Aggregating matrices of step 11 by geometric mean method.
If k experts are used to construct pair wise comparison matrices for example k pair wise comparison matrices of criteria related to the goal, we will have k matrices that should be integrated to one matrix. Finally, for each integrated defizzified matrix, final weights will be calculated using geometric mean method developed by Saaty (1980).
Step 13: Applying fuzzy DEMATEL for calculating weights of inner relation between criteria and the calculated weights are entered to a supermatrix in fuzzy ANP;
Step 14: Combining Fuzzy DEMATEL and ANP methods;
Step 15: Ranking alternatives and investigating results.
In this step, the final weights of alternatives will be calculated and the best alternatives will be selected by using ANP technique (Figure 1).
4. BASIC MATERIALS
In this section, Fuzzy set theory, CFCS Defuzzification method, Fuzzy ANP, and Fuzzy DEMATEL are described as follows.
4.1. Fuzzy Set Theory
Result of decision-making in a fuzzy environment is highly affected by judgments which are imprecise. To solve this kind of imprecision problem, fuzzy set theory was introduced first by Zadeh
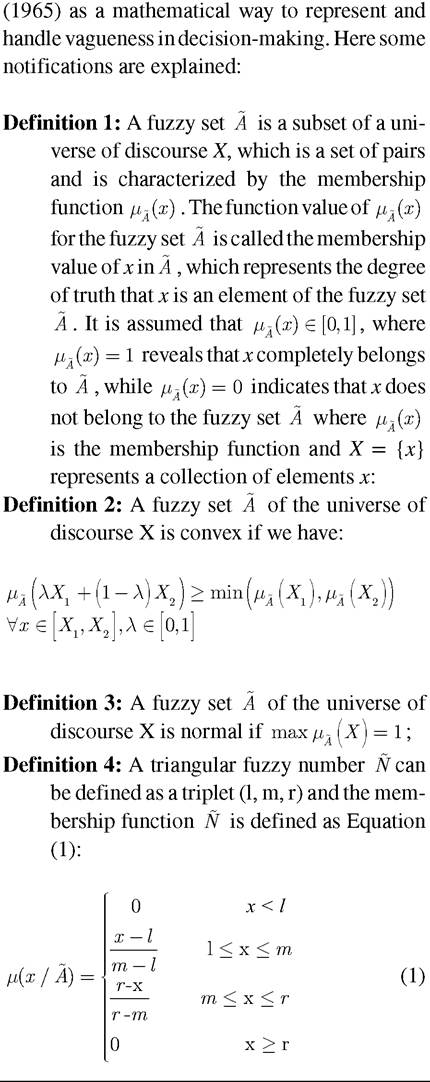
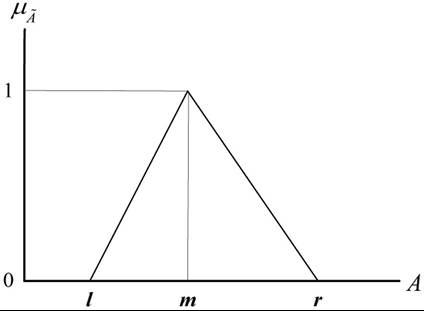
In this article, triangular fuzzy numbers are used as the membership function, which is illustrated in Figure 2. Triangular fuzzy numbers are used, since they help the decision maker to make easier decisions (Kaufmann & Gupta, 1988).The membership function of a triangular fuzzy number can be found in Equation (1) and is usually notated by the triplet (l, m, r).
4.2. CFCS Defuzzification Method
Step 1: Normalization
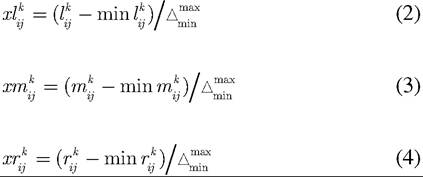
Figure 2. A triangular fuzzy number
where:
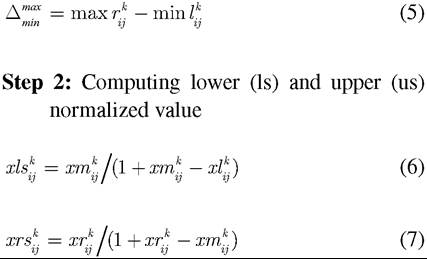
Step 3: Computing total normalized crisp value
Step 4: Computing crisp value

These steps should be followed separately for k evaluators.
4.3. Fuzzy ANP
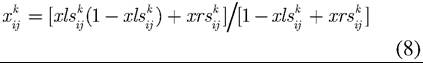
In order to make decisions in the presence of multiple and conflicting criteria, MCDM is applied. One of these techniques in MCDM that is used widely in decision making process is AHP. The analytic hierarchy process (AHP) has been used to help establish decision models and solve the problem that contains both qualitative and quantitative components by Saaty (1996).The basic assumption of AHP is dependency among each level related to upper level and itself. Many decision problems cannot be structured hierarchically when there is dependency between different level of elements and their interaction between them should be considered for solving problem, for this reason saaty( 1996) extended AHP method to ANP. Saaty (1996) suggested the use of ANP to solve the problem when dependency among alternatives or criteria exists. In reality, the elements within the hierarchy are often interdependent. ANP is a nonlinear structure and uses ratio scale measurements based on pair wise comparisons and models a decision problem using a system with feedback approach.The computation of local weights in ANP is exactly the same as AHP method. The result of computations or weights in ANP approach forms a supermatrix. A supermatrix is actually a partitioned matrix, where each matrix section represents a relationship between two groups of clusters in a network (Lee and Kim, 2000).
After the computation of all weights in the supermatrix, it is possible to derive the weights of priorities. The ANP methodology is explained in Saaty’s (2001) book, so we are not going to explain all the complication of the methodology due to space limitations.
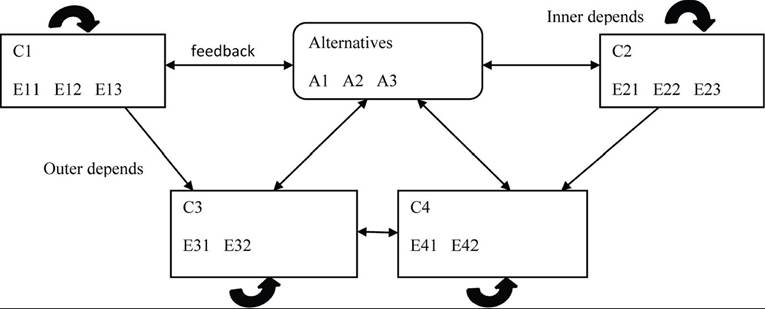
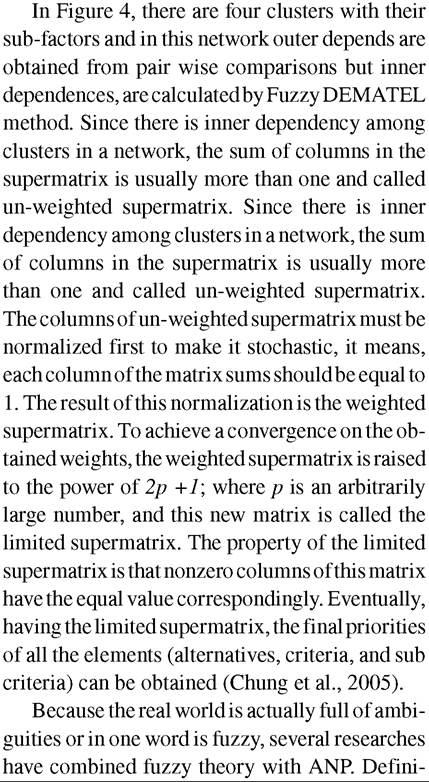
Figure 3 is a general form of the supermatrix introduced by Saaty (1996) to deal with the interdependence characteristics among alternatives and criteria. Figure 4 show the example of structure and relation network. A node represents a component or cluster with its elements; a straight line denotes the interactions between two components; and a loop indicates the inner dependence of elements within a component (Chung et al., 2005; Taha et al., 2011).
Figure 3. The general form of the supermatrix
Figure 4. (a) Hierarchy and (b) network
tions and descriptions in associated with linguistic variables are shown in Table 2.
After all steps of CFCS method to aggregate opinions of k decision maker Equation (10) should be calculated:

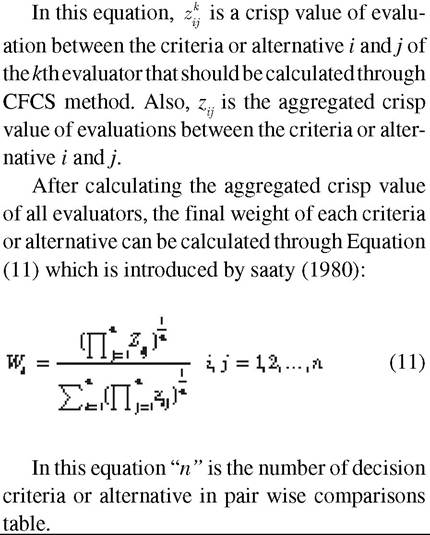
Table 2. Triangular fuzzy numbers of ANP method
| Linguistic Scale for Difficulty | Linguistic Scale for Importance | Triangular Fuzzy Numbers | Triangular Fuzzy Reciprocal Numbers |
| Just equal | Just equal | (1,1,1) | (1,1,1) |
| Equally difficult (ED) | Equally important (EI) | (1/2, 1, 3/2) | (2/3,1,2) |
| Weakly more difficult(WMD) | Weakly more important(WMI) | (1, 3/2, 2) | (1/2,2/3,1) |
| Strongly more difficult (SMD) | Strongly more important (SMI) | (3/2, 2, 5/2) | (2/5,1/2,2/3) |
| Very strongly more difficult(WSMD) | Very strongly more important (WSMI) | (2, 5/2, 3) | (1/3,2/5,1/2) |
| Absolutely more difficult (AMD) | Absolutely more important (AMI) | (5/2, 3, 7/2) | (2/7,1/3,2/5) |
4.4. Fuzzy DEMATEL
The DEMATEL was basically developed to deal with intricacy in local and worldwide problems effectively (Fontela & Gabus, 1976). DEMATE L is a comprehensive method for building and analyzing a structural model involving identification of relations between causes and effects of complex problems. The method is based on the concept of pair-wise comparison of decision-making criteria that indicates the effect of the criteria i on criteriaj.
The main application of DEMATEL is the identification of relations between causes and effects of complex problems. In order to apply the DEMATEL in crisp environment for one evaluator, the following steps are needed. The original DEMATEL was aimed a t the fragmented and antipathetic phenomena of world societies and searched for integrated solutions. In recent years, the DEMATEL method has become very popular because it is especially sensible to visualize the structure of complicated causal relationships.
Specifically, the DEMATEL method is based on digraphs, which can separate involved factors into cause group and effect group. A digraph may typically depict a communication network, or some domination relation between individuals. Digraphs illustrate the directed relationships of sub-systems and for this reason they are more applicable than directionless graphs. The flowing steps of this method are as below:
Step 1: Finding the direct-relation matrix.
This matrix shows the degree of effect that each criterion has on other criteria. In this step, an expert fills such a matrix i.e. a matrix which shows the degree of effect criteria i on criteria j. these amounts of effect can be expressed by words such as 0 (no influence), 1 (low influence), 2 (high influence), and 3 (very high influence). This matrix is called the direct-relation matrix that is a n?n matrix Z. Also, zij in matrix Z indicates the degree of effect criteria i on criteria j.
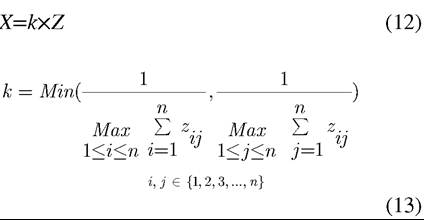
Step 2: Normalizing the direct-relation matrix.
The normalized direct-relation matrix X can be calculated through Equation (12) and (13), in which all main diagonal elements in matrix X are equal to zero (Chiu et al., 2006). In matrix X, each criterion does not affect itself:
Step 3: Calculating the total-relation matrix.
After calculating X in step 2, the total-relation matrix 5 can be derived by using Equation (14) as follows:
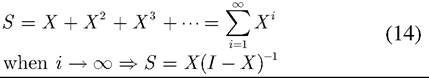
where, I is the n?n identity matrix.
Step 4: Calculating two indexes D+R and D-R for each criterion and drawing causal diagram.
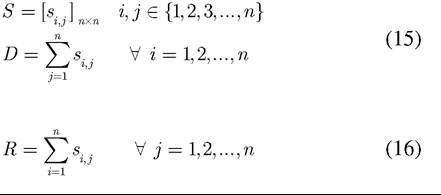
In this step, first we should calculate the sum of row (D) and the sum of column (R) for each criterion separately. It is clear that D and R are as vector. Vector D and R can be calculated as Equation (15) and (16). Then, the value of two indexes D+R and D-R for each criterion should be obtained. D+R index represents “prominence” of each criterion or importance degree of each criterion. Also, D-R index called “relation” and can divide the criteria into cause group and an effect group. The Positive values D-R indicates that the criterion belongs to the cause group. Also, the negative values D-R indicates that the criterion belongs to the effect group. Finally, the causal diagram can be obtained by drawing (D + R, D - R) points for each criterion:
Several researchers have combined fuzzy theory with DEMATEL. The linguistic scale and corresponding triangular fuzzy numbers to state pair wise comparisons in Fuzzy DEMATEL are illustrated in Figure 5. Definitions and descrip
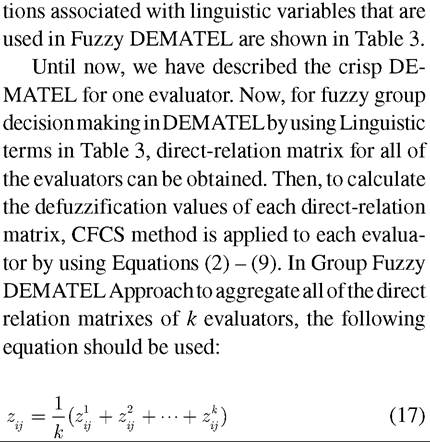
Figure 5. Triangular fuzzy numbers for DEMA
TEL method
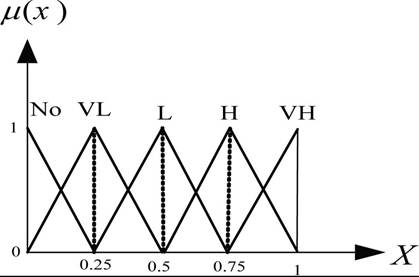
Table 3. Fuzzy comparison scale of DEMATEL method
| Linguistic Term | Linguistic Values |
| Very high influence (VH) | (0.75,1.0,1.0) |
| High influence (H) | (0.5,0.75,1.0) |
| Low influence (L) | (0.25,0.5,0.75) |
| Very low influence (VL) | (0,0.25,0.5) |
| No influence (NO) | (0,0,0.25) |
After aggregating the direct relation matrices, all calculations in fuzzy environment are similar to crisp DEMATEL. Also, total relation matrix 5 can be calculated through Equation (12)-(14).
4.5. Combination of Fuzzy DEMATEL and Fuzzy ANP
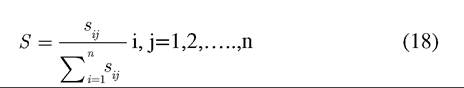
In supermatrix inner dependency between criteria can be obtained from Fuzzy DEMATEL method and other weights are calculated from Fuzzy ANP. After calculating the total relation matrix 5 in Fuzzy DEMATEL and before inserting into un-weighted supermatrix, the total relation matrix 5 should be normalized (Wu, 2008). The total relation matrix 5 should be normalized using Equation (18):
Consequently, final weight can be obtained by calculating weighted and limited supermatrix.
5. CASE STUDY
In this section, we implement the proposed methodology in an actual case in private and public banks in Iran to demonstrate that the proposed hybrid method is more appropriate, especially when the characteristics of criteria simultaneously exist as independent and dependent:
Step 1: Determining goal of problem.
To survive in a complex and competitive business environment, banks are required to focus on their customers’ needs and can focus on their relationships with clients and levels of service quality. In order to establish the influence of selected variables on the CRM and service quality of banks an empirical investigation was conducted to identify important factors and investigate bank for improving their performance.
Step 2: Creating a list of banks for investigation.
In this case, the four possible alternatives are selected to remain for further evaluation after preliminary screening and evaluate the service quality of private and public banks in Iran.
Step 3: Identification evaluation criteria.
First, we assembled a set of ten evaluators in which included staff from the government sector and different experts from managers of banks who are in charge of economic departments, academic experts.According to the proposals of evaluators, a suitable set of evaluation criteria are be selected. Tow-way communication, Attitude, Knowledge ability and Service quality are selected as main factor for evaluating and these factors have some related criteria.
Step 4: Constructing relation network structure.
The proposed network scheme to ranking banks based on the results gathered in above steps, are depicted in Figure 6. We know also that there are relationships between criteria. This relationship in this section will be considered.
Step 5: Collecting data.
The pair wise comparisons matrices of criteria related to the goal, and comparison matrices for evaluators of criteria with respect to four alternatives are attained from a verbal questionnaire filled by ten different experts.The comparison matrix for one evaluator for twenty main criteria with respect to the overall goal is formed.
Step 6: The results of step 6 are shown in the rest of paper;
Step 7: Because of limitation of space converting for one evaluator which is applied in Step 5 is not shown;
Step 8: Table 4 shows defuzzyfication of matrix for one evaluator from step 7;
Figure 6. The network scheme
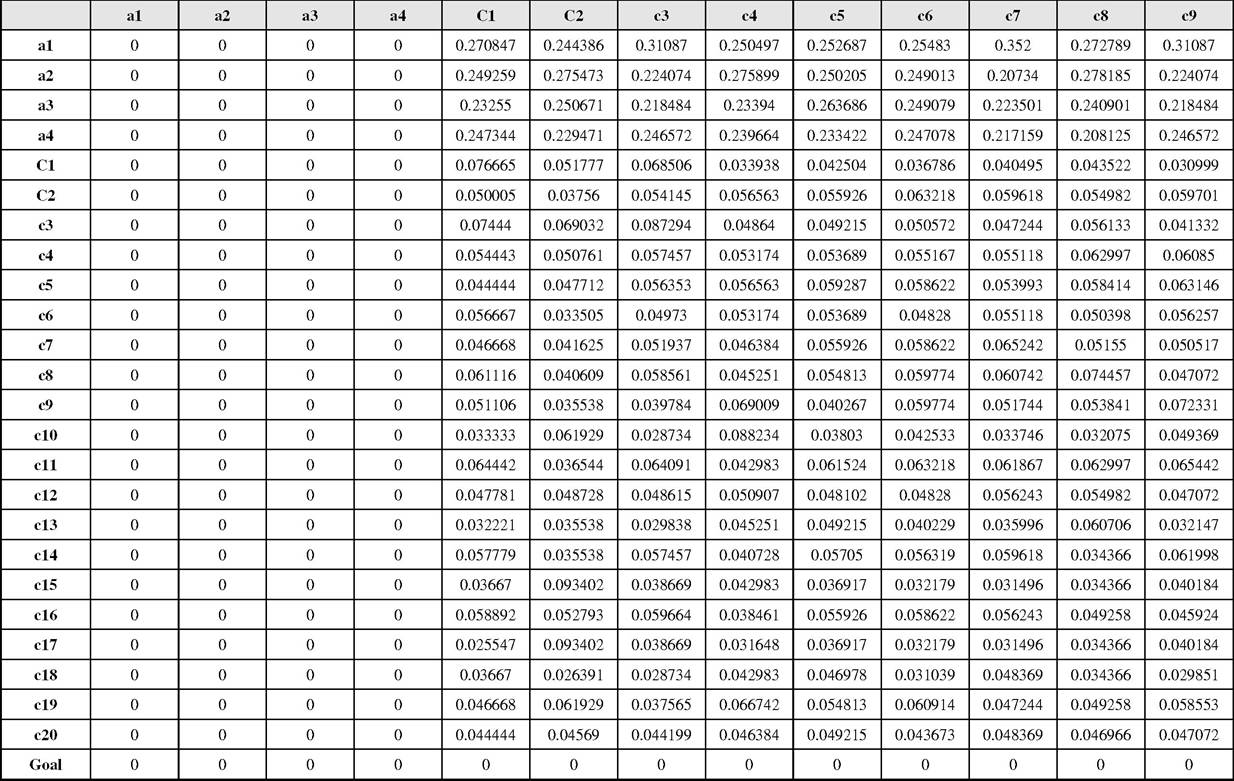
Step 9: Aggregation and applying fuzzy ANP for; Step 10-12: Calculating the final weights with respect to goal (Table5) and crisp integrated values for four alternatives with respect to each criterion are computed.
The results of step 6 and 10-12 are shown in Table 6 and it is called direct relation matrix.
Step 13: Calculate weights using Fuzzy DEMA- TEL.
In Table 6, the aggregated direct relation matrix is shown. Then, the normalized direct-influence matrix X for criteria can be calculated by Equations (12) and (13), (see Table 7). Third, the total direct-influence matrix S for criteria/dimensions was derived based on Equation (14), (see Table 8).
This article constructs a suitable evaluation hierarchical network framework which is included interdependent, dependent and independent structure based on total influence matrix for dimensions which are group of criteria.
The sum of rows and the sum of columns are separately denoted as vector D and vector R in the following equations (Table 9). We can obtain a useful causal diagram and evaluation hierarchi- cal/network framework by calculating the D+R and D-R (Table 10).The horizontal axis vector (D+R) named ‘‘Prominence” is made by adding D to R, which reveals how much importance the criterion has. Similarly, the vertical axis (D-R) named ‘‘Relation” is made by subtracting D from R, which may group criteria into a cause group. Or, if the (D-R) is negative, the criterion is grouped
Table 4. The final crisp value of one evaluator
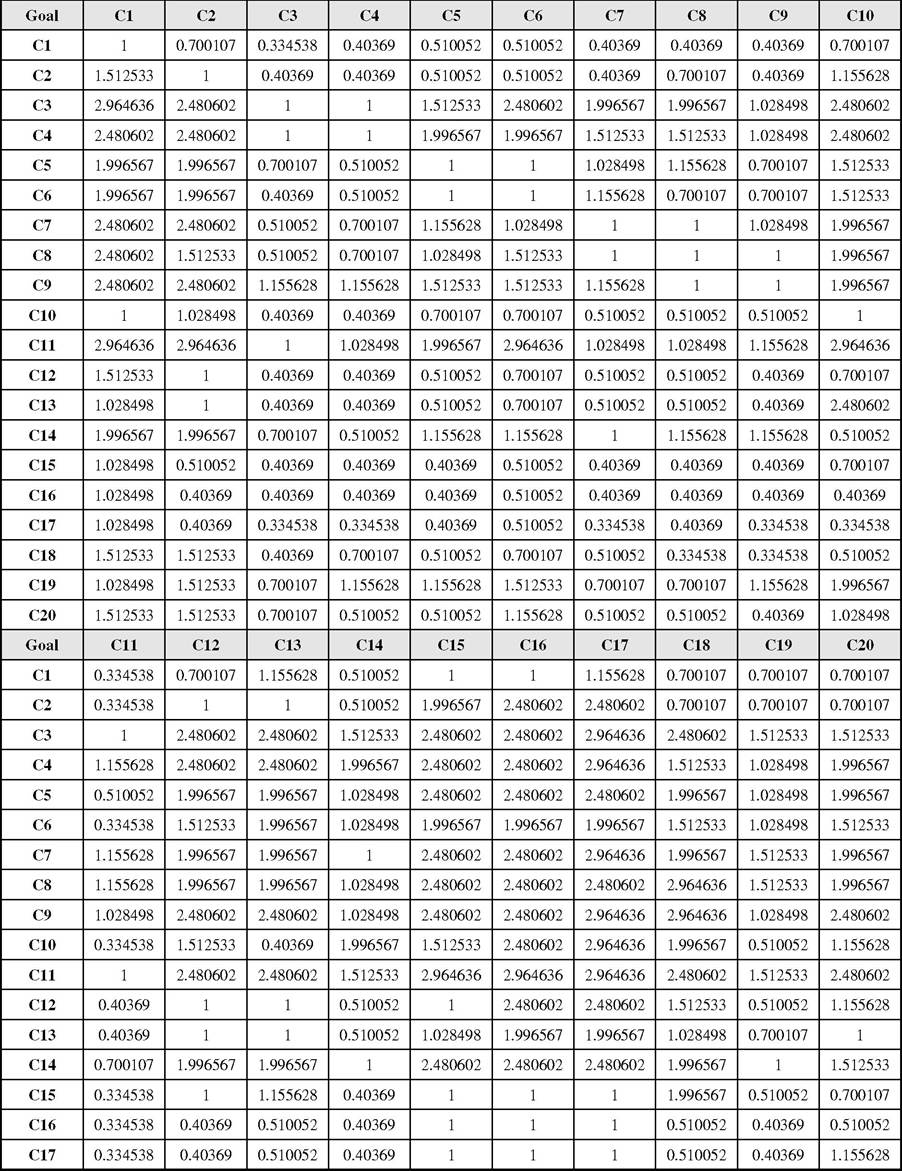
Table 4. Continued
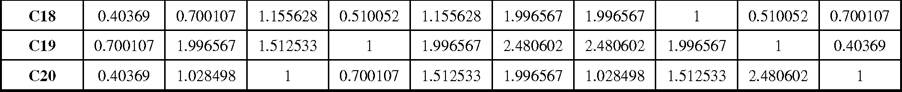
Table 5. Aggregation and final weights and crisp integrated values for twelve main criteria with respect to goal
Table 5. Continued
Table 6. Direct relation matrix
Table 6. Continued
Table 7. Normalized direct-influence matrix
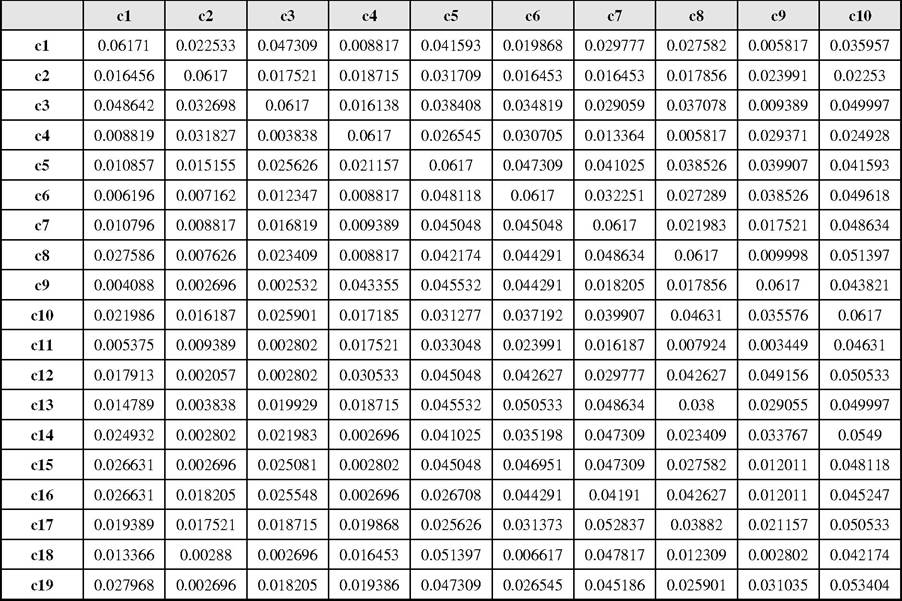
Table 7. Continued
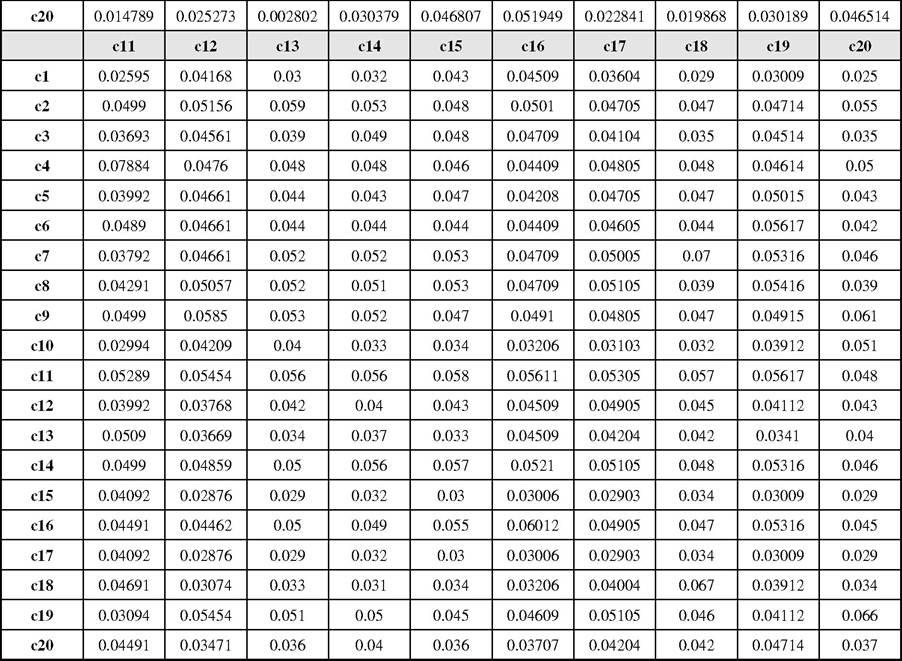
Table 8. Total direct-influence matrix S
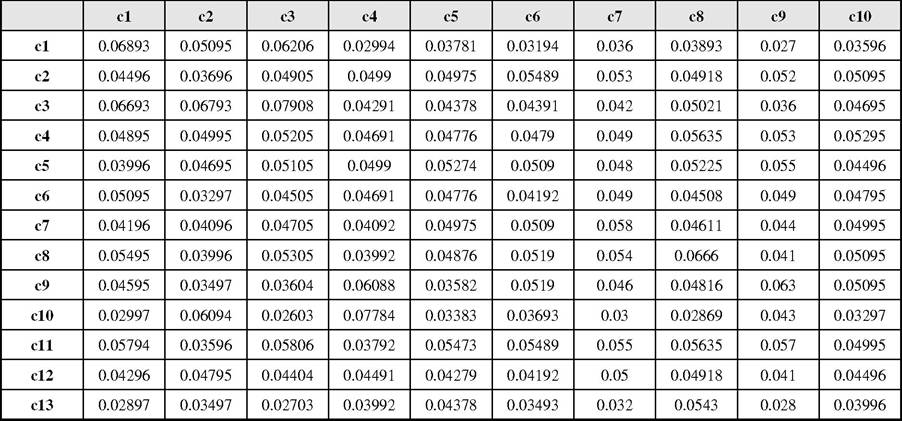
Table 8. Continued
into the effect group. Therefore, the causal diagram can be acquired by mapping the dataset of the (D+R, D-R), providing valuable insight for making decisions al diagram is shown in Figure 7.
Important cues can be obtained for making decisions from the causal diagram (Figure 4). Consider the results D1 (Tow-way communication), D2 (Attitude), D3 (knowledgeability) are grouped into the cause group, and D4 (efficiency of banking services), D5 (service quality) are grouped into the effect group. If the banks wanted to obtain high performances in terms of the effect group factors, it would be necessary to control and pay attention to the cause group criteria beforehand. This is because the cause group criteria imply the meaning of the influencing criteria, whereas the effect group criteria imply the meaning of the influenced criteria (Fontela & Gabus, 1976). In other words, the cause group criteria are difficult to move, while the effect group criteria are easily moved.
Table 9. Total-influence matrix S for dimensions
| D1 | D2 | D3 | D4 | D5 | Di | |
| D1 | 0.84746 | 0.35774 | 0.9211 | 1.088 | 0.49251 | 3.70681 |
| D2 | 0.36374 | 0.19332 | 0.48006 | 0.53849 | 0.28232 | 1.85793 |
| D3 | 0.92127 | 0.46941 | 1.18524 | 1.45899 | 0.74176 | 4.77667 |
| D4 | 1.05419 | 0.48528 | 1.22399 | 1.46487 | 0.72372 | 4.95205 |
| D5 | 0.48458 | 0.25209 | 0.61144 | 0.72434 | 0.41938 | 2.49183 |
| Ri | 3.67124 | 1.75784 | 4.42183 | 5.27469 | 2.65969 |
Table 10. Calculation D+R and D-R
| DI | RI | RI+DI | DI-RI | |
| D1 | 3.70681 | 3.67124 | 7.37805 | 0.03557 |
| D2 | 1.85793 | 1.75784 | 3.61577 | 0.10009 |
| D3 | 4.77667 | 4.42183 | 9.1985 | 0.35484 |
| D4 | 4.95205 | 5.27469 | 10.22674 | -0.32264 |
| D5 | 2.49183 | 2.65969 | 5.15152 | -0.16786 |
After performing Fuzzy DEMATEL method steps, weight among the criteria for each criterion will be calculated. The calculated weights enter to supermatrix in Fuzzy ANP. Table 11 shows weights of inner dependency among the criteria by normalizing matrix S using Equation (18). The normalized total-relation matrix can be entered to the un-weighted supermatrix directly.
Step 14-15: Combine Fuzzy DEMATEL and Fuzzy ANP.
In this step, ranking and selecting the best alternative among banks after completing supermatrix by using Fuzzy ANP is obtained and by this technique the final weights of alternatives will be calculated.
By using the results from DEMATEL and the weights, the supermatrix can be constructed. Table 12 shows unweighted supermatrix. To achieve weighted supermatrix at first the columns of unweighted supermatrix must be normalized, it means, the sum of each column of the unweighted matrix should be equal to 1. The weighted supermatrix is shown in Table 13. To obtain the limited supermatrix, weighted matrix is raised to the power
Figure 7. The casual diagram between criteria
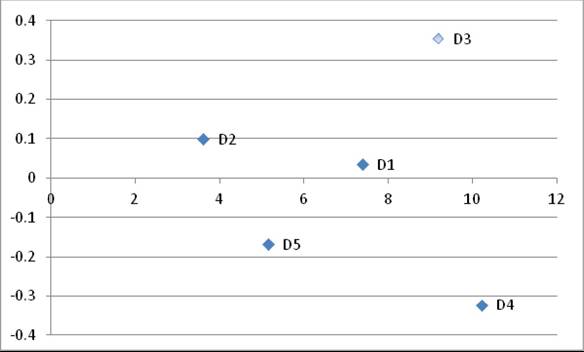
Table 11. Normalizing matrix T
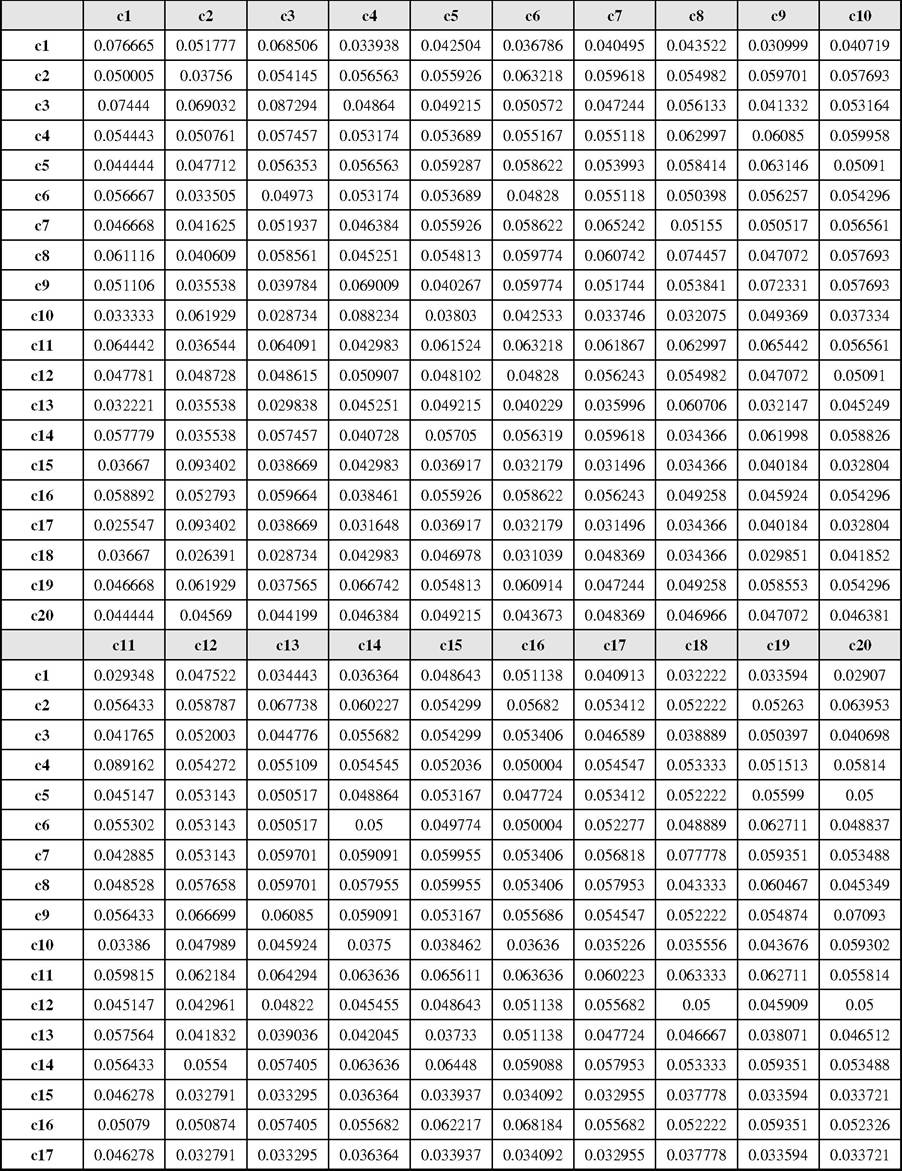
Table 11. Continued
of 2p +1; where p is an arbitrarily large number until it reaches the convergence. The results are provided in Table 14 named the limited supermatrix. Finally, having the limited supermatrix, the global priorities of all the elements (alternatives, criteria) can be obtained.
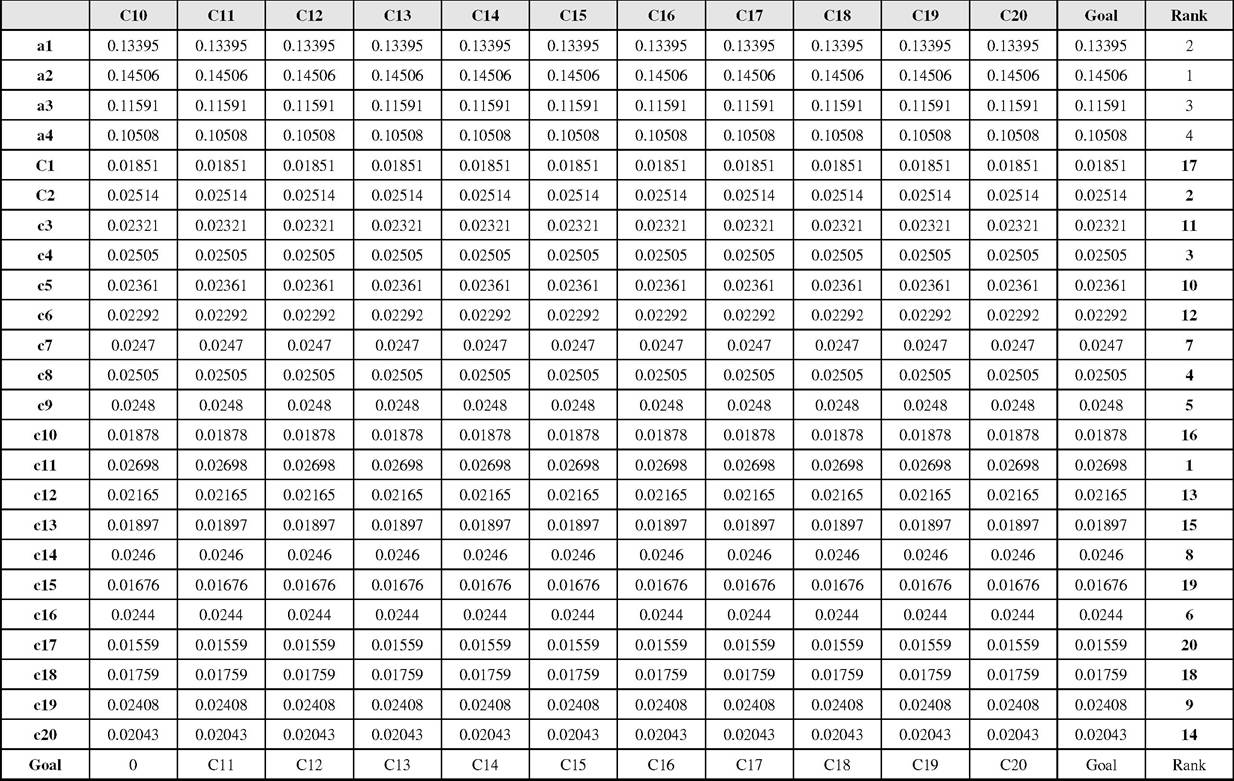
The final ranking of the banks shown in Table 14, A2 has first score and second bank is A1. The result can identify that private banks are most preferable prior to 20 service quality expectation and customer relation management criteria among the four banks in.
According to the analysis results, effect criteria C12, C13, C14, C15, C16, C17, C18, C19, C20 are difficult to be changed. This implies that it is an effective way to expand service quality expectation by the causal criteria group (C1, C2, C3, C4, C5, C6, C7, C8, C9, C10, C11). Further, these criteria can be regarded as the critical criteria in guiding the right benchmark for banks.
According to results, among these 20 criteria, C11 is the most important criterion because it has the highest weight of relation to other criteria; moreover, C2 is the most influencing criterion.
As a result of the above-mentioned calculations and based on Table 14,according the normal weights of twenty criteria the best non-fuzzy performance criteria ranking is:
C11 > C2 > C4 > C8> C9 > C16 > C7 > C14 > C19 > C5 > C3 > C6 > C12 > C20 > C13 > C10 > C1 > C18 > C15 > C17.
The top three important criteria descriptions are as follows:
1. Customers will have a better relationship with bank if the employees of bank know the bank’s procedures of delivering services,
2. Customer relationship with bank depends on whether bank’s employees communicate effectively, and
3. B ank regularly informs when certain services will be available and/or unavailable.
6. CONCLUSION
The role of CRM in the development and management of banking services has been a subject of debate, discussion and research. The practice of CRM and service quality is critical component of communication management processes in Iranian banks but unfortunately applications of CRM are not desirable. This paper is about identifying important criteria and ranking banks from viewpoint of customer relation management and service quality by multi criteria decision making and fuzzy ANP and fuzzy DEMATEL in banking industrial in Iran. Fuzzy DEMATEL method proposed in this study is comprehensive and applicable to other industries that require group decision making in a fuzzy environment to segment complex criteria and decision making and by this method we obtained weights of inner relation between twenty criteria of customer relation management and service quality. Moreover, the Fuzzy DEMATEL not only can be used as a way to handle the inner dependences within a set of criteria, but also can produce more valuable information for causal and effect relationship.
1140
Table 12. Un-weighted supermatrix
continued On following page
An Uncertain Decision Making Process Considering Customers and Services in Evaluating Banks
Table 12. Continued
An Uncertain Decision Making Process Considering Customers and Services in Evaluating Banks
1141
Table 13. Weighted supermatrix
continued On following page
An Uncertain Decision Making Process Considering Customers and Services in Evaluating Ban,
OJ
Table 13. Continued
An Uncertain Decision Making Process Considering Customers and Services in Evaluating Banks
Table 14. Limited supermatrix
continued On following page
An Uncertain Decision Making Process Considering Customers and Services in Evaluating Ban
Table 14. Continued
An Uncertain Decision Making Process Considering Customers and Services in Evaluating Banks
1145
Furthermore, using the suggested analytical procedure; it can effectively handle any problem of selection with multi-faceted attributes. However, there are some limitations, such as the evaluate scales of the Fuzzy ANP and the DEMATEL are not unified. If the study involves large samples, then the combined methodology might be too complicated. Moreover, the assessment scale is required to improve its user friendliness in the future.
ACKNOWLEDGMENT
The authors would like to thank the anonymous reviewers for their constructive suggestions and comments.
REFERENCES
Albayrak, E., & Erensal, Y. C. (2005). A study bank selection decision in Turkey using the extended fuzzy AHP method. In Proceedings of the 35th International Conference on Computers and Industrial Engineering, Istanbul, Turkey.
Anton, J., & Petouhoff, N. L. (2001). Customer relationship management: The bottom line to optimizing your ROI (NetEffect Series). PrenticeHall, Inc.
Asubonteng, P., McCleary, K. J., & Swan, J. E. (1996). SERVQUAL revisited: A critical review of service quality. Journal of Services Marketing, 10(6), 62-81. doi:10.1108/08876049610148602
Avkiran, N. K. (1994). Developing an instrument to measure customer service quality in branch banking. International Journal of Bank Marketing, 12(6), 10-18. doi:10.1108/02652329410063223
Babakus, E., & Boller, G. W. (1992). An empirical assessment of the SERVQUAL scale. Journal of Business Research, 24, 253-268. doi:10.1016/0148-2963(92)90022-4
Bahia, K., & Nantel, J. (2000). A reliable and valid measurement scale for the perceived service quality of banks. International Journal of Bank Marketing, 18(2), 84-91. doi:10.1108/02652320010322994
Berry, L. L., Parasuraman, A., & Zeithaml, V. A. (1988). The service-quality puzzle. Business Horizons, 31(5), 35-43. doi:10.1016/0007- 6813(88)90053-5
Bolton, R. N., & Drew, J. H. (1991). A longitudinal analysis of the impact of service changes on customer attitudes. Journal of Marketing, 55(1), 1-9. doi:10.2307/1252199
Carman, J. M. (1990). Consumer perceptions of service quality: An assessment of the SERVQUAL dimensions. Journal of Retailing, 66, 33-55.
Che, Z. H., Wang, H. S., & Chuang, C. L. (2010). A fuzzyAHP and DEA approach for making bank loan decisions for small and medium enterprises in Taiwan. Expert Systems with Applications, 37(10), 7189-7199. doi:10.1016/j.eswa.2010.04.010
Christopher, M., Payne, A., & Ballantyne, D. (1993). Relationship marketing: Bringing quality, customer service and marketing together. Oxford, UK: Butterworth Heinemann.
Christopher, M., Payne, A., & Ballantyne,
D. (2002). Relationship marketing: Creating stakeholder value. Oxford, UK: Butterworth- Heinemann.
Chung, S. H., Lee, A. H., & Pearn, W. L. (2005). Analytic network process (ANP) approach for product mix planning in semiconductor fabricator. International Journal of Production Economics, 96(1), 15-36. doi:10.1016/j.ijpe.2004.02.006
Cronin, J. J., & Taylor, S. A. (1992). Measuring service quality: A reexamination and extension. Journal of Marketing, 56(3), 55-68. doi:10.2307/1252296
David Strang, K. (2012). Applied financial non-linear programming models for decision making. International Journal of Applied Decision Sciences, 5(4), 370-395. doi:10.1504/ IJADS.2012.050023
Deng, H. (1999). Multicriteria analysis with fuzzy pairwise comparison. International Journal of Approximate Reasoning, 21(3), 215-231. doi:10.1016/S0888-613X(99)00025-0
Donnelly, M., Wisniewski, M., Dalrymple, J. F., & Curry, A. C. (1995). Measuring service quality in local government: the SERVQUAL approach. International Journal of Public Sector Management, 8(1), 15-20. doi:10.1108/09513559510103157
Duncan, T., & Moriarty, S. E. (1998). A communication-based marketing model for managing relationships. Journal of Marketing, 62(2), 1-13. doi:10.2307/1252157
Ekinci, Y., Prokopaki, P., & Cobanoglu, C. (2003). Service quality in Cretan accommodations: Marketing strategies for the UK holiday market. International Journal of Hospitality Management, 22(1), 47-66. doi:10.1016/S0278- 4319(02)00072-5
Evangelos, T., Simmy, M., & Graham, R. K. (2004). Quality improvement in the Greek and Kenyan insurancindustries. Archives of Economic History, 16(2), 93-116.
Fazlollahtabar, H., Aghasi, E., & Forte, P. (2012). bi-objective two-stage decision-making process for service marketing. [IJSDS]. International Journal of Strategic Decision Sciences, 3(3), 24-39. doi:10.4018/jsds.2012070103
Fisk, R. P., Brown, S. W., & Bitner, M. J. (1993). Tracking the evolution of the services marketing literature. Journal of Retailing, 69(1), 61-103. doi:10.1016/S0022-4359(05)80004-1
Fontela, E., & Gabus, A. (1976). The DEMATEL observer, DEMATEL 1976 report. Geneva, Switzerland: Battelle Geneva Research Center.
Frei, F. X., & Harker, P. T. (1999). Measuring aggregate process performance using AHP. European Journal of Operational Research, 116(2), 436-442. doi:10.1016/S0377-2217(98)00134-9
Gabbie, O., & Neill, M. A. (1996). SERVQUAL and the Northern Ireland hotel sector: A comparative analysis - part 1. Managing Service Quality, 6(6), 25-32. doi:10.1108/09604529610149194
Gilbert, D. C., & Choi, K. C. (2003). Relationship marketing practice in relation to different bank ownerships: A study of banks in Hong Kong. International Journal of Bank Marketing, 21(3), 137-146. doi:10.1108/02652320310469511
Goosen, W., Pampallis, A., van der Merwe, A., & Mdluli, L. (1999). Banking in the new millenium. Kenwyn, Juta and Co Ltd.
Gosney, J. W., & Boehm, T. P. (2000). Customer relationship management essentials. New Delhi, India: Prentice-Hall of India Private Limited.
Hussain, M., Gunasekaran, A., & Islam, M. M. (2002). Implications of non-financial performance measures in Finnish banks. Managerial Auditing Journal, 17(8), 452-463. doi:10.1108/02686900210444798
Jaggi, C. K., Goel, S. K., & Mittal, M. (2011). Pricing and replenishment policies for imperfect quality deteriorating items under inflation and permissible delay in payments. [IJSDS]. International Journal of Strategic Decision Sciences, 2(2), 20-35. doi:10.4018/jsds.2011040102
Jajimoggala, S., Rao, K., & Satyanarayana, B. (2011). Maintenance strategy evaluation using ANP and goal programming. [IJSDS]. International Journal of Strategic Decision Sciences, 2(2), 56-77. doi:10.4018/jsds.2011040104
Jenab, K., Khoury, S., & Sarfaraz, A. R. (2012). Manufacturing complexity analysis with fuzzy AHP. [IJSDS]. International Journal of Strategic Decision Sciences, 3(2), 31-46. doi:10.4018/ jsds.2012040103
Kaufmann, A., & Gupta, M. M. (1988). Fuzzy mathematical models in engineering and management science. New York, NY: Elsevier Science Inc.
Khalili-Damghani, K., Taghavi-Fard, M., & Abtahi, A. R. (2012). A fuzzy two-stage DEA approach for performance measurement: Real case of agility performance in dairy supply chains. International Journal of Applied Decision Sciences, 5(4), 293-317. doi:10.1504/IJADS.2012.050019
Kim, H. S., Kim, Y. G., & Park, C. W. (2010). Integration of firm’s resource and capability to implement enterprise CRM: A case study of a retail bank in Korea. Decision Support Systems, 48(2), 313-322. doi:10.1016/j.dss.2009.07.006
Lam, S. S. K. (1995). Assessing the validity of SERVQUAL: An empirical analysis in Hong Kong. Asia Pacific Journal of Quality Management, 4(4), 33-40.
Lee, H., Kwak, W., & Han, I. (1995). Developing a business performance evaluation system: An analytic hierarchical model. The Engineering Economist, 40(4), 343-357. doi:10.1080/00137919508903159
Lee, J. W., & Kim, S. H. (2000). Using analytic network process and goal programming for interdependent information system project selection. Computers & Operations Research, 27(4), 367-382. doi:10.1016/S0305-0548(99)00057-X
Leung, L. C., Hui, Y. V., & Zheng, M. (2003). Analysis of compatibility between interdependent matrices in ANP. The Journal of the Operational Research Society, 54(7), 758-768. doi:10.1057/ palgrave.jors.2601569
Marx, S., van Rooyen, D. C., Bosch, J. K., & Reynders, H. J. J. (1998). Business and management (2nd ed.). Pretoria, South Africa: J.L. van Schaik Publishers.
Mattsson, J. (1994). Improving service quality in person-to-person encounters: Integrating findings from a multi-disciplinary review. Service Industries Journal, 14(1), 45-61. doi:10.1080/02642069400000004
Mehta, S. C., & Durvasula, S. (1998). Relationships between SERVQUAL dimensions and organizational performance in the case of a business-to-business service. Journal of Business and Industrial Marketing, 13, 40-53. doi:10.1108/08858629810206232
Morash, E. A., & Ozment, J. (1994). Toward management of transportation service quality. Logistics and Transportation Review, 30(2), 115-140.
Mullins, L. J. (1996). Management and organisational behaviour (4th ed.). London, UK: Pitman Publishing.
Nadiri, H., & Hussain, K. (2005). Perceptions of service quality in north Cyprus Hotels. International Journal of Contemporary Hospitality Management, 17(6), 469-480. doi:10.1108/09596110510612112
Newman, K. (2001). Interrogating SERVQUAL: A critical assessment of service quality measurement in a high street retail bank. International Journal of Bank Marketing, 19(3), 126-139. doi:10.1108/02652320110388559
Opricovic, S., & Tzeng, G. H. (2003). Defuzzification for a fuzzy multicriteria decision model. International Journal of Uncertainty, Fuzziness and Knowledge-based Systems, 11(5), 635-652. doi:10.1142/S0218488503002387
Parasuraman, A., Zeithaml, V. A., & Berry, L. L. (1985). A conceptual model of service quality and its implications for future research. Journal ofMarketing, 49(4), 41-50. doi:10.2307/1251430
Parasuraman, A., Zeithaml, V. A., & Berry, L. L. (1988). SERVQUAL: A multi-item scale for measuring consumer perceptions of the service quality. Journal of Retailing, 64(1), 1240.
Peppard, J. (2000). Customer relationship management (CRM) in financial services. European Management Journal, 18(3), 312-327. doi:10.1016/ S0263-2373(00)00013-X
Reinartz, W., Krafft, M., & Hoyer, W. D. (2004). The customer relationship management process: Its measurement and impact on performance. JMR, Journal of Marketing Research, 41(3), 293-305. doi:10.1509/jmkr.41.3.293.35991
Rigby, D., & Burton, M. (2004). Modeling indifference and dislike: A bounded Bayesian mixed logit model of the UK market for GM food.
Robbins, S. P. (1998). Organizational behavior (8th ed.). Upper Saddle River, NJ: Prentice-Hall.
Rootman, C. (2006). The influence of customer relationship management on the service quality of banks. Unpublished masters dissertation, Nelson Mandela Metropolitan University, Port Elizabeth.
Rust, R. T., & Oliver, R. L. (1994). Service quality: New directions in theory and practice. Thousand Oaks, CA: Sage.
Saaty, T. L. (1980). The analytical hierarchy process. New York, NY: McGraw-Hill.
Saaty, T. L. (1996). Decision making with dependence andfeedback: The analytic network process. Pittsburgh, PA: RWS Publications.
Seeme, N. Y. I., Bayrakdaroglu, A., & Kahra- man, C. (2009). Fuzzy performance evaluation in Turkish banking sector using analytic hierarchy process and TOPSIS. Expert Systems with Applications, 36(9), 11699-11709. doi:10.1016/j. eswa.2009.03.013
Sharkey, P. D., Hsu, W., B atra, S., & Rigamonti, D. (2011). The application of data mining to evaluate the cost-effectiveness of alternative treatment modalities in a national medicare database. [IJSDS]. International Journal of Strategic Decision Sciences, 2(4), 14-28. doi:10.4018/jsds.2011100102
Sodenkamp, M. A., & Suhl, L. (2012). A multicriteria multilevel group decision method for supplier selection and order allocation. [IJSDS]. International Journal of Strategic Decision Sciences, 3(1), 81-105. doi:10.4018/IJSDS.2012010103
Suwignjo, P., Bititci, U. S., & Carrie, A. S. (2000). Quantitative models for performance measurement system. International Journal of Production Economics, 64(1), 231-241. doi:10.1016/S0925- 5273(99)00061-4
Taha, Z., Banakar, Z., & Tahriri, F. (2011). Analytical hierarchy process for the selection of advanced manufacturing technology in an aircraft industry. International Journal of Applied Decision Sciences, 4(2), 148-170. doi:10.1504/ IJADS.2011.039516
Taylor, S. A. (1994). An assessment ofthe relationship between service quality and customer satisfaction in the formation of consumers’ purchase intentions. Journal of Retailing, 70(2), 163-178. doi:10.1016/0022-4359(94)90013-2
Teas, R. K. (1993). Expectations, performance evaluation, and consumers’ perceptions of quality. Journal of Marketing, 57, 18-34. doi:10.2307/1252216
Walker, D. (1990). Customerfirst: A strategy for quality service. Aldershot, UK: Gower Publishing.
Wang, G., Huang, S. H., & Dismukes, J. P. (2004). Product-driven supply chain selection using integrated multi-criteria decision-making methodology. International Journal of Production Economics, 91(1), 1-15. doi:10.1016/S0925- 5273(03)00221-4
Wu, J., Zuo, H., & Chen, Y. (2005). An estimation method for direct maintenance cost of aircraft components based on particle swarm optimization with immunity algorithm. Journal of Central South University of Technology, 12(2), 95-101. doi:10.1007/s11771-005-0018-9
Yurdakul, M., & Ic, Y. T. (2004). AHP approach in the credit evaluation of the manufacturing firms in Turkey. International Journal of Production Economics, 88(3), 269-289. doi:10.1016/S0925- 5273(03)00189-0
Zadeh, L. A. (1965). Fuzzy sets. Information and Control, 8(3), 338-353. doi:10.1016/S0019- 9958(65)90241-X
This work was previously published in International Journal of Strategic Decision Sciences (IJSDS), 4(2); edited by Madjid Tavana, pages 48-78, copyright 2013 by IGI Publishing (an imprint of IGI Global).