Chapter 62 Analyzing the Efficiency of European Banks: A DEA-Based Risk and Profitability Approach
Mehmet Hasan Eken
Istanbul Commerce University, Turkey
Suleyman Kale
Ziraat Bank, Turkey
Huseyin Selimler
Ziraat Bank, Turkey
ABSTRACT
Basic financial and profitability ratios such as net interest margin, return on assets, and return on equity alone do not measure bank performances effectively as they lack the risks associated.
Since the success of banks in managing performance is expected to be largely dependent on the correct pricing and management of risks, a proper measurement of efficiency should include the effects of risks. The purpose of this study is to benchmark risk profiles of European commercial banks and performance indicators during the2006- 2009. The research is implemented based on four models by Data Envelopment Analysis with data of697 banks from 37 countries. The results suggest that there is an extensive inter- and intra-country risk efficiency of banks. Profitability increase is not always directly proportional to risk increase, and the financial crisis substantially decreased the risk efficiency of banks, especially in 2008 in developed economies.
INTRODUCTION
Conventionally, a set of ratios, net interest margin (NIM), return on average asset (ROAA), return on average equity (ROAE) or cost to income, have been used to analyze the performances of banks.
DOI: 10.4018/978-1-4666-6268-1.ch062
But the recent global crisis has proved that these parameters are not enough to judge the robustness of financial agents and performance should be associated with risk more than ever. All the paradigms have been reevaluated to integrate risk monitoring and control mechanisms into prudential regulations, to adopt a stronger regulatory and supervisory framework, to ensure more resistant financial institutions and to attain more rational and effective measures.
.
All international organizations agree that there is a need for more restricted and regulated financial systems and that risks should be considered more than ever before in the supervising of financial bodies.
The basic financial and profitability ratios NIM, ROAA and especially ROAE have been criticized for being insufficient to effectively measure the performance of banks since they lack the risks (credit risk, interest rate risk, foreign exchange risk, liquidity risk, operational risk and leverage) associated with them. Therefore, a proper measurement of bank efficiency should include the effects of risks on measured profitability ratios as well. Risk efficiency indicates whether the profitability ratios of banks are reasonable compared to their risk levels. This relation demonstrates the efficiency of banks in converting their risks to profitability and performance indicators.With this study we aim to investigate the relationship between the risk levels of European commercial banks and their profitability indicators by using DEA. In this specific area of efficiency, there is a very limited literature and thus the risk efficiency of banks has yet to be analyzed. To our knowledge, this is the first study to extensively associate risk parameters with profitability indicators by using DEA. In utilizing DEA, some proper proxies for the abovementioned risks are used as inputs and profitability ratios are employed as outputs. The study also enables us to compare risk efficiency of different banking sectors throughout wide range of economic and geographical region. The models will be run on the data of 697 from 37 member countries of the European Banking Federation (EBF). The data covers the period 2006-2009 to ensure that any changes in performance during the global financial crisis would be captured as well. The results will enable us to analyze the risk efficiencies of banks in terms of the following: the country within which they are located, the absence or presence of unions, their regions, local development levels, ownership, size, and whether or not they are exchange listed.
The approach used in this paper is based on a DEA (Data Envelopment Analysis) where inputs are risks and outputs are profitability.
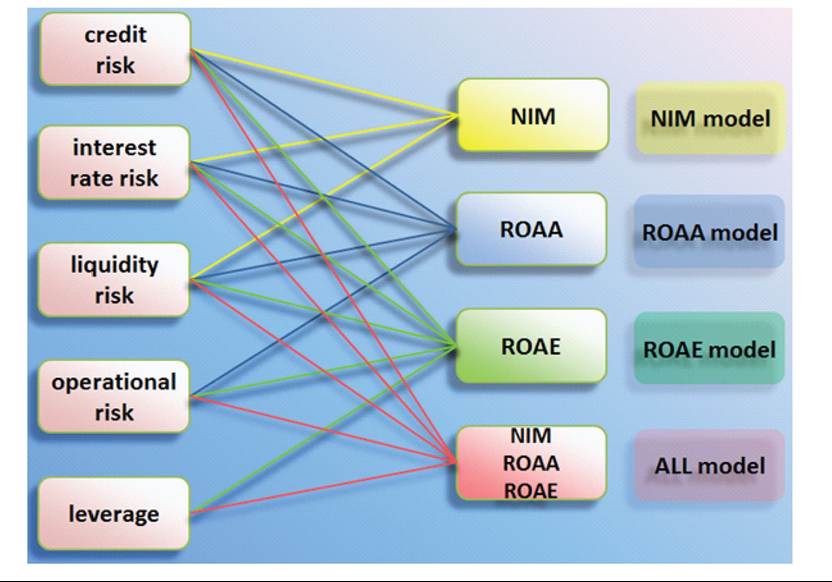
In the first of four different models, it is assumed that NIM is affected by interest rate risk, liquidity risk and credit risk, and accordingly their effects on efficiency are analyzed via the NIM Model. The second model, or ROAA Model, includes operational risk as a supplement to the abovementioned financial risks. Then third model, or ROAE model, is analyzed in terms of how it adds leverage to the risks included in the other models. Lastly, the final model, referred to as ALL, measures how successful a bank is in maintaining its risks at some specific levels in order to maximize all of its outputs simultaneously.The rest of the paper proceeds as follows. In section 2, an overview of the European Banking System is presented. Efficiency studies in the banking sector, together with approaches about specifying inputs and outputs, are summarized in section 3. Section 4 provides models, methodology, variables and data. We then present our empirical results and analysis in the next section, with conclusions provided in the final section.
AN OVERVIEW OF THE EUROPEAN BANKING SYSTEM
The European banking sector has undergone continuous changes as a result of a numerous factors since the instatement of the First Banking Directive of the European Community in 1977. Developments related with European Union have been the core factor in shaping these changes. One of the initial steps was The First Banking Directive towards a single European banking sector and its purpose was to harmonize banking laws and eliminate barriers between members. The Directive on Consolidated Supervision (1983) was a further step in unifying the banking sector and it required that activities of banks be supervised based on their whole domestic and international consolidated financial conditions, thus preventing arbitrage between tight and loose regulated financial centers. The Second Banking Directive (1989), which came into force in 1993, was another cornerstone in regulating the European banking sector.
According to the directive, a single banking license was to be recognized among other member states, and based on the license of the home country banks were granted the right to establish branches and to trade in financial markets throughout the European Union (EU). But if it were deemed necessary for the protection of public interest, the host country retained the right to regulate the activities of foreign banks. The Second Banking Directive covered a broad range of activities within the scope of banking, including the principle of universal banking which constitutes the basis of German banking. In 1999, a single currency (Euro) was implemented and a Financial Services Action Plan (FSAP) was developed to ensure fully integrated and competitive capital markets and to remove any remaining barriers to cross-border provision of retail financial services. The overall objective of the FSAP is to attain a single market in financial services and it has been the key component of progress. Specifically, it aims at a single wholesale market, an open and secure retail market, and prudential rules and supervision (Richards, 2003). In 2007 two directives were implemented in light of the FSAP: the Markets in Financial Instruments Directive and the Capital Requirements Directives, which includes the Basel II standards. The creation of single financial market and the introduction of the Euro have led to converged interest rates and market structures of member countries until financial crisis of 2008, but later rates re-diverged based on the credibility of financial system.Despite all of the EU-specific and global incentives towards convergence and integration, the structure of the banking system and financial regulatory and supervisory framework still displays different characteristics among European countries, as each has gone through unique historical backgrounds and financial experiences (Group of Thirty, 2008).
As a result of mergers and acquisition, number of financial institutions decreased steadily in the last ten years.
According to the European Banking Federation’s statistics, the number of credit institutions of EU27 countries decreased from 9,496 in 2001 to 8,060 in 2011, and personnel number decreased by 99,126. But number of branches increased with 12,466 in the same period. Despite the 85% of total asset increase, total loans increased by 69% and total deposits by 87%. Excluding monetary financial institutions, loan to deposit ratio decreased from 130% to about 115%. Return on equity decreased to 4.2%, while ratio of non-performing loans to total loans increased to 6.0%.While the banking sectors in EU countries comprise the main focus of this study, non-EU countries, including the former socialist republics, also fall within the scope of the study. They have experienced similar changes in parallel to the EU, as they all have been exposed to the same global technological and financial developments. But naturally, the concentration and foreign share in developing countries possessing small banking sectors are higher. Some countries are already in the close peripheral for economic integration with the EU and the majority of them accept EU standards as a guide for shaping their sectors (Barisitz, 2008). All the countries in this study are members of the EBF which has as its mission “to position the European banking industry within the European and global regulatory frameworks.”
MEASURING EFFICIENCY IN BANKING
Bank performance measurement techniques, generally, can be categorized as frontier efficiency methodologies, ratio analysis, regression analysis and other techniques (Paradi and Zhu, 2013). Frontier based methods are the most used approaches and they differ based on the assumptions about shape of frontier, whether random error exists or not and distribution of inefficiency and random error components. These methods can be classified as parametric (stochastic frontier approach-SFA, thick frontier approach-TFA and distribution-free approach-DFA) and non-parametric (data envelopment analysis-DEA and free disposal hull-FDH).
Here, we will use the Slacks Based Model of data envelopment analysis to benchmark the performance and risk indicator of banks.Since initial application of DEA in banking sector to measure the efficiency of bank branches in 1985, DEA has been widely used to measure the efficiency of banks and bank branches and there are numerous studies analyzing different aspects ofbank efficiency. Berger and Humphrey’s (1997) survey is a milestone that summarizes the 130 frontier efficiency studies, from 21 countries, in which 69 applied DEA. Research of Fethi and Pasiouras (2010) is another important stage in reviewing studies after 1997 about bank performance. They specified 196 studies employing either operational research or artificial intelligence methods estimating various measures of bank efficiency and productivity growth from all over the world over the period 1998-2008 and they identified that with 151 studies, DEA is by far the most commonly used operational research technique in assessing bank performance. Of these studies, 30 analyze the efficiency of bank branches. For a bank branch efficiency survey, Paradi and Zhu (2013) found 275 DEA applications (195 about bank efficiency and 80 about branch efficiency) in the banking sector between 1985 and 2011.
Bank Modeling for Inputs and Outputs
Banks function in a broad spectrum of activities and they provide a wide range of heterogeneous services and products to their customers. Deciding input and output parameters for identifying bank efficiency depends on how you model a banking firm, which aspect of a bank you want to analyze and what your purpose is. Therefore, specifying inputs and outputs is a controversial issue in DEA (Berger and Humphrey, 1992). In addition to items derived from balance sheet and income statements, there are also some internal and external parameters that sometimes cannot be measured completely but should be considered in measuring efficiency, e.g., service quality, customer satisfaction, environmental conditions, and socio-economic development levels. Nonetheless, basically, we can indicate three approaches to efficiency measurement in banking; these are production efficiency, intermediation efficiency and profitability efficiency (Drake et al, 2009).
The intermediation approach, which is originated from Sealey and Lindley (1977) and is the most common one in measuring bank efficiency, estimates the efficiency of banks in converting resources (deposits, security issues, owner’s equity etc.) into assets (loans, other earning assets, etc.). Since assets are assumed to be output, in some studies the intermediation approach is defined as an asset approach. In this approach, the main function of banks is accepted to collect money from surplus spending units who have an excess of funds and lend these funds to deficit spending units who are in need of money.
The production approach (Benston & Smith, 1976; Berger & Humphrey, 1991) treats a bank as a production unit using some resources (personnel number or salary, equipment, other non-interest expenses, etc.) as input to produce deposits, earning assets, non-earning assets, interest income, non-interest income and other products. There is a large amount of literature on efficiency which treats banks as production units. However, the production approach is more common in analyzing branch efficiency rather than banks.
The profitability approach measures how efficiently a bank maximizes its profits by decreasing expenses while increasing revenue. Therefore, the cost-related items (personnel expenses, noninterest expenses, loan loss provisions, etc.) are used as inputs and revenue-related items (net interest income, non-interest income, etc.) are used as outputs. It is argued that by using loan loss provisions, a risk dimension also is included in the model (Drake et al, 2006). In contrast to the intermediation and production approach, deposits, loan, equity, personnel and so on are not used as inputs or outputs with the profitability approach. Drake et al (2009) indicate that in bank efficiency, the profit/revenue-based approach is likely to offer the most comprehensive analysis.
In addition to the intermediation, production and profitability approaches, there are many other aspects of banks, such as size, ownership, restructuring, merging, risk and other factors which have also been discussed in the related literature. For details of bank efficiency studies and examples of different approaches, please refer to Fethi and Pasiouras' (2010) study.
Considering Risks in Performance
All of the above approaches can be criticized for not integrating risks into the models employed. Triplett and Bosworth (2004) state that newer developments have not been considered in the theory ofbanking and they suggest that the risk-managing, information-managing and liquidity-providing roles of banks must be taken into account in future efficiency measurement studies. Allen and Sant- omero (1998) criticize intermediation theories for focusing excessively on the less important functions and products of financial institutions. They offer two important roles, instead, to be integrated with recent models of banking: the function of risk transfer and the increasing complex nature of instruments and markets.
Generally, loan loss provisions, or an indicator using it, have been accepted as a proxy for risk in bank efficiency studies. Sun and Chang (2011) criticize existing studies for mainly using credit risk indicators, including non-performing loans and allowance for loan losses and risky assets, but not considering other kinds of risk to explain efficiency. They recalled that the Basel Committee classified risks as credit risk, operational risks and market risks, and stated that a non-performing ratio is no longer the only index for risks.
As stated in a recent report published by the European Central Bank (ECB), ROAE is considered to be a poor performance measure of banks (ECB, 2010). The most common bank performance indicator, ROAE, reflects only one side of the coin since a good ROAE level shows either high profitability or low equity capital. The commonly used ROAE measures may not be sufficient to show banks' performance mainly because they are not risk sensitive and ROAE measures can expose banks to higher unexpected risk levels. A traditional risk and return analysis may not be adequate and the complete picture should take into consideration, especially in times of higher volatility, different risk dimensions for predictability and sustainability. In addition to profitability, the risk associated with profitability indicators should also be analyzed.
Bessis (2002) indicates that the disadvantages of ROAE, ROAA and other profitability measures are a lack of risk adjustment. Different assets cannot be compared without looking at their risk levels. The concept of a risk adjusted performance measure has arisen to eliminate this drawback.
In terms of the risk efficiency of banks, Berger and DeYoung's (1997) findings indicate that there is a two-way causality between problem loans and cost efficiency, and a one-way causality between poor capital adequacy and problem loans. Leaven (1999) criticizes the efficiency measurements performed by other academics for not including the risk-taking activities of banks and assuming that banks are risk neutral. In his working paper, he investigates the risk taking activities of banks and their cost efficiencies through the ownership structure of banks. The results suggest that the improved cost efficiency of banks mainly results from excessive risk-taking activities rather than true efficiency improvements. His results also show that family and company-owned banks tend to assume excessive risk and foreign banks tend to assume little risk.
DeYoung et al. (2001) investigate the relationship between banks’ risk-taking activities and regulations. Using data for 356 national US banks, they employ a three-step model to investigate this question. In the first step, they use a structural model of production to estimate the risk and return parameters of those banks. After plotting these results on a scatter diagram they estimate a best practice risk-return frontier for all banks. The inefficiency of each bank is calculated as the difference between its actual return and estimated return. In the third step they investigate the relation between CAMEL rating and expected return, risk, risk-return inefficiency and size for each bank. Their main finding is that regulators not only distinguish between the risk-taking activities of efficient and inefficient banks, but they also grant efficient banks more latitude in their investment strategies than inefficient banks. Fiordelisi et al (2011) examine the relationship between bank efficiency, capital and risk level of banks from 26 European Union countries. They find that lower efficiency lead to greater bank risk in the future, and long-term efficiency gain is important to support financial stability of banks.
Greuning and Bratanovic (2009) point out the importance of risk-based bank analysis which considers significant factors and ratios with a risk assessment perspective. In addition to changes and trends in risks, comparing a bank with the others is also important. In a risk-based bank analysis, a bank’s parameters, especially profitability, capital adequacy and structure of balance sheet, should be analyzed to determine whether they comply with industry norms and whether they deviate from other peer banks. At this point, DEA can play an effective role as a powerful benchmarking tool.
By their nature, banks are exposed to different financial and non-financial risks such as credit risk, interest rate risk, liquidity risk, foreign exchange risk and operational risk. Therefore, the success of banks is assumed to be largely dependent on the correct pricing of these risks and their efficiency in managing these risks in order to achieve and/ or protect their targeted profit margin.
MODELS, METHODOLOGY, VARIABLES AND DATA
Baltensperger (1980) underlines that a model which explains the behavior of banking firm must include (1) the characteristics of the two sides of the balance sheet, (2) the production aspects of banks and (3) all financial risks that banks are exposed to. In his so called complete model of the banking firm (Equation 1) the profit of banking firm, E(π), is expected to be a function of spread, (rE - tD); production cost, the difference between non-interest earnings and non-interest expenses (the burden) C (D,E); liquidity cost, L; solvency cost, S, and opportunity cost of capital, pW:
E(π)=rE-tD-C(D,E)-L-S-pW (1)
In this model rE - tD is named NIM that is simply the difference between weighted average interest earned on assets and weighted average interest paid for liabilities. Baltensperger (1980), as borrowing from Klein (1971), discusses that return on loans is subject to credit risk and therefore it is expected that return on marginal loan to be smaller than the rate of return on previously extended lo ans due to the increasing level of credit risk. On the other hand in a competitive environment a bank that wishes to increase its deposit volume must pay higher interest that will in turn increase the marginal cost of borrowings. Thus it is implied that there is a negative relationship between size and expected profitability rate within the context of credit risk and funding risk, if the risk is not managed properly. However, it is important to note that the capability of banks in managing their credit and deposit portfolios indeed differ substantially from each other and that also has great impact on their riskiness and profitability ratios. It is also important to realize that the larger a bank the higher energy that it can allocate to the management of its credit portfolio and/or credit risk. That could well result in a positive relationship between size and profitability.
On the other hand, interest rate movements are exogenous to any bank. Thus any movements in rates could change both the lending and the borrowing rates of a bank. The effect of rate movements on assets and liabilities could not be equal due to the remaining times to maturity of assets and liabilities. An asset or a liability with a short maturity will feel the effect of rate movements immediately and the others with longer maturities will be affected with a time lag. The average maturity of assets could be different than that of liabilities as creating a maturity mismatch. Depending on these maturity mismatches between assets and liabilities of a bank, rate movements could work in favor or against that bank. That makes NIM basically not only subject to default risk but also to interest rate risk as well. Again, it is very likely that all banks have identical maturity mismatch on their balance sheets due to their businesses, expectations; policies etc., besides the capabilities of banks in managing interest rate risk are not identical. Thus the effect of rate movements on their balance sheets will substantially differ from each other.
Moreover banks will be reluctant to increase rates on deposits in a rate rising climate and contrary to that they will push up rates on their loans immediately. Banks will probably react in an opposite direction when rates fall.
Although it is not referred in Baltenspergefs Model, the NIM figures of banks those hold foreign assets and liabilities on their balance sheets will also get affected by the movements in foreign exchange rates. The preferences of banks with regard to holding foreign assets and liabilities differ from each other as resulting in different measurements of foreign exchange rate risk for each individual bank as affecting their NIM figures.
Again as borrowing from Klein (1971) B altens- perger (1980) defines liquidity cost, denoted by L, as a function of reserves and deposit withdrawals. The amount of reserves to be hold is determined at the point where the marginal return on reserves equals to the marginal cost (a penalty) paid for reserve deficiency. So investing in cash reserves prevents banks from falling in a reserve deficiency. As a result a liquidity cost occurs for banks that try to eliminate the probability of reserve deficiencies. Keeping less or more reserves could well increase the liquidity risk and liquidity cost of banks. Again depending on each bank’s risk appetite, liquidity policies, regulations, environment, expectations, management capabilities and etc. each bank’s liquidity risk and liquidity cost is expected to differ from the other banks’ risk and cost. Of course, investing in reserves decreases a bank’s liquidity risk while diminishing its profitability.
Production cost of assets and liabilities in the Baltensperger’s Model, C (D, E), is named burden in banking jargon, which can be defined as the difference between non-interest earnings and non-interest expenses. These interest free income and cost is subject to operational risk which can be defined as a risk arising from the execution of a company’s business functions. Banks’ preferences, policies and capabilities will result in different levels of operational risk and operational cost for each different bank. Thus each bank’s profitability will be affected by different magnitude of operational risk. This risk or cost, since it is not related to interest activities, is not counted amongst risk affecting NIM. Thus it is related to return on assets (ROA) in this article.
The final risk mentioned in Baltensperger’s model (1980) is solvency risk, S, which is defined as solvency cost as the cost of capital that is needed to operate the bank. He defines this cost as the difference between cost of capital and cost of deposit. The amount of capital to hold is determined where the marginal cost of deposit is equal to marginal cost of capital. However, since the existence of regulations the amount and the structure of capital to be hold by banks depend not only on their preferences but also on the capital adequacy standards as well.
A general Return on Equity (ROE) model is formulated as shown in Equation 2.
ROE=ROA-LM (2)
where ROA stands for return on assets and LM represents leverage multiplier. Replacing ROA in equation with right side of Baltensperger’s model as ignoring cost of liquidity, cost of solvency and opportunity cost of capital, we get:
ROE=((rE-tD)-C(D,E))LM (3)
Developing the efficiency measurement of banks on Baltensperger’s (1980) model, the efficiency of a bank can be divided into two parts. The first part can be named “cost efficiency of banks” and the second part of efficiency can be named “risk efficiency of banks.” In the related literature on bank efficiency a great attention has been lent to cost efficiency, however risk efficiency has attracted little emphasis.
The measurement of complete efficiency of a bank should include both parts of efficiency that can be derived from the Baltensperger’s model. Therefore, NIM, (rE - tD), will be affected by credit risk, interest rate risk, liquidity risk and foreign exchange rate risk. ROA which is equal to (rE - tD) - C (D, E)) is affected by all risks affecting NIM plus operational risk. Finally ROE will be affected by all these risks plus solvency risk.
To analyze whether the profitability indicators of European banks are reasonable in comparison to their risk levels, the study is carried out based on four approaches. In the first model we benchmark the NIM of banks assuming that it is mostly influenced by interest rate risk, liquidity risk and credit risk. The ROAA model investigates the success of ROAA considering operational risk in addition to previous risks. In the third ROAE model, we shed light on the success of banks in attaining ROAE ratios based on risk appetite by adding leverage to other risks. The efficiency of utilizing all risks to maximize all profitability indicators simultaneously is measured under the model named ALL (Figure 1).
With the study of Charnes, Coopers and Rhodes (1978), the efficiency measurement method was brought to a new stage. They put into practice the non-parametric Data Envelopment Analysis (DEA) model to measure the efficiency of a decision making unit (DMU) based on frontier analysis. Since then, in addition to basic models, many variations and orientations of DEA have been developed to measure the efficiency of different sectors in a wide range of businesses, including the banking industry as well.
DEA is an effective nonparametric benchmarking and efficiency measurement tool which can be used with multiple inputs and outputs. Since we want to benchmark performance indicators of different banks in comparison to their risk preferences, DEA seems to be the most suitable tool. It measures the efficiency of a unit by maximizing the ratio of weighted outputs to weighted inputs, and the ratio is normalized according to observed best performing peers to be between 0 and 1, as 1 representing efficient unit. Others are compared with best units and then are assigned relative values between 0 and 1.
In this study a Slacks Based Model (SBM) of DEA which was developed by Tone (2001) is used. The radial models, CCR (Charnes, Cooper and Rhodes) and BCC (Banker, Charnes and Cooper) measure efficiencies calculate efficiency ratios, between 0 and 1, and the amount of input or output slacks. The non-radial model SBM deals with input excess and output shortfall simultaneously and incorporates slacks into calculations resulting in a scalar measure again between 0 and 1. Since it takes input slack and output slack into account at the same time, it identifies more sources of inefficiency and in some situations it reflects a more complete picture, and also compared to other models it has more discriminatory power.
Figure 1. Models and their inputs and outputs
Emrouznejad and Amin (2009) warn that utilizing financial ratios may be required in the efficiency measurement of financial institutions and using ratio data in standard DEA models as input and/or output may result in incorrect scores. Hollingsworth and Smith (2003) suggest employing a BCC model instead of CCR to prevent incorrect and perverse results when using ratios as input or output. In addition to neglecting slacks, oriented-radial models may also result in infeasibility (Cooper at al, 2007). Additionally, Avkiran (2011) points out the increasing usage of a tendency in favor of SBM among DEA models in the last ten years.
SBM is not translation invariant; it can be used with inputs that are equal to or greater than zero (semi-positive) and outputs that are either positive, zero or negative (Cooper at al, 2007). Considering our data, choosing SBM seems more reasonable, because in our study we use risk indicators as inputs and performance indicators such as NIM, ROAA and ROAE, which sometimes can be negative because of losses, as outputs.
DEA projects inefficient units to efficient frontier either with input or output orientation. When the purpose is benchmarking rather than input minimization or output maximization, SBM gives the option to use a non-orientation version. We prefer DEA Window Analysis, with a 4 year window, to track changes over time and compare the efficiency in different years by making use of a panel data of the 2006-2009 period. A bank in a particular year is compared with its observations in other years and the observations of other banks, by treating it as if it were a different bank (Paradi, 2011). For us, a four year period was deemed reasonable considering the drawbacks of using a non-optimum length of period, which may be affected by technological changes or display less discrimination, etc.
For this study, we started with the data of active commercial banks in the 44 member countries of the European Banking Federation, and have total assets of a minimum USD 1 billion for the 2009 year end. The data was retrieved from the BankScope database and we started with about 950 banks. Then, banks without proper data, banks with less than 5 branches, banks with less than 20 employees, accidentally listed investment banks, and leasing, factoring and consumer financing companies were eliminated. Since data quality is crucial in frontier efficiency methods, we paid special attention to making sure that outliers were discarded. DEA is quite sensitive to extreme values and to outliers and detecting outliers is a critical matter. Since extreme points constitute the frontier, efficiency scores calculated from datasets that include outliers can be misleading (Tran et al, 2010). In particular, if an outlier belongs to an efficient frontier, it can incorrectly be used as a benchmark and this can distort all other measurements (Ondrich & Ruggiero, 2002). To prepare the data, the banks with unfeasible or unusual ratios such as “average loan/average assets” exceeding 97%, and an ROAE of greater than 100% were discarded. We also truncated banks whose input values (credit risk, interest rate risk, liquidity risk, operational risk and leverage) and output values (NIM, ROAA and ROAE) were inconsistent with the remainder of the set of data. Then we repeatedly ran the non-oriented Super SBM model and deleted banks that had a very high super-efficiency scores compared to the others and banks that had a high frequency in the reference set. As a result, we ended up with 697 banks from 37 member countries of the EBF.
According to EBF statistics, the total assets of the 44 members totals about USD 64 trillion in 2009, and our data covers 78% of a total sum of USD 50 trillion. The UK banking sector constitutes the largest share in our data, at 22%. France, Germany, Italy, Spain, Netherlands, Switzerland are represented at 18%, 13%, 7%, 7%, 6% and 5%, respectively, indicating that the share of seven countries comprises 78% of the total sector studied.
Banks are exposed to risks that can be divided into two components. The first component is exogenous and is generated from outside of banks as a result of volatility, and therefore it can be accepted as the systemic part. The second component is endogenous and is generated within banks as a result of sensitivity, and therefore, it can be treated as the non-systemic part (Eken, 2005 a). Systemic risks cannot be controlled by banks; however, non-systemic risks, to some extent, are controllable.
The more risk a bank takes, the less liquid a bank is; and the longer the term of its assets, the more profitable it should be. Therefore, when designing the DEA models, we considered specifying inputs and outputs in this manner. Since we sought to analyze whether the conventional performance indicators are reasonable in comparison to their risk profiles, the endogenous parts of risks, which are credit risk, interest rate risk, liquidity risk, operational risk and leverage, are used as inputs in this study. These banks belong to very different banking systems across a wide geographical region; therefore we could not collect data about exposure to foreign exchange risks. The proxy used for credit risk is the ratio of “average loans/ average assets.” An “(average interest sensitive assets-average interest sensitive liabilities)/aver- age total assets” ratio was used to represent interest rate risk and the nominator of the ratio is the gap between interest sensitive assets and liabilities. Since, depending on the volatility of rates and a bank’s long or short position, the gap may result in revenue or loss. Liquidity risk, together with deleveraging, is one of the most discussed issues in the post-crisis period because of the suffering from a lack of liquidity. Banks are expected to be prudential enough to fulfill their responsibilities resulting from deposits and funding through liquidity reserves. Therefore, instead of a “liquid assets/total deposits & borrowing” ratio, we preferred to use “liquid assets/deposits & short term funding” for the liquidity risk. But since more liquidity actually means less liquidity risk and higher risk should cause more profit, we utilized the reciprocal of proxy in our measurements. A “total net non-interest operating income/total equity” ratio was used as a proxy for operational risk. Our assumption parallels Basel Committee’s proposed gross income to calculate operational risk which is a basic indicator approach one of three approaches for capital requirement needs. Since it is not reasonable to assign a negative value for risks, we applied absolute values for operational risk indicators. High leverage has been accepted as the main reason for the recent global credit turbulence; in line with this, recent discussions for reforming and restructuring the financial systems have sought the optimum leverage ratios to prevent a similar financial crisis. “Average assets/ average equity” was used as a proxy representing leverage risk.
In this study, ratios related with profitability are employed as outputs. The first output is NIM which is defined as the net interest income over average earning assets (or total assets). It is one of the most important indicators used in observing the performance of banks. Based on this model, the efficiency of banks is related to their interest rate risk, credit risk and liquidity risk. Also some external factors (such as market structure, concentration and competition, regulatory banking environment, degree of information asymmetry, and development level of banking sector) have some influence on the interest margin (Maudos et al, 2004; Demirgug-Kunt et al, 2003). NIM is the reward of financial risks (credit risk, interest rate risk, foreign exchange risk, and liquidity risk) undertaken and risk management techniques employed by banks to combat risks. For this reason, in order to be regarded as successful, a bank should sustain its NIM ratio in comparison with its risk level. The second output is ROAA and it is calculated by dividing the net income by average assets. ROAA is an indicator reflecting management performance and it measures how efficiently a bank utilizes its assets to generate profit. ROAA is assumed as a reward of exposure to financial risks plus operational risk. The final output ROAE is another critical profitability ratio and can be defined as the net profit earned in comparison with the total amount of average shareholder equity. It can be accepted as the prize received for purchasing and managing financial risks, and operational risk plus leverage risks together. Since ROAE is determined by ROAA and a leverage multiplier, in addition to financial risks and operational risk, it involves compensation for leverage as well. To increase ROAE ratio in comparison to ROAA, which is what shareholders seek, banks tend to leverage their equity within the framework of capital adequacy regulations.
The descriptive statistics of inputs and outputs are presented in Table 1.
Table 1. The descriptive statistics of data
| Data | Mean | Std. Dev. | Min | Max | CV |
| Credit risk | 55,3% | 25,2% | 0,0% | 97,2% | 45,6% |
| Interest rate risk | 7,0% | 6,4% | 0,0% | 66,0% | 90,8% |
| Liquidity risk | 6,6% | 17,6% | 0,1% | 518,1% | 266,1% |
| Operational risk | 26,6% | 81,6% | 0,0% | 3700,0% | 307,0% |
| Leverage | 1886,7% | 2329,7% | 126,8% | 73675,5% | 123,5% |
| NIM | 2,6 | 2,1 | -1,1 | 19,4 | 0,8 |
| ROAA | 0,7 | 1,2 | -10,9 | 9,2 | 1,7 |
| ROAE | 8,7 | 17,0 | -245,0 | 82,2 | 1,9 |
Banks are categorized based on the assets size of the 2009 year-end. 32 banks with more than 500 billion USD assets are assumed to be XXL, 17 banks with 250-500 billion are assumed to be XL, 33 banks with 100-250 billion are assumed to be L, 87 banks with 25-100 billion are assumed to be M, 109 banks with 10-25 billion are assumed to be S, and 419 banks with less than 10 billion are assumed to be XS. Banks that are publicly known to suffer from some problems, like capital adequacy, liquidity etc., and/or got government help are assumed as problematic and others as healthy.
EMPIRICAL RESULTS
Risk Efficiency in NIM Model
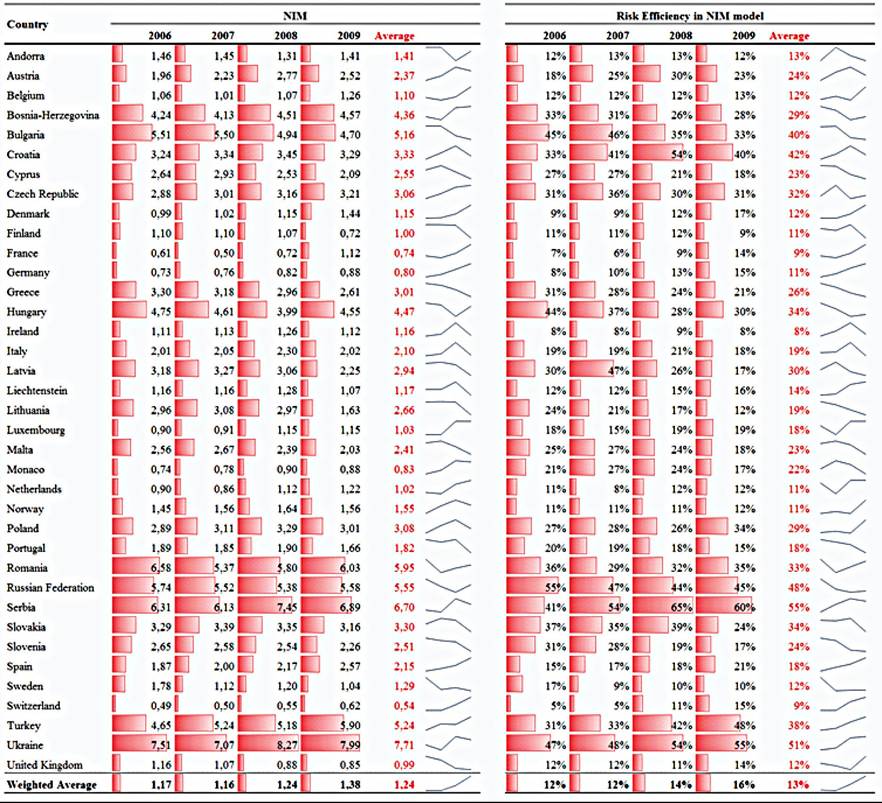
The NIM values and risk efficiencies for the NIM model are summarized in Table 2 on country basis for the period of 2006-2009. The risk efficiency shows how parallel the profitability of banks is in terms of their risk levels. First of all, the overall weighted average of risk efficiency of all banks for the whole period is 13% which is very low and indicates that despite discarding outliers, banks are spread over a wide range of efficiency, but are mostly on the inefficient side of the range. Low efficiency implies that there is an extensive difference between banks of the same the country and banks in different countries. Nonetheless, NIM and risk efficiency has increased over time, except for 2007, which indicates easy market conditions.
Both correlation and Spearmen’s rank correlation between NIM and risk-adjusted NIM are 73%. This indicates a positive correlation as expected but at the same time shows that there are also banks which diverge from the others. It also indicates that the risk-adjusted NIM picture of banks is not entirely the same as the NIM picture alone.
The efficiency scores of 697 banks were estimated first. Then, using a weight (banks’ total assets/country’s total assets) for each bank, an efficiency figure was generated for each country for each year of the period in analysis. Thus the figures depicted in Table 2 are weighted average NIM and efficiency scores calculated via the NIM model.
Looking at the largest banking sectors, in Germany and Spain and France, (with the exception of a slight decrease in 2007) there is a steady increase in efficiency. Inefficient banks in 2006 experienced greater improvement in the following years which diminished the gap between efficient and inefficient banks. The UK represents a notable case; despite a decrease of NIM, efficiency has gradually increased.
As can be seen from the Table 2, even when the NIM of banks is similar, their risk efficiency may be completely different. For example, while the NIM of the Serbian banking sector was 7.45% in 2008 and the Ukrainian banking sectors was 7.51% in 2006, the risk efficiency of the Serbian sector is 65% in contrast to Ukraine’s 47%.
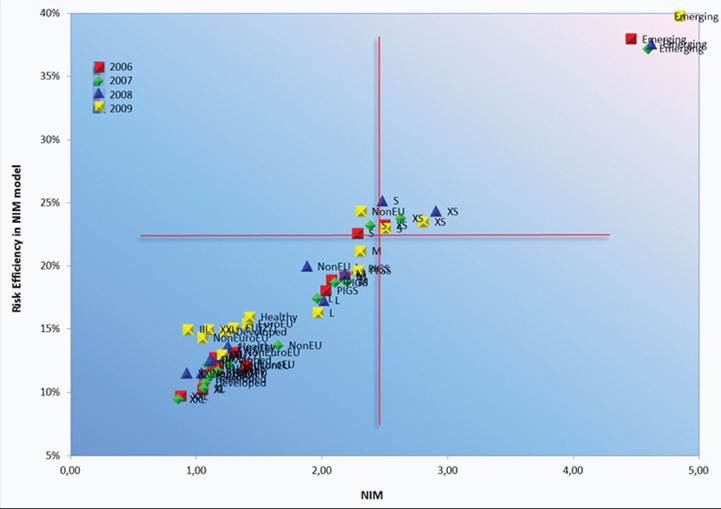
The NIM and risk efficiency components of banks can be analyzed based on four separate regions, as shown in Figure 2. “High NIM-high risk efficiency” is the target region and it is preferred that banks operate in this area. In our study, these sectors generally seem to be composed of small banks in small countries. Banks in the “high NIM low-risk efficiency” region are also small in size and have high risk levels, and they should revise their risk profile considering the alternatives for decreasing risk while maintaining profitability. Banks in the “low NIM-high risk efficiency” region represent banks with low margins but which are exposed to comparatively lower risks. Their risk level may be satisfactory but their profitability is not, and they must increase profitability even further by taking more risks. The largest banks in the most developed and competitive sectors appear in the “low NIM-low risk efficiency” region.
The NIMs and risk efficiencies for different unions, development levels, ownership, and exchange listing status, size, and state of health are presented in Table 3 and Figure 3. The risk
Table 2. NIM and risk efficiency in NIM model (countries)
efficiency of EU and non-EU countries are the same in 2006 and in subsequent years generally an improvement has been observed; but by the end of 2009, non-EU levels reached 24% compared to the EU’s 15%.
Banks in emerging countries (central and southeastern Europe, the Baltic region, Russia and CIS countries) tend to be more risk efficient than developed countries as a result of their high NIM values. But although the NIMs of emerging countries in the entire period are almost four times that of developed countries, their risk efficiency is a third of that; this shows that developed countries have relatively better risk management. Clays and Vennet (2008) stated that NIM is often higher in inefficient, non-competitive, un-concentrated, inadequately regulated markets that have information asymmetry and entrance barriers. Since the interest rate levels are also high in these countries, they get the reward of high risk taking as high premiums. As a result of more transparency, ease of access to financial products and high competition, together
Figure 2. Risk efficiency in NIM model (countries)
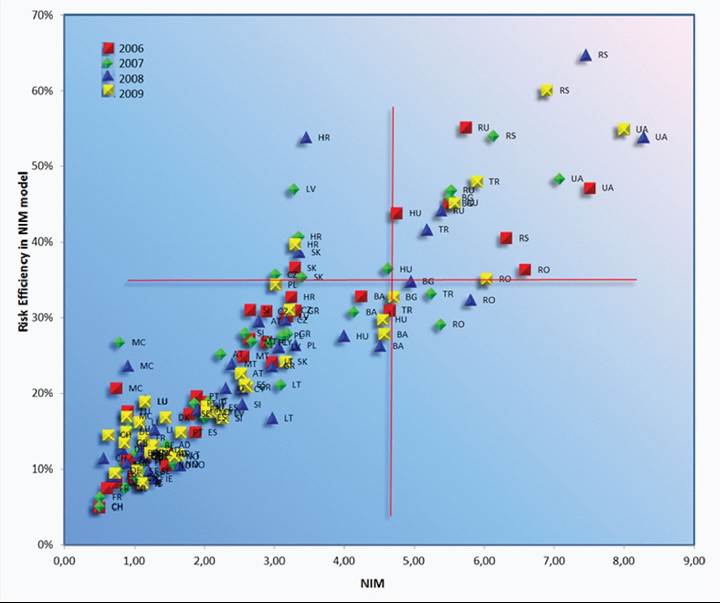
Table 3. NIM and risk efficiency in NIM model (regions, unions, development level, size etc.)
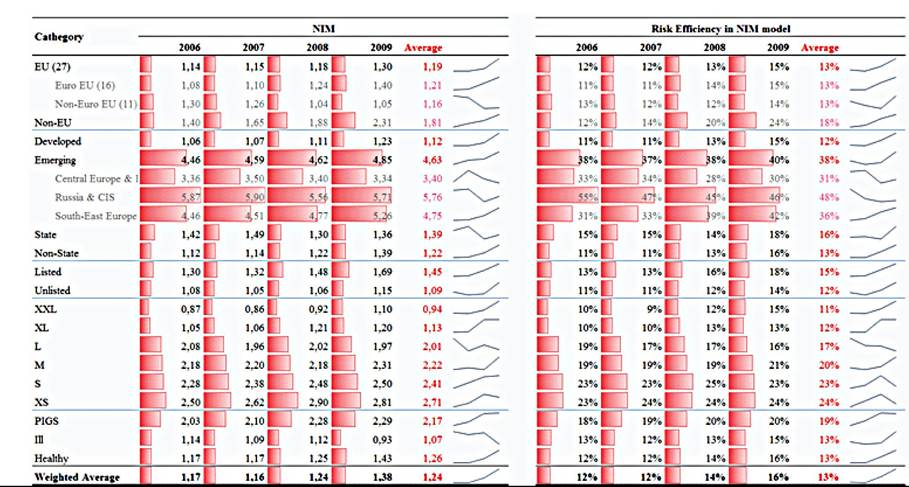
Figure 3. Risk efficiency in NIM model (regions, unions, development level, size etc.)
with the lowest interest rates on the continent, NIMs in banks of developed countries are very low and it may be marginally more difficult to further decrease their risk levels which may result in low risk efficiency. Among emerging countries, those in Eastern Europe have gradually increased their efficiency, in contrast to central Europe, Baltic countries, Russia and CIS countries, which have witnessed decreases. Another noticeable point is that they increased their NIM in spite of the credit crisis of 2008.
In terms of size, banks which are on the smaller side of the scale maintain higher efficiency rates than banks of all other sizes. The least efficient banks are found to be XL and XXL banks. Based on these results, it can be inferred that smaller banks tend to move quickly and/or adapt to changes effectively. Domestic banks are found to be slightly more efficient than foreign banks, and state banks and listed banks were also found to be more efficient than non-state banks and unlisted banks.
Risk Efficiency in the ROAA Model
The ROAA of European banks and their risk efficiency associated with ROAA is summarized in Table 4. In general, as in the case of the NIM model, the weighted average of efficiency is very low at 9%, indicating that there is a great margin for inefficient banks to either increase their profitability or decrease their risk level in comparison to efficient banks. ROAA decreased from 2006 to 2007 but dramatically fell in 2008, as a reflection of the credit crisis. Risk efficiency is in parallel with the ROAA trend, but the recovery in 2009 does not equate with profitability.
In comparison to the NIM model, ROAA’s overall risk efficiency is lower, and this shows that since additionally operational risk is integrated, an increase in banks’ profitability is not enough to justify the risk increase, so the additional risk does not add more premiums to profitability. The correlation between ROAA and risk efficiency is
Table 4. ROAA and risk efficiency in ROAA model (countries)
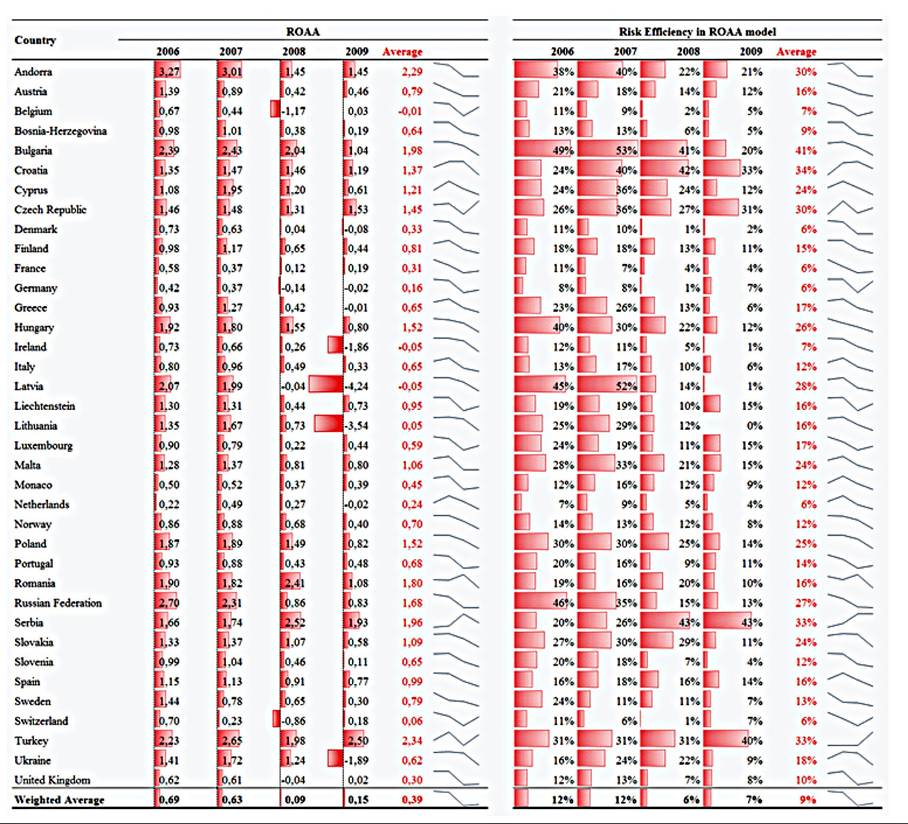
also high at 69% and a rank correlation of 89%. Turkey and Serbia are the only countries that have not contended with a decline in efficiency during the whole period. Serbia’s efficiency experiences the largest jump in 2008, and as a result of ROAA losses, Latvia’s free fall from 2007 to 2008 represents the largest decline.
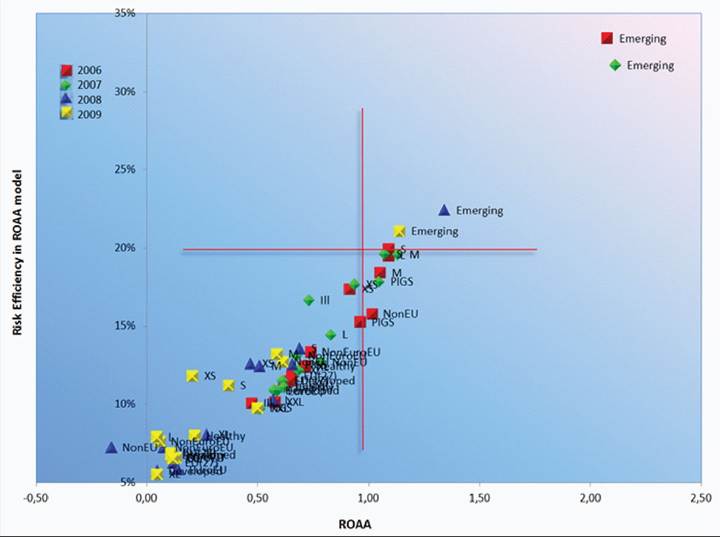
Figure 4 shows the weighted average of ROAA and risk efficiency in all countries. As can be seen from the figure, when the ROAA of banks are similar, their risk efficiency may be completely different. For example, Romanian banks’ risk efficiency was 20% while the ROAA was 2.41 in 2008, and Serbia’s risk efficiency was 43% at 2.52 ROAA in the same year. Bulgaria’s risk efficiency was 53% at 2.43 ROAA in 2007. Banks are expected to increase both their ROAA and risk efficiency to be located within the “high ROAA-high risk efficiency” region. Turkey and Serbia are examples of this region with efficiency
Figure 4. Risk efficiency in ROAA model (countries)
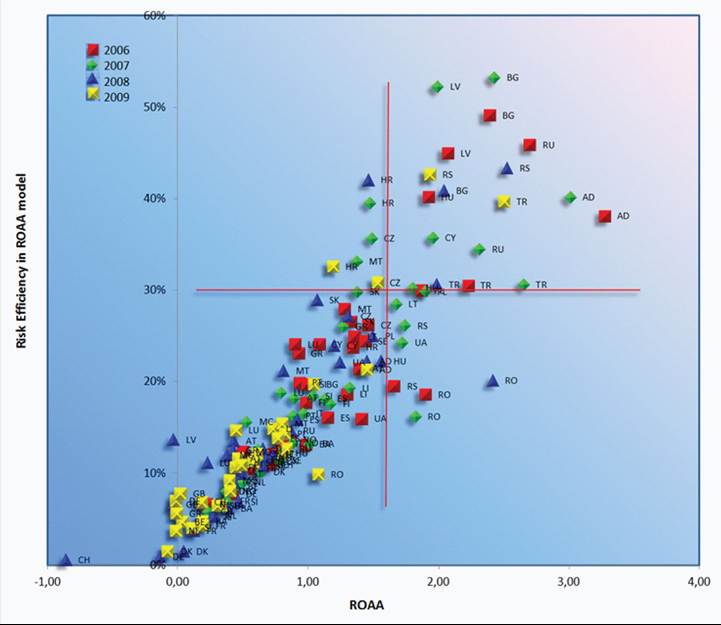
of 2009 compared to their ROAA. Banks in the “high ROAA-low risk efficiency” region should be careful as they may be content with high ROAA values which actually conceal low efficiency. For example, Romania’s high profitability indicators in 2006, 2007 and 2008 were associated with low efficiency and in 2009 a sharp decrease both in ROAA and risk efficiency were experienced. As can be seen from the figure, the risk efficiency of the small banking sector is more volatile as they can more easily be affected by fluctuations.
ROAA and risk efficiency based on ROAA for different categories are presented in Table 5 and Figure 5. In both the Euro and non-Euro EU region, there was a sharp decline in ROAA until 2008 and then a small decrease in 2009; on the other hand, efficiency stayed the same in 2006 and 2007. Then a moderate decrease was experienced in 2008 and in 2009 a small recovery was observed. For the non-EU region, there was a decrease both in ROAA and risk efficiency until 2008; but risk efficiency loss was eliminated in 2009. This may indicate that banks adopted their risk profile to the profitability loss of 2008 with a one-year lag in the non-EU area.
Both developing and emerging markets’ banking sectors suffered in terms of efficiency, and generally ROAA loss, during the period under study. Efficiency loss is more apparent especially for Russia and CIS countries, and banks in southeastern Europe outperformed the others but this could not prevent an overall trend of deterioration in emerging sectors.
Categorizing banks according to size shows that the least efficient XXL banks were the most affected by the financial crisis in 2008 as indicated
Table 5. ROAA and risk efficiency in ROAA model (regions, unions, development level, size etc.)
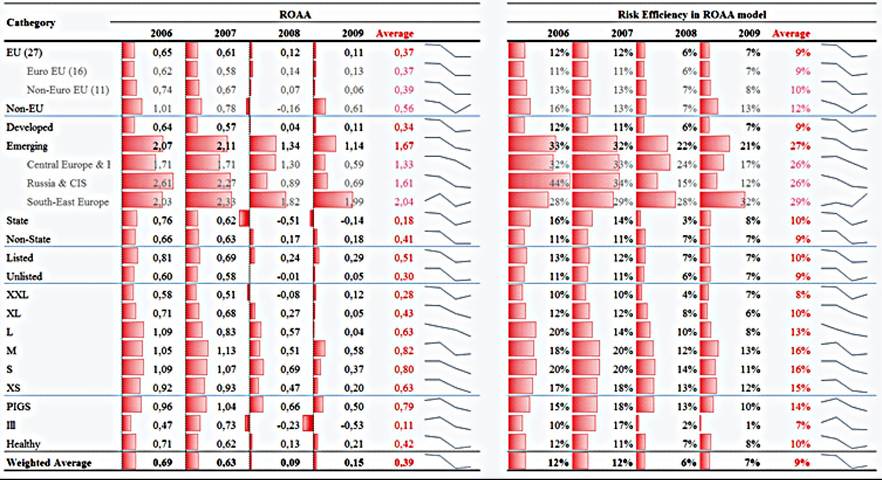
Figure 5. Risk efficiency in ROAA model (regions, unions, development level, size etc.)
by decreasing ROAA and risk efficiency. Smaller banks seem to be more risk efficient but recently there has been a trend towards conglomeration with large banks. In terms ofill and healthy banks, we see a sharp decline in both ROAA and the efficiency of ill banks after 2007. Healthy banks experienced a slight recovery in 2009 but the risk efficiency improvement was not proportional to the increase in ROAA.
Risk Efficiency in the ROAE Model
Table 6 shows the ROAE and risk efficiency of different countries based on ROAE. ROAE slightly decreased in 2007 but the financial crisis reduced it to a negative figure in 2008. Although a slight improvement was indicated, risk efficiency showed no recovery in 2009.
Table 6. ROAE and risk efficiency in ROAE model (countries)
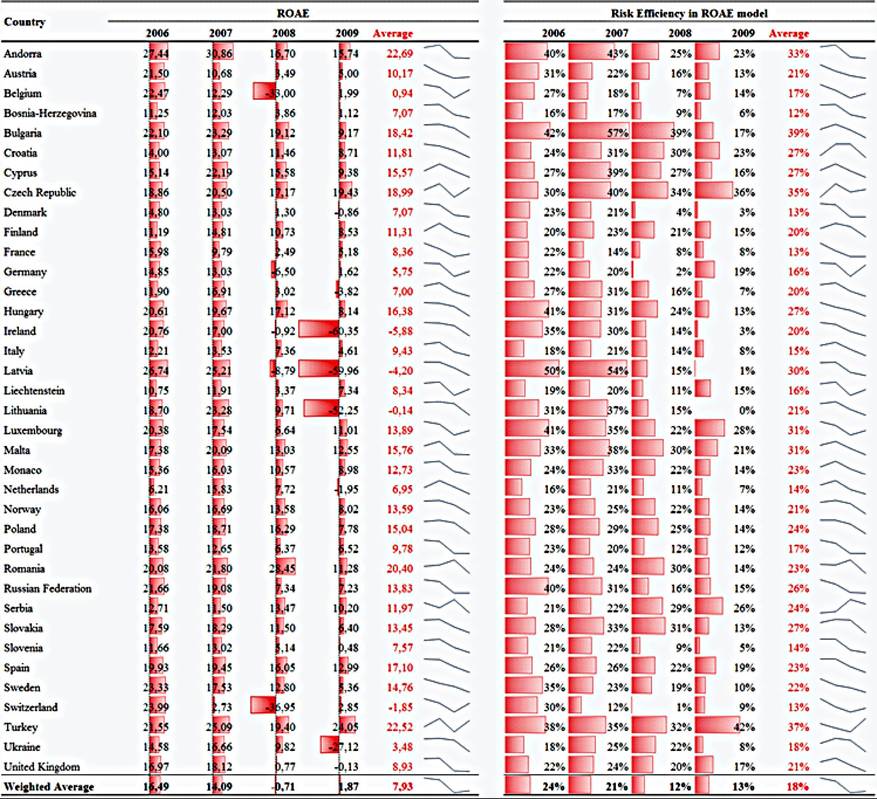
In general, risk efficiency is still low within and among countries; however, it is greater than the efficiency based on NIM and ROAA which implies that banks are more similar as regards the managing of risks associated with ROAE compared to other models. Since only leverage is integrated as an additional risk factor, the capital adequacy regulations which are part of all banking sectors may have facilitated the convergence. 59% of correlation and 90% of rank correlation values show that as ROAE increases so does risk efficiency.
Another noticeable figure is that only a few countries’ banking sectors (Germany, Turkey, Czech Republic, and Luxembourg) experienced increases in efficiency from 2008 to 2009. In 2009 although the ROAE of France almost tripled that of Germany, its risk efficiency was less than half, which means that Germany was more successful in managing risks to attain profitability levels. Comparing the four year period, only Turkey, Serbia and the Czech Republic indicated efficiency increase. The most dramatic decrease was measured for Latvia, with a drop from 50% to 1%. Among the largest five, the German banking sector was the most heavily affected by the financial crisis in 2008, but taking into account all four years it has been the least affected.
Figure 6 compares the weighted average of ROAE and risk efficiency in all countries. Like other models, the ROAE of banks does not necessarily reflect their risk level. The largest difference in the rank of ROAE and rank of efficiency was noted for Slovakia, with values of 87 and 29 in 2008. Romania’s ROAE rank was 15, its efficiency rank was 61 in 2007. Similarly, as in the other
Figure 6. Risk efficiency in ROAE model (countries)
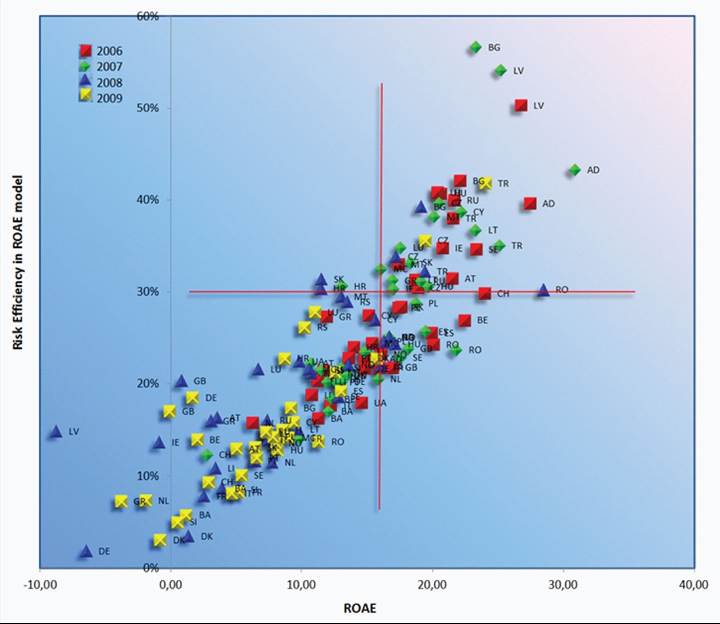
models, we can classify the banks in terms of high/ low ROAE and high/low risk efficiency results.
Table 7 and Figure 7 indicate ROAE and the efficiency of different regions and sizes. The sharp decline in efficiency of the Euro-EU area in 2008 was followed by a slight recovery in 2009. ROAE of non-EU area banks was the worst in 2008, but in parallel to improvements in 2009, efficiency also doubled, converging with the Euro-EU region.
Banks in developed countries suffered from a substantial decrease in ROAE in 2008, but because of deterioration in all countries, the efficiency loss was not as noticeable as the profitability losses. Emerging countries underwent a steady decrease between 2006 and 2009. As in the case of the ROAA model among emerging sectors, southeastern Europe displayed better risk efficiency performance.
A classification of banks based on size shows that in both 2006 and 2007 ROAE and risk efficiency were homogenously distributed across all categories. In 2008, XXL banks experienced profitability loss and then, with a one year lag, XL and X banks experienced the same. The same situation was observed in terms of efficiency progress. Despite the ROAE fluctuations for different years, efficiency volatility comparatively was more stable. As regards ill and healthy banks, both the ROAE and efficiency loss of ill banks was clearly and increasingly noticeable in 2008 and 2009.
Risk Efficiency in the ALL Model
The risk efficiencies calculated in the ALL model, where inputs are credit risk, interest rate risk, liquidity risk, operational risk and leverage, and outputs are NIM, ROAA and ROAE, are presented in Table 8 on a country basis. The weighted average of risk efficiency is low, as in the other models. In the NIM model, efficiency increased from 12% to 16% in the last four years, whereas in the ALL model when operational risk and leverage were integrated it declined from 15%
Table 7. ROAE and risk efficiency in ROAE model (regions, unions, development level, size etc.)
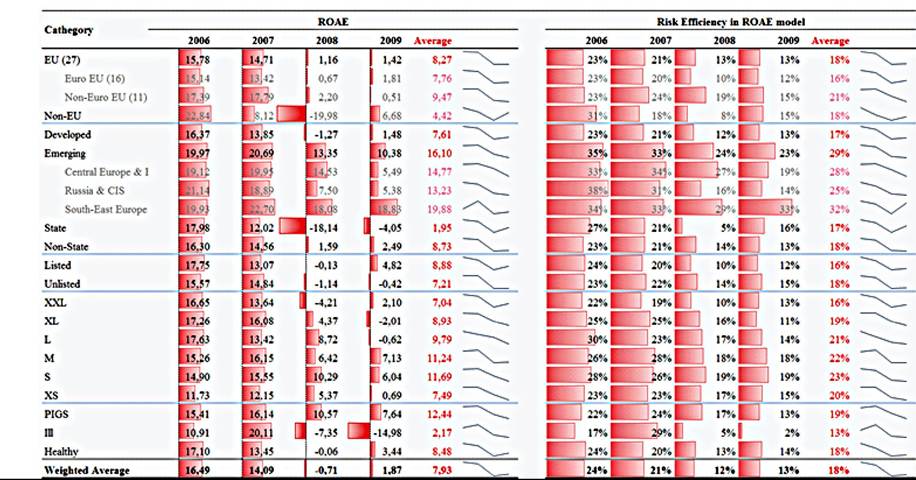
Figure 7. Risk efficiency in ROAE model (regions, unions, development level, size etc.)
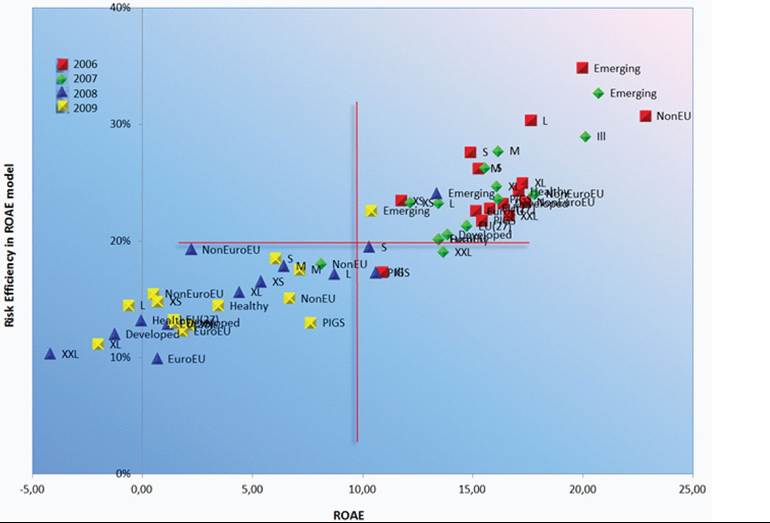
to 11% which means that most of the banks have not been successful enough at managing these risks to increase profitability.
As regards the largest banking sectors, France and Germany underwent a decrease in efficiency in 2008, followed by recovery. The UK and Italy suffered losses in 2009.
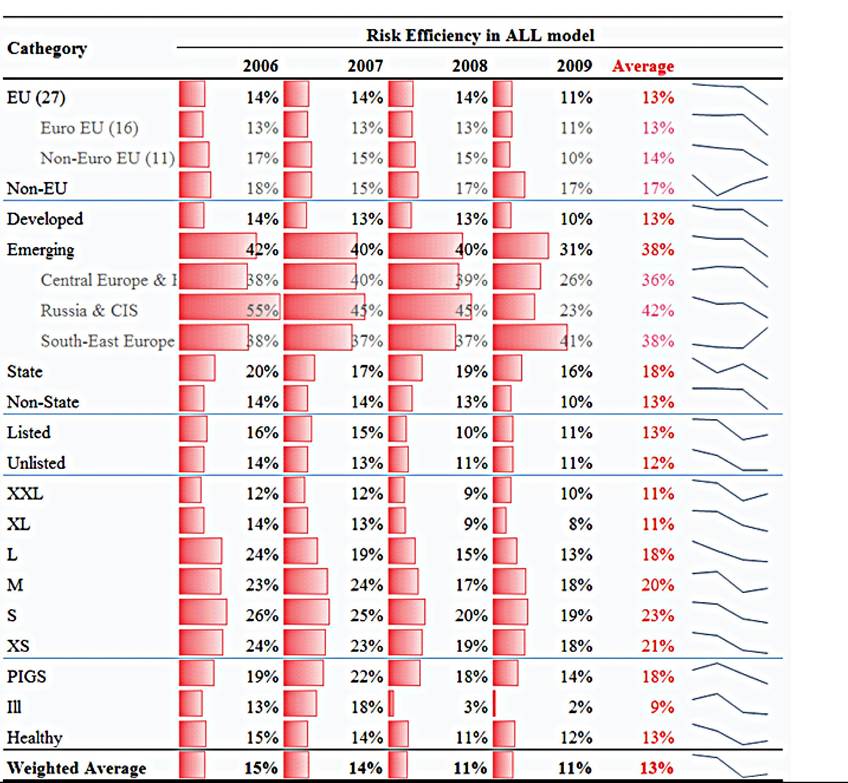
The risk efficiencies for different categories in the ALL model are summarized in Table 9. All sectors experienced efficiency loss in 2008 and that remained the same in 2009. In terms of size, the efficiency of S banks outperformed the others in all periods and the same situation is observed in all other models. Further analysis is needed to examine whether there is an empirical optimum bank size in terms of ability to adapt to new situations. Similarly, for all of the models, the efficiency of XXL banks is the lowest. One reason is the competitive market conditions in which they operate and the other reason may be the difficulty of changing the structure of their balance sheets to decrease exposure to risks, or the difficulty of improving profitability.
In 2008, there was a notably sharp decline in the efficiency of ill banks, and deterioration continued at a slower rate in 2009. The same trend is observed in the efficiency of PIGS banks to a smaller extent. Healthy banks kept the decrease to a narrow limit and even in 2009 they demonstrated small improvements.
CONCLUSION
NIM, ROAA and ROAE have traditionally been used to analyze the performances of banks. But these ratios have been criticized for being insufficient in the effective measurement of the performance of banks, since they do not take into account the risks (credit risk, interest rate risk, foreign exchange risk, liquidity risk, operational risk and leverage) associated with them. The recent
Table 8. Risk efficiency in ALL model (countries)
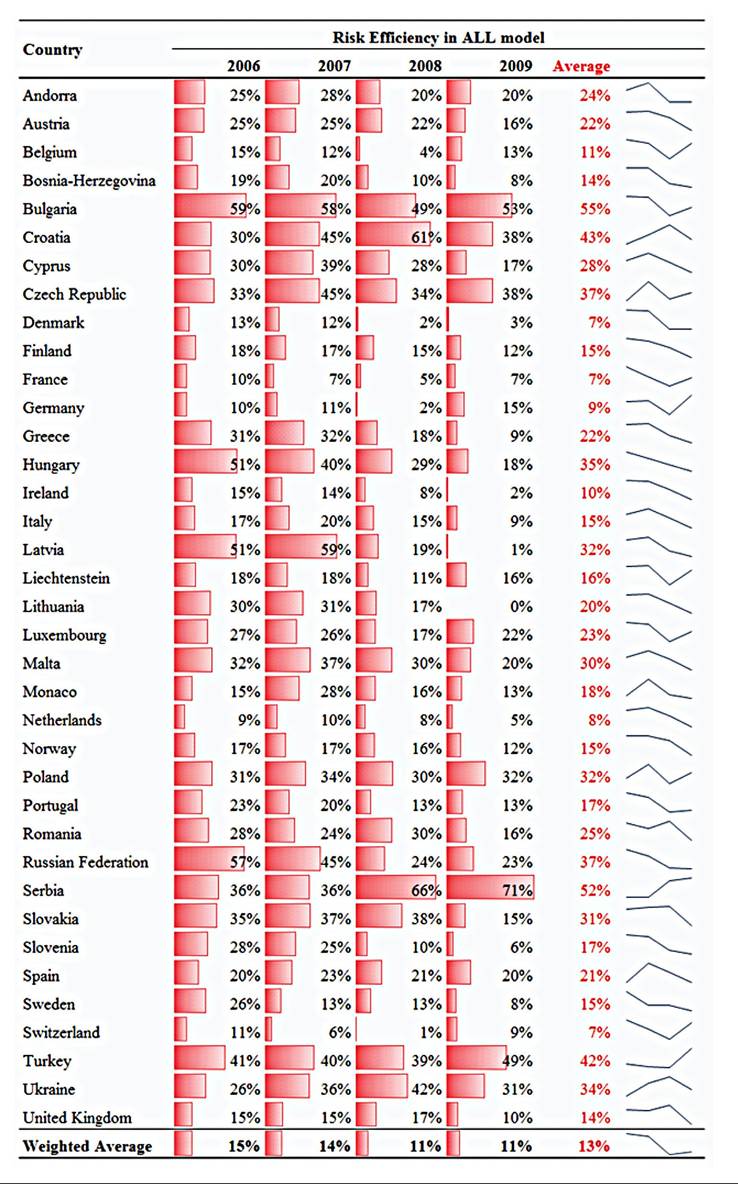
Table 9. Risk efficiency in ALL model (regions, unions, development level, size etc.)
global crisis has led to discussions for adopting a stronger regulatory and supervisory framework, to ensure more resistant financial institutions against redefined risks and to implement more rational and effective measures. For this reason, these ratios need further analysis as regards their association with risk to see whether profitability is proportional to risk levels or not. Even apparently perfect values of performance parameters may prevent a situation of deterioration in which decreasing risk efficiency is on the backstage. In line with this, a proper measurement of efficiency should include the effects of risks on these indicators, since the success of banks in managing their performance is expected to be largely dependent on the correct pricing and management of risks resulting from banking activities. With this study, we aim to benchmark the relationship between the risk profiles of European commercial banks and their performance indicators during the 2006-2009 period using Window analysis with SBM of DEA so that any changes in the performance during the global financial crisis can be captured too. The results make it possible to observe the risk efficiencies of banks based in different countries as regards unions, regions, development levels, whether or not they are domestic or foreign, types of ownership, if they are exchange listed or not, and in terms of size.
The results of all of the models show that there is an extensive difference between banks of the same country and banks in different countries based on exposed risks and performance indicators. Risk increment is not always compensated by a profitability increase. Although there is a positive correlation between risk and performance indicators, this relationship is not observed in all banks. Identifying those banks which do not hold to this basic risk and reward relation may provide additional insight about such banks.
The financial crisis substantially decreased the risk efficiency of all banks, especially in 2008 and some banks began to recover slightly in 2009. Deterioration was more notable for banks in developed countries while some emerging markets, such as southeastern Europe, even boasted improvements. Nonetheless, during the whole period, the banks in developing countries were found to be more efficient than those in developed countries. It was also found that small banks with 10-25 billion in assets outperformed all banks of other sizes. That may indicate that their size gives them the ability to quickly adapt to new developments.
Benchmarking banks allows banks to revise their position, as high risk levels associated with comparatively low profitability is not sustainable. These banks should search for ways to move towards a highly profitable and high risk-efficient region.
REFERENCES
Allen, F., & Santomero, A. M. (1997). The theory of financial intermediation. Journal of Banking & Finance, 21(11-12), 1461-1485. doi:10.1016/ S0378-4266(97)00032-0
Asimakopoulos, I., & Athanasoglou, P. P. (2012). Revisiting the merger and acquisition performance of European banks. International Review of Financial Analysis. doi:10.1016/j.irfa.2012.08.010
Avkiran, N. K. (2011). Association of DEA super-efficiency estimates with financial ratios: Investigating the case for Chinese banks. Omega, 39(3), 323-334. doi:10.1016/j.omega.2010.08.001
Baltensperger, E. (1980). Alternative approaches to the theory of the banking firm. Journal of Monetary Economics, Australia.
Boussofiane, A., Dyson, R. G., & Thanassoulis,
E. (1991). Applied data envelopment analysis. European Journal of Operational Research, 52(1), 1-15. doi:10.1016/0377-2217(91)90331-O
Cook, W. D., & Seiford, L. M. (2009). Data envelopment analysis (DEA)-Thirty years on. European Journal of Operational Research, 192(1), 1-17. doi:10.1016/j.ejor.2008.01.032
Cooper, W. W., Seiford, L. M., & Tone, K. (2007). Data Envelopment Analysis: A Comprehensive Text with Models, Applications, References and DEA-Solver Software. USA: Springer.
European Central B ank. (2010). Beyond Roe-How to measure bank performance. Appendix to the report on EU banking structures. Retrieved from http://www.ecb.europa.eu/pub/pdf/other/beyon- droehowtomeasurebankperformance201009en
Fethi, M. D., & Pasiouras, F. (2010). Assessing bank efficiency and performance with operational research and artificial intelligence techniques: A survey. European Journal of Operational Research, 204(2), 189-198. doi:10.1016/j. ejor.2009.08.003
Fiordelisi, F., Marques-Ibanez, D., & Molyneux, P. (2011). Efficiency and risk in European banking. Journal of Banking & Finance, 35(5), 1315-1326. doi:10.1016/j.jbankfin.2010.10.005
Paradi, J. C., Yang, Z., & Zhu, H. (2011). Assessing Bank and Bank Branch Performance. In W. W. Cooper, L. M. Seiford, & J. Zhu (Eds.), Handbook on Data Envelopment Analysis (Vol. 164, pp. 315-361). Springer, US. doi:10.1007/978- 1-4419-6151-8_13
KEY TERMS AND DEFINITIONS
Data Envelopment Analysis: A frontierbased nonparametric method that measure and benchmark the efficiency of a unit by maximizing the ratio of weighted outputs to weighted inputs and then normalizes the ratio according to best performing units.
Intermediation Approach: Assumes banks as intermediary and estimates the efficiency in converting resources (deposits, security issues, owner’s equity etc.) into assets (loans, other earning assets, etc.).
Net Interest Margin: Net interest income over average earning assets. It is one of the most important indicators used in observing the performance of banks.
Production Approach: Treats a bank as a production unit and measures the success of using some resources (personnel number or salary, equipment, other non-interest expenses, etc.) as input to produce deposits, earning assets, nonearning assets, interest income, non-interest income and other products.
Profitability Approach: Measures how efficiently a bank maximizes its profits by decreasing expenses while increasing revenue. Therefore, the cost-related items (personnel expenses, noninterest expenses, loan loss provisions, etc.) are used as inputs and revenue-related items (net interest income, non-interest income, etc.) are used as outputs.
Return on Assets: An indicator reflecting how efficiently a bank utilizes its assets to generate profit and it is calculated by dividing the net income by average assets.
Return on Equity: An indicator reflecting how efficiently a bank utilizes its equity to generate profit. ROE is one ofthe most important indicators that reflect the performance of banks.
Risk Efficiency: The success of maximizing performance indicators in comparison to the lowest possible risk indicators.
Slacks Based Model: A DEA model that, different than basic models, deals with input excess and output shortfall simultaneously and incorporates slacks into calculation.
This work was previously published in Global Strategies in Banking and Finance, edited by Hasan Dincer and Umit Hacioglu, pages 28-55, copyright 2014 by Business Science Reference (an imprint of IGI Global).