Correlation Behaviour with Regard to Trading Activity
In this section, we examine, with regard to the trading activity in EUR/USD, the dynamic relationship of the number of buy and sell orders, and the number of opening and closing positions (Figure 1).
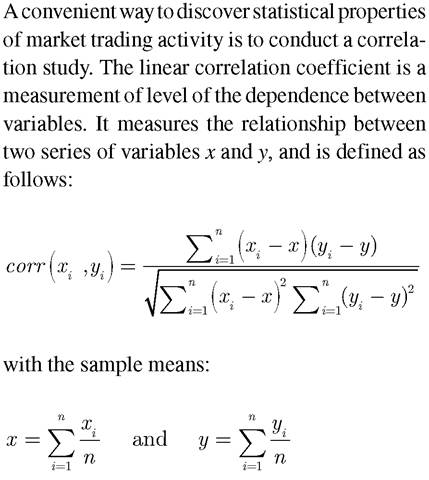
This is done using hourly correlation calculation intervals over January 2009. This analysis helps in understanding the direction of the trading activity flow in the market, and how the trading activity direction could affect market behaviour.We found that an increase in the number of buy orders induces an increase in the number of sell orders, and vice versa. Conversely, we can hypothesise that an increase in the number of buy orders would lead to a rise in the number of sell orders, and vice versa. Such a relationship exists also for the number of opening positions against the number of closing positions for EUR/USD, Figure 1b. Figure 1a shows the relationship of the hourly number of buy and sell orders for EUR/USD during January 2009. We can observe that the dots in Figures 1a and 1b form almost a straight line that slopes upwards to the right. This is a reflection of a positive linear relationship between the number of buy and sell orders (Figure 1a), as well as the number of opening and closing positions (Figure 1b). The strength of their positive correlation is reflected in their correlation coefficient, which is 1 for the number of buy and sell orders. In addition, the correlation coefficient is 1 for the number of opening and closing positions. The hourly number of buy and sell orders varies in the same direction. It is important to point out that this positive correlation does not mean that changes in the number of buy orders cause the changes in the number of sell orders, and vice versa. To determine what causes changes in the direction of number of trading activity, an assessment of the overall market conditions must be conducted.
6.2.