Seasonal Patterns of Trading Activity
A periodic pattern exhibiting in the flow of market trading activity is referred to as seasonal. This seasonality of trading activity has been found in FX market trading activity at intraday and in-
Figure 1.
The hourly relationship for (a) the number of buy and sell EUR/USD orders (left) and (b) the number of opening and closing EUR/USD positions: A sampling interval of ∆t =1 is chosen and the sampling period covers 31 days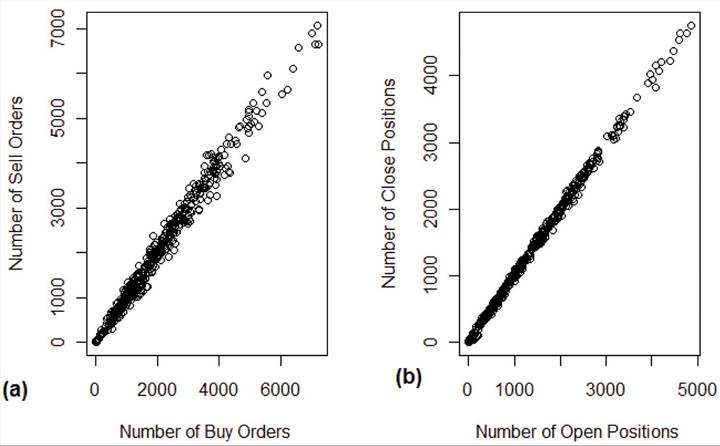
traweek frequencies (Figure 2). The intraday and intraweek analysis of trading activity shows the worldwide FX market trading activity as a function of daytime and weekdays. The seasonality statistics reveal a great amount of information about the FX market’s active trading hours, volume of trading activity, and how the trading flow might develop. The analysis outcome allows us to tackle the seasonality patterns of trading activity from the 24-hours trading round in the worldwide FX market in different geographical locations. The behaviour of the intraday patterns of trading activity is associated with the changing present in the worldwide FX market’s main market centres (e.g., London, Tokyo, and New York). These different market centres around the globe have different opening and closing trading times. When the trading hours of these market centres overlap, the number of trading activity increases due to more traders participating in the market. Overlapping business hours are said to take place when two or more market centres are open simultaneously.
Intraday Seasonality of Trading Activity
The intraday seasonality analysis constructs a uniform time grid with 24 hourly intervals, showing the trading activity of the daily business trading hours of the main market centres in the worldwide FX market. It is defined by means of the hourly changes in market trading activity over a defined period of time.
In other word, it stands for the aggregated number of trading activities occurring in each hour (hour 0 to hour 23) of the day, divided by the total number of trading activity over a defined time period.Figure 2a constructs a uniform time grid with 24 hourly intervals, showing the intraday seasonality for EUR/USD trading activity that existed on the individual traders’ historical transactions dataset. We can spot the double U-shaped pattern of trading activity that is reported in the literature (Dacorogna, et al., 2001; Ito & Hashimoto, 2006). To illustrate this phenomenon, during the first trading hours of the day (in hours GMT),
Figure 2. The intraday and intraweek seasonality of EUR/USD trading activity
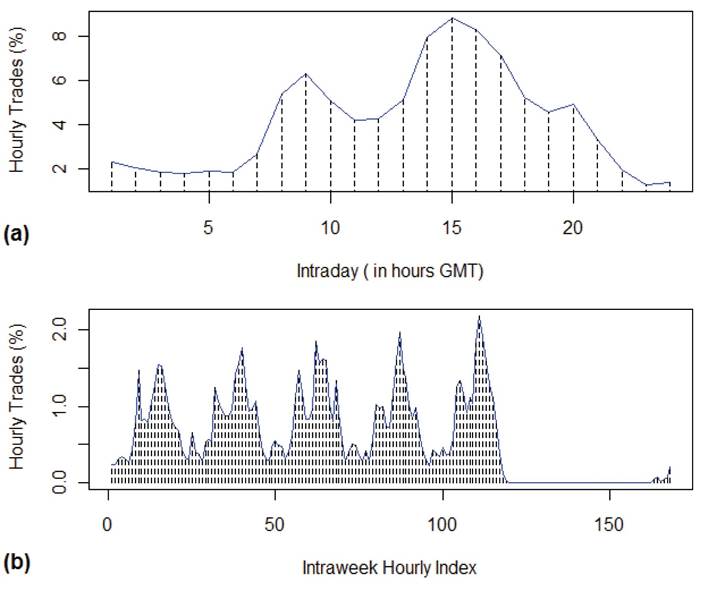
the East Asia market centres were active, and a high number of trading activity is taking place. Then the trading activity declines slightly due to a market centre lunch break and closing time. Following that, the trading activity increases sharply around 7:00 am GMT, which is when there is are overlapping trading hours between the East Asia and the European FX market centres. The trading activity increases sharply around 01:00 pm GMT due to the overlap between the business hours of the Europe and those of the American FX market centres.
Afterwards, the number of trading activity starts to decline around 4:00 pm GMT, which is when the London market closes, and declines sharply around 9:00 pm GMT when the New York market closes.
The analysis of the intraday seasonality of trading activity indicates that the trading activity starts to peak within the opening trading times of the market centres in the morning. Following that, the trading activity declines during the lunch break of the market centres and then peaks in the afternoon again. During the market centres’ closing hours, the trading activity gradually declines. The intraday seasonality of trading activity has two peaks in which the second peak is higher than the first.
The first peak of trading activity takes place when the European FX market centres are open, while the second peak takes place when the European and American FX market centres are open simultaneously. The minimum hourly number of market trading activity outside weekends occurs during the first opening hour of the Sydney market, about 10:00 pm GMT time, when it is nighttime in America and Europe.Intraweek Seasonality of Trading Activity
Due to the small number of participants in the FX market during weekends, weekends witness extremely low trading activity. This in turn implies weekly periodicity patterns with regard to the flow of FX market trading activity. Consequently, it is imperative to add intraweek statistics to the intraday statistics when analysing the flow of FX market trading activity (Dacorogna, et al., 2001). The intraweek analysis of FX market trading activity uses a uniform time grid of 168 hours from Monday 0:00 - 24:00 to Sunday 0:00 - 24:00 (GMT) to display the aggregated number of trading activities in each hour of the weekdays, over a specified period of time. This demonstrates the active trading period of the main FX market centres during the day, the same as for the intraday seasonality of trading activity.
Figure 2b shows the intraweek seasonality for EUR/USD trading activity that exists on the individual traders’ historical transactions dataset. The patterns can be explained by considering the weekend effect and the main market centres’ business trading hours during the day. An extremely low level of trading activity takes place from Friday at 21:00 to Sunday evening at 22:00 as a result of the weekend effect. In contrast, the main FX market business trading hours demonstrate the active trading period of a working day. We can see that the maximum number of daily hours (around 13:00 to 15:00 GMT) of trading activity occurs during the overlapping business hours in which European and American market centres are open simultaneously.
7.