Evidence on US Banks in the Great Recession
The banking crisis in the Great Recession provides a natural experiment to test whether the largest banks revealed disproportionately large losses as a consequence of taking undue risks prompted by the TBTF subsidy and incentive distortion.
The same dataset used in testing the Modigliani- Miller (M&M) hypothesis for US banks used in chapter 3 can be applied to examine this question. These data are from the 10-K reports filed with the Securities and Exchange Commission.A dividing line frequently used for TBTF is $100 billion in assets. There were 16 large banks above this threshold in 2006-07. Data for the next 32 banks in order of size provide a basis for the comparator non-TBTF set of banks. These banks had assets of $5.4 billion to $95 billion (2006-07 average).
Figure 5.1 Change in net income relative to assets between 2006-07 and 2008-10 for 48 large US banks and natural logarithm of asset size
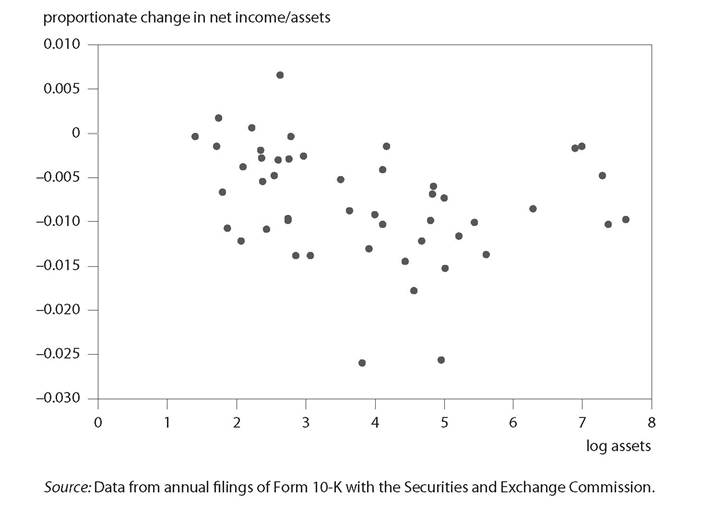
Figure 5.1 shows the change in average net income relative to assets from the precrisis base in 2006-07 to the crisis period of 2008-10, on the vertical axis, and the natural logarithm of base period assets (billions of dollars) on the horizontal axis, for these 48 medium-sized and large banks. The natural logarithm of 100 is 4.6, so the dividing line between mediumsized and TBTF banks is slightly to the right of the center in the chart.
The figure shows typical reductions in the net income-to-assets ratio of about 1 percentage point between the two periods, with reductions as large as about 2.5 percent of assets. There is no clear dichotomy between smaller reductions in net income for banks below the TBTF range (on the left side) and larger reductions for TBTF banks (on the right side).
Table 5.1 presents corresponding data averaged for the two groups and adds two other measures of bank results: charge-offs as a fraction of total assets and nonperforming assets as a fraction of total assets.
The table reports the levels in each of the two periods as well as the change between the two periods. It also reports the t-statistic in a test for difference of meansTable 5.1 Indicators of relative impact of the Great Recession on
largest banks compared with medium-sized banks in the United States (percent)
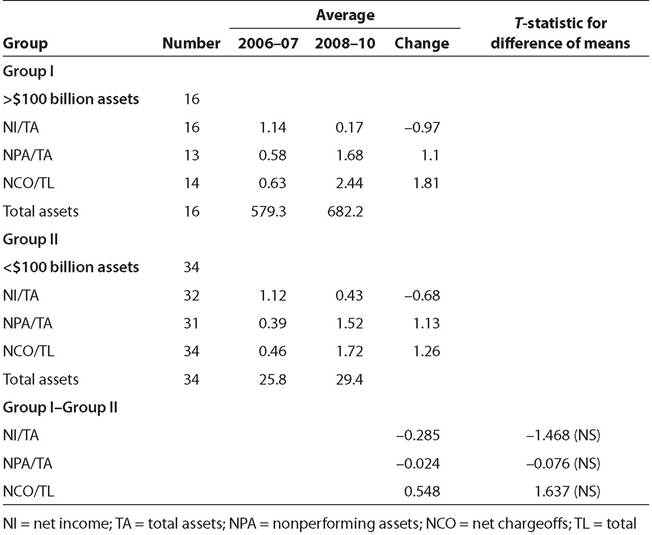
loans; NS = not statistically significant at the 5 percent level Source: Data from annual filings of Form 10-K with the Securities and Exchange Commission.
between two populations.[169] The average size of the largest 16 banks was about $580 billion in the base period, about 20 times the average size of the next 34 largest banks. Both groups had relatively similar net income relative to assets in 2006-07 (about 1.1 percent). This metric declined more for the largest banks by 2008-10 (almost 1 percentage point, compared with about two-thirds of 1 percentage point for the medium-sized banks). However, as suggested by inspection of the loose scatter in figure 5.1, the difference between the two groups with respect to the size of this decline was not statistically significant at the 5 percent level.
Two alternative measures of impact are also shown: the ratio of nonperforming assets to total assets and the ratio of net charge-offs to total liabilities. For these two measures, an increase represents a deterioration in outcome.
As it turns out, for nonperforming assets, the largest banks fared better than the medium-size banks. For net charge-offs, the largest banks showed worse outcomes. However, neither of the two alternative measures showed a statistically significant difference between the changes for the two groups. The absence of a significantly worse outcome for the largest banks than for the medium-size banks casts doubt on the prominence of the role of excessive risk taking induced by TBTF dynamics, because when the crisis arrived the TBTF banks performed much like the medium-size banks.
The tests in table 5.1 exclude banks that failed or were forced to be taken over in the crisis, because there are no data for their performance in the crisis period. An important question is thus whether there is a survivor bias in the analysis. The frequency of failures was slightly smaller in the large-bank group. Five institutions with more than $100 billion in assets failed (Lehman) or were forced into takeovers (Bear Stearns, Wachovia, Washington Mutual, and Countrywide). They represented 24 percent of the large-bank population (5/(16 + 5)). In comparison, 13 banks with assets of $5 billion to $100 billion each experienced failure, representing 28 percent of the bank population for the medium-size group (13/(34 + 13)).[170] Consideration of the survivor problem would thus not seem to change the finding that the large banks fared no worse in the crisis than the mediumsize banks.