From Conventional Mortgages to Nonconventional Mortgages
It is important to dig down to understand how the financial institutions behaved strategically to face these opportunities and challenges. But while vertically integrated financial institutions were on the rise in the 1990s, it was really only with the opportunities presented by the huge expansion of the mortgage origination and securitization markets after 2000 that those opportunities were fully realized.2 The 1990s and 2000s witnessed two important forms of consolidation: first, a growing concentration of mortgage originators, and second, the growing use of mortgages in securitization.
These changes are consistent with the view that vertical integration strengthened in this period.In 1992, the twenty-five largest financial institutions controlled only 30 percent of the mortgage origination market. The collapse of the saving and loan banks and the fragmentation of the market for both origination and securitization meant that the markets were populated by specialists, not generalists (Jacobides, 2005). This led to the rise of the originate-to-distribute model of the market where originators would sell off loans to brokers and wholesalers, who might then sell them to banks, or directly to the GSEs. Then, investment banks would be hired to underwrite and sell MBSs. Finally, the MBSs would end up in the portfolios of a wide variety of financial institutions. This disintegration is accurately reflected in the fact that originators were widely dispersed and did not control much market share.
But during the 1990s and continuing throughout the 2000s, concentration of origination steadily proceeded. By 2000, the twenty-five largest financial institutions controlled 70 percent of the market for both prime and subprime lenders. By 2008, this had increased to 90 percent (Inside Mortgage Finance, 2009). This did not make mortgage origination a particularly concentrated market by conventional measures (such as the Herfindahl index).
But the goal of consolidation was not to create an oligopoly or monopoly in order to raise prices to consumers for originating mortgages. The goal instead was to guarantee integrated banks a supply of mortgages to securitize. By buying up market share in origination, financial institutions could secure a supply of mortgages to turn into securities and create a pipeline where they could reap fees at all stages of production.A similar process was occurring in the growth of securitization of mortgages. In 1995, a little under 50 percent of conventional mortgages were being turned into securities. Mortgages from the subprime market, which was quite small at this early date, were being securitized at a rate of only 28 percent. These figures suggest that at least half of all mortgages were still being held in portfolios as investments. Throughout the late 1990s, the rate of securitization of mortgages of both types rose, and by 2000, about 60 percent of all mortgages were being securitized. Again, these low levels of securitization reflected the fragmentation of the mortgage origination market in the early 1990s and, even more so, the fragmentation of investors. Many mortgages throughout the 1990s were not part of the originate-to-distribute system, and about half ended up being held by investors who owned individual mortgages. But beginning in 2000, the rate of securitization rose dramatically. By 2007, 90 percent of all mortgages eventually ended up in securities (Inside Mortgage Finance, 2009).
What caused this to happen? This reflected two forces. First, as I have already suggested, the demand for MBSs after 2000 rose dramatically, as they became safe and high-yielding investments for many financial institutions. This meant that mortgages as the raw materials for securitization became more valuable as inputs into a production process. Financial institutions that were in the securitization business had to buy more mortgages in order to feed the demand for MBSs.
Given this demand, this meant buying up originated mortgages at higher and higher rates in order to create those securities. Second, vertically integrated production was a good tactic to guarantee that there were enough mortgages for throughput to make MBSs. By owning originators or buying them up, vertically integrated securities producers were able to ensure themselves a supply of mortgages to drive their securitization businesses. As the demand for securities increased even in the face of a lower level of origination activity after 2003, getting mortgages became even more paramount in order to keep securitization machines going. This was all compounded by the fact that as more and more financial institutions entered both the origination and securitization businesses, mortgages became scarcer and thus more likely to end up in securities.The one part of the story that I have not yet documented is how a few large financial institutions came to dominate both origination and securitization. Table 5.1 shows how this worked over time by examining the identities of the nine largest originators and the nine largest issuers of securities in both the conventional and subprime markets. In the world of 1996, one can observe the relatively low level of concentration in origination of both prime and subprime originators. There are several large banks on the list, such as Countrywide, WaMu, and Bank of America, but there are also relatively small and regional banks, such as Norwest, NationsBank, and FT Mortgage. The subprime originators were even smaller financial
Table 5.1 : Dominant firms in selected mortgage finance segments, 1996 and 2007
| Top overall mortgage originators and market share (%) | Top subprime originators and market share (%) | ||||||
| 1996 | 2007 | 1996 | 2007 | ||||
| Norwest | 6.6 | Countrywide Financial | 16.8 | Associates Capital | 7.0 | Citibank | 10.2 |
| Countrywide | 4.9 | Wells Fargo | 11.2 | Money Store | 4.3 | Household Finance (HSBC) | 9.3 |
| Chase | 4.3 | Chase | 8.6 | ContiMortgage | 3.5 | Countrywide | 8.8 |
| Fleet Financial | 2.3 | Citibank | 8.1 | Beneficial Mortgage | 2.8 | Wells Fargo | 8.0 |
| Bank America | 2.0 | Bank of America | 7-8 | Household Finance | 2.6 | 1st Franklin (Merrill Lynch) | 7.0 |
| NationsBank | 1.5 | Washington Mutual | 5.7 | United Co. | 2.3 | Chase | 6.0 |
| WaMu | 1.4 | EMC (Bear Stearns) | 4.0 | Long Beach Mortgage | 2.2 | Washington Mutual | 5.8 |
| Standard Federal | 1.3 | 1st Franklin (Lehman) | 3.9 | Equicredit | 2.1 | EMC (Bear Stearns) | 4.1 |
| FT Mortgage | 1.3 | Residential Capital (GMAC) | 3.2 | Aames Capital | 2.0 | Ameriquest (Lehman Brothers) | 3.3 |
Table 5.1 : (continued)
| Top nonagency MBS issuers and market share (%) | Top subprime MBS issuers and market share (%) | ||||||
| 1996 | 2007 | 1996 | 2007 | ||||
| GE Capital | 8.4 | Countrywide | 13.6 | Money Store | 10.3 | Merrill Lynch | 10.1 |
| Independent National | 5-0 | Wells Fargo | 7.8 | United Co. | 6.4 | Countrywide | 7.9 |
| NW Assets | 4.5 | Lehman Brothers | 7.1 | ContiMortgage | 5.3 | Morgan Stanley | 7.8 |
| Merit | 3.6 | Bear Stearns | 6.8 | Beneficial | 5.0 | Lehman Brothers | 5.5 |
| Prudential | 3.3 | Washington Mutual | 5.7 | AMRESO | 4.5 | Bear Stearns | 4.3 |
| Salomon Bros. | 3.3 | Citibank | 5.7 | Aames | 4.3 | Barclays | 3.4 |
| Merrill Lynch | 3.1 | Merrill Lynch | 5.6 | Household Finance | 4.2 | Citibank | 3.3 |
| Donaldson, et. al. | 2.0 | Morgan Stanley | 4.8 | Residential Finance | 4.2 | Wells Fargo | 3.2 |
| Structural Assets | 2.0 | Bank of America | 4.4 | Associates Mutual | 4.1 | Washington Mutual | 2.7 |
Source: Inside Mortgage Finance (2009).
institutions, and many of them were household lenders, not banks. These included such lenders as the Money Store, Associates Capital, and Household Finance.
In 1996, 90 percent of all the MBSs issued were from the GSEs (see Chapter 3). Thus, the data on market shares of nonagency issuers are all for very small producers. While there are a few investment banks on this list (such as Salomon Brothers, Merrill Lynch, and Donaldson, et. al.), most of the firms listed are smaller investors or insurance companies. The issuers of subprime MBSs at this point were many of the firms that specialized in subprime loans. None of the larger investment banks were in this line of business. This is because the business was still small. But it was also because it was viewed as inherently risky. The GSEs were not involved in subprime because their mandate was to issue securities from only conventional mortgages in this era. This made a market segmentation whereby GSEs dominated issuance in the prime market, while securitization of nonconventional loans was conducted almost solely by private firms. Before 2000, given the small size of the nonconventional market, most of the securitization was being done by small financial institutions.
By 2007, the picture for all four markets changed dramatically. The mortgage origination business was dominated by a large number of very large banks. This included Countrywide, Wells Fargo, Citibank, Bank of America, and Washington Mutual. The top issuers included all of these banks plus several of the investment banks such as Bear Stearns, Merrill Lynch, and Lehman Brothers, all of which also owned a mortgage originator. Seven of the top nine originators also appeared on the list of the top nine issuers. This clearly reflects the vertical integration of the largest banks.
The lack of competition from the GSEs for nonconventional mortgages meant that as they increased in volume after 2003, an opportunity to increase production of MBSs based on nonconventional mortgages opened up for private financial institutions.
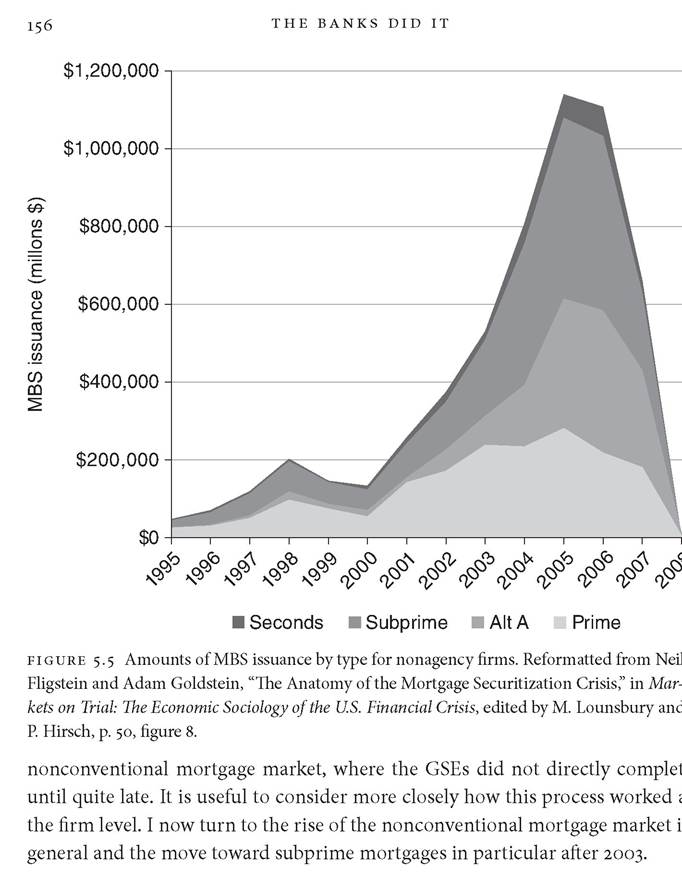
By 2007, seven of the top nine subprime originators appear on the list of the top issuers. Vertical integration clearly had spread not just to the overall origination market but importantly to the subprime part of the market. I note that six financial institutions appear on all four lists: Countrywide Financial, Bear Stearns, Lehman Brothers, Citibank, Bank of America, and Merrill Lynch. Washington Mutual (WaMu) appears on three of the four lists. This suggests that the banks with the largest market shares were involved in the origination and issuance of securities for both the conventional and subprime markets. By the time the crisis hit, the largest integrated banks dominated the origination and securitization businesses.It is useful to see how big the expansion of the nonconventional MBS was after 2000. Figure 5.5 shows that before 2000, the level of private (i.e., non-GSE) MBS production was between $30 billion and $200 billion a year. Most of the MBSs being produced were subprime or Alt-A because the GSEs were not participants in that market. The GSEs obviously had cornered the MBS market for conventional MBSs throughout the 1990s and played the largest role in issuance. Beginning in 2000, with the great increase in securitization, opportunities opened up for non-GSE financial institutions. There was a significant increase in the production of prime MBSs. But the largest increases occurred in the production of subprime, Alt-A, and home equity loans. The overall level of MBS issuance increased from about $150 billion in 2000 to a peak of $1.15 trillion in 2005. The vertically integrated financial institutions named in Table 5.1 grew large and profitable after 2003 by the origination and securitization in the rising market for nonconventional loans. This is important because this expansion is part of why the industry was so susceptible to a crash. At the end, it was their MBS businesses that were producing the most toxic products, and when the bottom fell out, they were the ones whose business models collapsed.
Taken together, there is substantial evidence that the integration of origination and securitization in the largest banks moved from the periphery of the industry to the center from 1990 until 2008. By the late 1990s, there was already integration. Throughout the 1990s, financial institutions increased their origination activities and increasingly securitized the mortgages that were originated. Once the refinancing and new house markets took off in the wake of the dramatic lowering of interest rates, the largest financial institutions increased both their origination and issuance. This integration was most strongly reflected in the