MAKING THE NUMBERS TALK
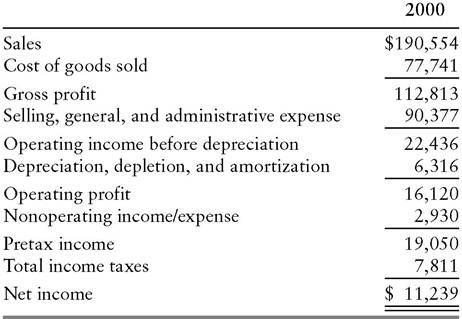
By observing an income statement in its raw form, the reader can make several useful, albeit limited, observations. Boston Beer’s 2000 income statement (Exhibit 3.1) shows, for example, that the company was profitable rather than unprofitable.
The statement also provides some sense of the firm’s cost structure. Selling, general, and administrative expenses (SG&A) were the largest component of total costs. These outlays exceeded cost of goods sold (COGS), an item that includes materials and labor directly involving in brewing.EXHIBIT 3.1 Boston Beer Annual Income Statement ($000 omitted)
Source: Compustat.
A conspicuous feature of Boston Beer’s income statement is the absence of interest expense, reflecting the company’s debt-free balance sheet. This characteristic eliminates one source of earnings volatility—fluctuations in interest rates.1 (Note that even if a company confines its borrowings to fixed- rate debt, its interest expense is variable in the sense that the company may replace maturing debt with higher-cost or lower-cost debt as a consequence of changes in interest rates.) For most beverage producers (and for companies in the industrial sector, generally), rising and falling interest rates have only a limited effect on the earnings. They are not invariably debt-free, but interest expense typically represents a minor portion of their total costs. Changes in interest rates have a dramatic impact, however, on banks and finance companies which have cost structures heavily concentrated in interest expense.
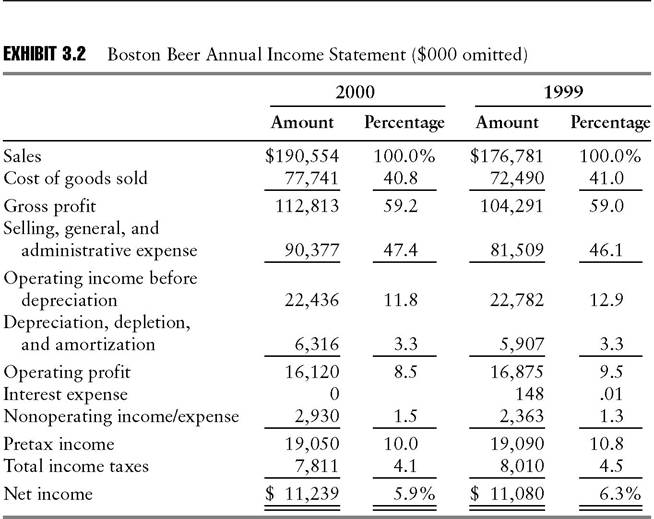
One of the most powerful tools for advancing beyond basic conclusions about a company’s cost structure is the percentage income statement.
In this format, each income statement item is expressed as a percentage of the “top line” (sales or revenues), which is represented as 100%. Recasting the figures in this way permits the analyst to compare a company’s income statement in a meaningful way with its income statement from an earlier year or with an industry peer company’s income statement. The percentage income statement’s facilitation of comparisons gives rise to its other name, the “common form income statement.”Exhibit 3.2 converts Boston Beer’s 2000 income statement to percentages and compares the year’s results with the company’s 1999 figures.
Source: Compustat.
The potential for enriched analytical insight is readily apparent. Most significantly, selling, general, and administrative expense increased from 46.1% to 47.4% of sales.
In encountering a period-over-period variance of this type, an analyst must investigate further to determine what it signifies. Several possible explanations for this change leap to mind. For one thing, competition may be intensifying, forcing the company to step up advertising and promotion outlays. Alternatively, the growth of overhead costs such as salaries of headquarters staff may be increasing faster than sales. In any event, it is imperative for the analyst to understand the underlying trend to judge whether the deterioration in margins is temporary or likely to continue (or worsen) in future periods.
The Management’s Discussion and Analysis (MD&A) section of the annual report may provide some insight into the matter. Another potentially useful source is the company’s investor relations officer.
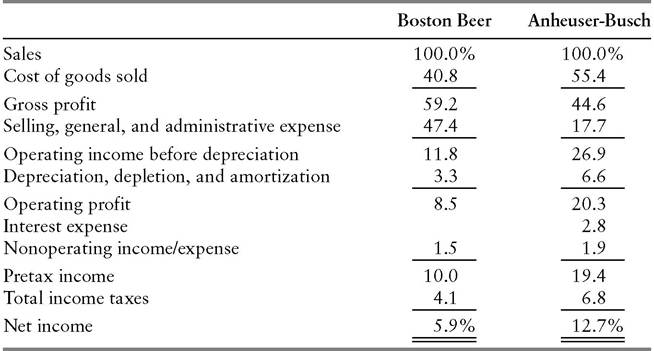
Realistically, though, commentary emanating from within a corporation usually reflects the inveterate optimism of can-do managers. After decades of exposure to the exhortations of motivational speakers, corporate executives typically exude confidence that they will turn the situation around, right up to the steps of the bankruptcy court. Accordingly, analysts should solicit other views of the situation from the company’s customers, suppliers, competitors, and lenders, as well as from analysts who have followed the company over a lengthy period.Besides facilitating comparisons between a company’s present and past results, the percentage income statement can highlight important facts about a company’s competitive standing. Exhibit 3.3 displays the 2000 performance of Boston Beer alongside that of Anheuser-Busch, producer of the leading brand, Budweiser. Despite their vast difference in size, the two companies can be compared head-to-head through the common form approach. The contrast is sharp, with cost of goods sold accounting for 55.4% of the sales dollar at Anheuser-Busch, but only 40.8% at Boston Beer. Despite Boston Beer’s substantial advantage in gross margin, however, Anheuser-Busch achieves a far higher operating margin—20.3% versus 8.5%. With its much greater unit volume, Anheuser-Busch can spread its advertising and other marketing costs across a larger revenue base. Consequently, SG&A expenses represent a dramatically lower portion of its sales dollar (17.7%) than in Boston Beer’s case (47.4%). The SG&A edge enables Anheuser-Busch to overcome the handicap of a 2.8% interest component and bring 12.7% of sales down to the bottom line. That is more than double the net margin achieved by Boston Beer (5.9%).
EXHIBIT 3.3 Boston Beer and Anheuser-Busch Comparative Percentage Income Statements 2000
Source: Compustat.
Contrasting operating strategies explain the large difference between the two companies in percentage of sales represented by product costs (COGS).
Anheuser-Busch’s income statement reflects the heavy costs of doing business the traditional way. The company sells beer produced in breweries that it owns and operates. Boston Beer, on the other hand, relies largely on contract brewing, a strategy of utilizing the excess capacity of breweries owned by other companies.Naturally, the total cost of producing a barrel of beer is the same, whether the brewery sells it under its own label or sells it to another company under a contract brewing arrangement. Nevertheless, it is not surprising that contract brewing can prove economical to Boston Beer. The brewery owner’s fixed costs, including occupancy, depreciation, and interest expense, will be incurred whether the brewery operates at 60% or 90% of capacity. If the company has idle capacity, it can increase its profit by utilizing it to produce incremental volume, even if it sells the beer at a price only slightly higher than its variable cost. Accordingly, a company following Boston Beer’s strategy can potentially negotiate terms under which its share of fixed costs is less than proportionate to its share of the brewery’s output. Its total cost per barrel can therefore be lower than the total cost per barrel to a brewery’s owner-operator (see “Behind the Numbers—Fixed versus Variable Costs,” later in this chapter).
Boston Beer’s management maintains that contract brewing promotes quality control by allowing it to select breweries that use traditional methods. Management adds that brewing in several locations enables the company to hold down its distribution costs. Moreover, according to Boston Beer, multiple production facilities permit it to deliver fresher beer to its customers than competing “craft” brewers, which distribute the output of single breweries over large territories. By not emphasizing ownership of its brewing operations, Boston Beer not only limits its product costs, but also expends half as much of its sales dollar (3.3% versus 6.6%) on depreciation of fixed assets as Anheuser-Busch.
While Boston Beer sources most of its product through contract brewing, it also brews some beer in its own facilities.
Its Boston Brewery supplies limited quantities of beer for the local market. In addition, effective March 1, 1997, the company acquired, through its wholly owned subsidiary, Samuel Adams Brewery Company, Ltd., all of the equipment of an independent brewer located in Cincinnati, Ohio. Pursuant to the agreement, Samuel Adams Brewery also completed acquisition of the Cincinnati brewer’s land and buildings as of November 15, 2000.Boston Beer’s management contended that the deviation from its general approach of contract brewing enhanced its brewing flexibility. A percentage income statement comparison between the company’s results in 2000 and at the time of its 1994 initial public offering (Exhibit 3.4) suggests, though, that the change in operating strategy had a financial impact. Depreciation of fixed property quadrupled from 0.8% to 3.3% of sales over the period. The rise in this essentially fixed cost slightly increased the operating leverage, and therefore, the inherent volatility of Boston Beer’s earnings. Over the five-year period, though, the company managed to reduce cost of goods sold as a percentage of sales, producing a net improvement in operating margin from 7.7% to 8.5%.
The contrasting cost structures of Boston Beer and Anheuser-Busch highlight a potential pitfall of using the percentage income statement. Even though the two companies participate in the same business, a line-by-line comparison of their cost ratios does not definitively answer the question of which company is more efficient. An analyst cannot infer that Boston Beer is able to record a lower ratio of COGS to sales because it purchases its ingredients more economically or uses its labor more efficiently than Anheuser-Busch. Even a comparatively inefficient operator relying on contract brewing would be expected to have lower product costs, in percentage terms, than an integrated company that produces in-house all of the beer it sells.
EXHIBIT 3.4 Boston Beer Annual Income Statement ($000 omitted)
2000 1994
cellpadding=0 style='border-collapse:collapse'>
Amount
Percentage
Amount
Percentage
Sales
$190,554
100.0%
$114,833
100.0%
Cost of goods sold
77,741
40.8
51,926
45.2
Gross profit
112,813
59.2
62,907
54.8
Selling, general, and
size=1 color=black face="Microsoft Sans Serif">
administrative expense
90,377
47.4
53,096
46.2
Operating income before
depreciation
22,436
11.8
9,811
8.5
Depreciation, depletion, and
amortization
6,316
3.3
925
0.8
Operating profit
16,120
8.5
8,886
7.7
Interest expense
233
0.2
Nonoperating income/expense
2,930
1.5
432
0.4
Pretax income
19,050
10.0
9,085
7.9
Total income taxes
7,811
4.1
0
0.0
Net income
$111,239
5.9%
$Ö9,085
7.9%
Source: Compustat.
A similar problem arises with companies ostensibly competing in the same industry, but producing substantially different product lines. For example, some pharmaceutical manufacturers also manufacture and market medical devices, nonprescription health products, toiletries, and beauty aids.
The more widely diversified manufacturers can be expected to have higher percentage product costs, as well as lower percentage research and development expenses, than industry peers that focus exclusively on prescription drugs. Analysts must take care not to mistake a difference that is actually a function of business strategy as evidence of inferior or superior managerial skills. A subtler explanation may be available at the modest cost of contacting some long-established industry watchers. All the while, analysts must watch for evidence that the reported numbers are somehow distorting the company’s true financial performance, the subject of the next section of this chapter.